Winnie Mokeira Onsongo1, Romanus Odhiambo Otieno2, George Otieno Orwa2
1Department of Mathematics, Pan African University Institute of Basic Sciences, Technology and Innovation, Nairobi, Kenya
2Department of Statistics and Actuarial Science, Jomo Kenyatta University of Agriculture and Technology, Nairobi, Kenya
Correspondence to: Winnie Mokeira Onsongo, Department of Mathematics, Pan African University Institute of Basic Sciences, Technology and Innovation, Nairobi, Kenya.
| Email: |  |
Copyright © 2018 The Author(s). Published by Scientific & Academic Publishing.
This work is licensed under the Creative Commons Attribution International License (CC BY).
http://creativecommons.org/licenses/by/4.0/

Abstract
The problem of nonparametric estimation of finite population distribution function using multiplicative bias correction technique is considered in this paper. A robust estimator of the finite population distribution function based on multiplicative bias correction is derived with the aid of a super population model. The properties of the estimator are developed and comparative study with the existing model based and design based estimators is carried to assess the performance of the estimator developed using the simulated sets of data. It is observed that the estimator is asymptotically unbiased and statistically consistent when certain conditions are satisfied. It has been shown that when the model-based estimators are used in estimating the finite population total, there exists bias-variance trade-off along the boundary. The multiplicative bias corrected estimator has recorded better results in estimating the finite population distribution function by correcting the boundary problems associated with existing model based estimators. The simulation results led to the suggestion that the multiplicative bias corrected estimator can be highly recommended in survey sampling estimation of the finite population distribution function.
Keywords:
α-Quantile, Multiplicative Bias Correction, Pilot Smoother
Cite this paper: Winnie Mokeira Onsongo, Romanus Odhiambo Otieno, George Otieno Orwa, Bias Reduction Technique for Estimating Finite Population Distribution Function under Simple Random Sampling without Replacement, International Journal of Statistics and Applications, Vol. 8 No. 5, 2018, pp. 259-266. doi: 10.5923/j.statistics.20180805.04.
1. Introduction
In most scenarios of sample survey, auxiliary information is available for all elements in the population under consideration. Auxiliary information aids in the prediction of finite population parameters and as such it forms a central part of sample surveys. The main idea of nonparametric statistics is to make inferences about unknown quantities without resorting to parametric reduction of the problem. It therefore follows that a model–based approach is used to increase the precision of the estimators by incorporating auxiliary variables. As an approach to such a problem, a super population model is used to describe the relationship between the auxiliary variable and the study variable. Various estimation procedures have been developed to estimate the distribution of a random variable in the past (Zhao et al., 2013).(Chambers and Dunstan, 1986) studied a simple method for estimating the distribution function and the associated quantiles from sample survey data. The study showed that the model based estimator offers significant gains when there exists a strong linear relationship between the survey variable and the auxiliary variable. However, the estimator tends to be positively biased when the true variance is overstated and negatively biased when the true variance is understated. Kuk (1993) used auxiliary information to improve the estimation of population distribution function. Empirical results suggest that the proposed estimator has good robustness properties not enjoyed by the model-based estimator of (Chambers and Dunstan, 1986). In survey sampling, concern is with the proportion of values, say  in the finite population that are bounded by a given constant. Such a proportion is one particular value of the distribution function for the finite population. In particular, estimation of the distribution function is an important objective mainly because it helps to identify the proportion in the population whose values for particular variables lie substantially below or above the population average (Chambers and Dunstan, 1986).Previously studied estimation procedures used kernel smoothers which tend to have boundary problems and require modifications at the boundary points. That is, towards the boundary points the estimators exhibit trade-off between the bias and variance of the estimators. However, alternative bias reduction techniques have been formulated. For a detailed review see Hardle (1986), (Muller and Stadmuller, 1987) and Fan (1992). This study therefore aims at coming up with a nonparametric estimator for the distribution function of finite populations using a bias corrected technique to counter the shortcomings of the previously studied methods of estimation. (Linton and Nielsen, 1994) used the multiplicative bias correction technique in estimating a nonparametric regression function and the results obtained showed that the estimator of the regression function had desirable properties compared to existing estimators including solving the boundary problems. Onsongo (2018) also used the approach by (Linton and Nielsen, 1994) in estimating finite population total.Outline of the paperIn section 2, we propose an estimator for finite population distribution function using a bias correction technique. Asymptotic properties of the estimator are derived in section 3. Empirical simulation of the results is given in section 4 and the conclusion of the findings is given in section 5.
2. Proposed Estimator
In this section, the exact procedure of estimating the population distribution function is now presented. Suppose that  are independent and identically distributed with corresponding survey measurements
  from a common univariate distribution function. The empirical distribution function for finite population is then defined by
  | (1) |
Where I denotes the indicator function of a given set and t is the  - quantile. Let s be a sample of n units drawn from a finite population via simple random sampling without replacement and
  be the non-sampled units of the finite population. Suppose that Y is the survey variable associated with the auxiliary variable X. Then the auxiliary information is known for all elements in the population while the survey variable is only observed for the sample elements. Under the model-based framework, X and Y are assumed to follow a super population model. This study restricts attention to the linear regression model
  | (2) |
For  Where the
  are independent and identically distributed and
  and
and  Where
Where  and
and  are assumed to be smooth functions of
  Using model (1) as a guide, the predictive form of the proposed estimator of the distribution function under the model based approach is
 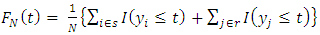 | (3) |
In this paper, the estimator for equation (3) is proposed as 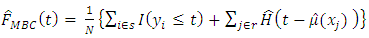 | (4) |
Where  is the model-based nonparametric estimator for
  and
and  is the estimated distribution function of the residuals defined by
  The task is to estimate the second part of equation (4) and to do this, the multiplicative bias correction technique is employed. Suppose that
  are
are  independent pairs of random variables
  with real values. Define a pilot smoother of the regression function as
  | (5) |
Where  are the Nadaraya-Watson kernel weights defined by
 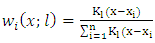 and l is the bandwidth.Then the ratio
  is a noisy estimate of the inverse relative estimation error of the smoother
  given by
  (Burr et al., 2010) showed that this ratio significantly smoothens out the regression function since the residuals in the numerator will cancel out with the residuals in the denominator.Smoothing
  yields
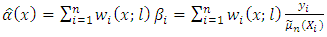 | (6) |
Equation (6) can then be used as a multiplicative correction of the pilot smoother in equation (5) which can now be defined by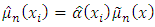 | (7) |
AssumptionsThe following assumptions are made in the estimation of  1. The regression function is twice continuously differentiable everywhere.2. The bandwidth
  is such that
 Using equation (6) in equation (7) easily yields
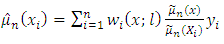 | (8) |
Now suppose that | (9) |
Then  in equation (8) can be expanded as follows
 | (10) |
Where 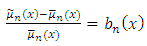 and
and 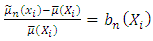 Applying the binomial expansion to
  gives
gives which further reduces to
 | (11) |
where  is the remainder term that involves the terms x and
  Using equation (11) in equation (10) yields
 | (12) |
Substituting equation (11) into equation (8) and using the model  one obtains
 | (13) |
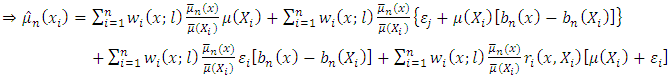 | (14) |
Using the assumption  the remainder terms converge to zero in probability. Therefore
 and equation (14) reduces to
 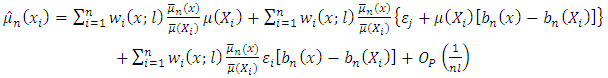 | (15) |
Our estimator for the distribution function for finite population therefore becomes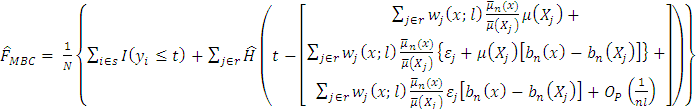
3. Properties of the Estimator under Simple Random Sampling without Replacement
3.1. Asymptotic Unbiasedness of the Proposed Estimator
The asymptotic bias of the nonparametric estimator is defined as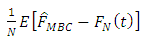 | (16) |
where  is the estimated bias.In order to estimate
  in equation (4), (Chambers et al., 1993) recommended local linear smoothing whereby
  is estimated by averaging only over the sample residuals with X- values that are close enough to
  Therefore
 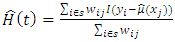 where t is the
  -quantile and
  are the weights that only take non-zero values for sample units i with
  close to
  so that
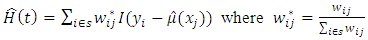 Therefore equation (4) becomes
 As a result,
 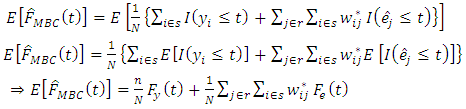 | (17) |
Next, 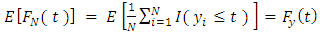 | (18) |
Substituting the results in equation (17) and equation (18) back to equation (16) yields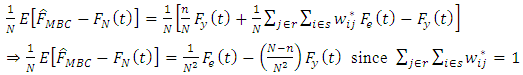
3.2. Asymptotic Variance of the Proposed Estimator
Thus  is asymptotically unbiased.The estimated bias is given by
  Therefore the variance of the estimated bias is
 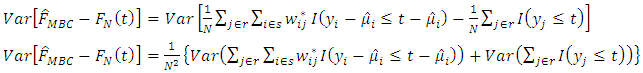 | (19) |
Since the errors are assumed to be independent and identically distributed and therefore have zero covariance.Consider 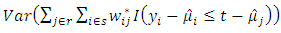 and let
 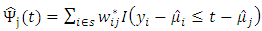 Then
Then  | (20) |
With 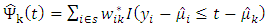 Define
 | (21) |
Suppose that  whenever
  and suppose that the non-sampled units are labelled from 1 to
  Then
Then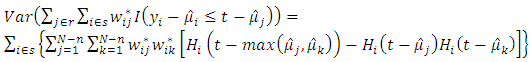 | (22) |
Next,  | (23) |
Substituting equations (22) and (23) into equation (19) yields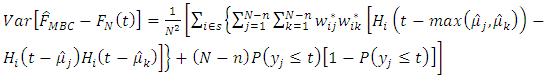 | (24) |
4. Results
In this section, simulation experiments were done to study the performance of the multiplicative bias corrected estimator. A population of 1, 000 auxiliary values  are generated as independent and identically distributed uniform random variables. The corresponding survey values y i are generated using the super-population model
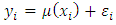 with the mean functions being linear, quadratic and cosine. Nadaraya-Watson kernel weights are used in the smoothing of
  to obtain the rough estimator,
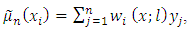 of the mean function
  A ratio
  is evaluated and is smoothed further to obtain the correction factor
  which is then used together with the rough estimator to obtain the multiplicative bias corrected estimator,
  of the mean function. The existing estimators for distribution functions for finite populations that were used for comparison with our developed estimator
  are:i.
 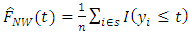 which was suggested by Nadaraya-Watson (1968).ii.
 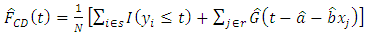 (Chambers & Dunstan 1986)iii.
  (Rao et al 1990).iv.
 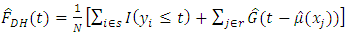 (Dorfman & Hall (1993) where
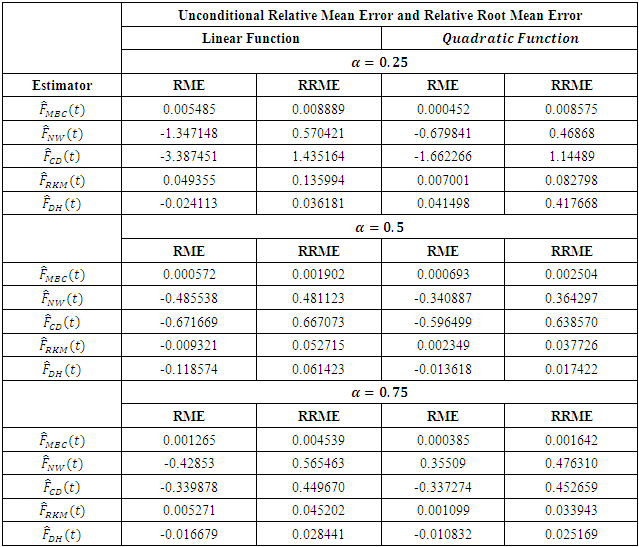
  is the linear estimator of the mean function.Table 1 shows the unconditional Relative Mean Error (RME) and Relative Root Mean Error (RRME) for the estimators at various values of the quantile
  (i.e. 0.25, 0.5 and 0.75). Linear and quadratic mean functions were used to obtain the tabulated results. Similar results and conclusions can be obtained using other mean functions such as sine, cosine, bump etc.
Table 1. Unconditional Relative Mean Errors and Relative Root Mean Errors
 |
| |
|
The unconditional Relative Mean Error and Relative Root Mean Error for the estimator  are calculated as:
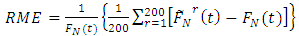 and
and 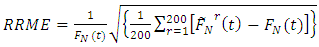 respectively where r represents the level of iteration.
  can be seen to be a very efficient estimator of the empirical distribution function at all levels of the
  quantile followed closely by
  and
and  proved to be a very inefficient estimator at all levels of
  Further, graphical comparison of estimators was done which further affirmed the results tabulated above. Figures 1 & 2 gives a plot of all the estimators listed above.
 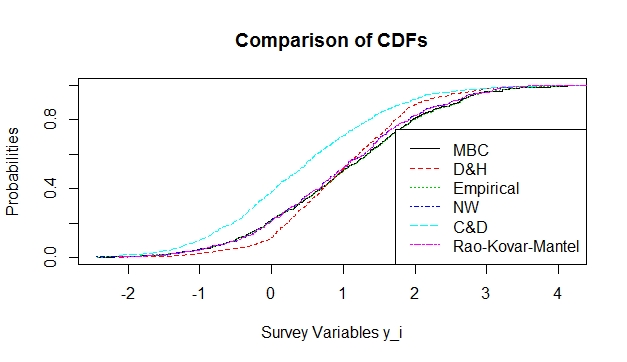 | Figure 1. Plot of various Distribution functions using a linear function |
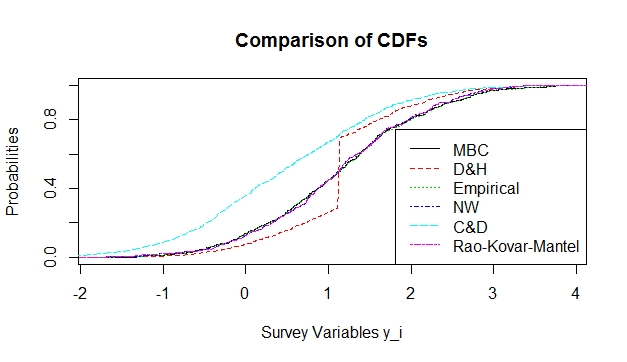 | Figure 2. Plot of various Distribution functions using a quadratic function |
 overestimates the empirical distribution function at all points while
  and
and  give an almost perfect estimation of the empirical distribution function.On the other hand
  underestimates the true function at some points towards the lower tail while it overestimates the same function at other points along the upper tail. The conditional performance of the estimator was done and was compared with the performance of the estimator.To do this, 200 random samples, all of size 400, were selected and the mean of the auxiliary values
  was computed for each sample to obtain 200 values of
  These sample means were then sorted in ascending order and further grouped into clusters of size 20 such that a total of 10 goups was realized. Further, group means of the means of auxiliary variables was calculated to get
  Empirical means and biases were then computed for all the estimators
  and
and  The conditional biases were plotted against
  to provide a good understanding of the pattern generated. Figures 3 & 4 show the behavior of the conditional biases realized by all the estimators of distribution functions.
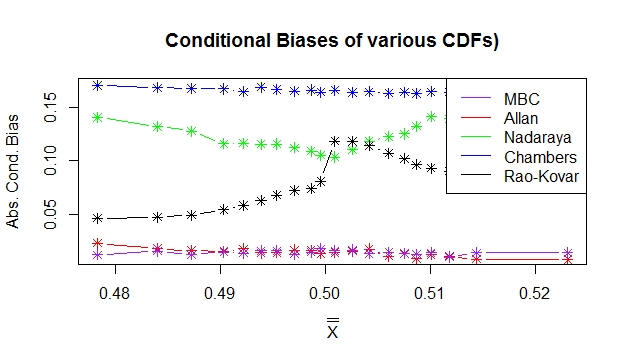 | Figure 3. Absolute conditional biases for the estimators using a linear mean function |
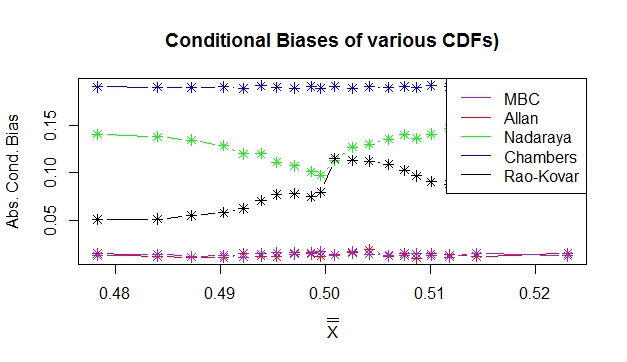 | Figure 4. Absolute conditional biases for the estimators using a quadratic mean function |
 and
and  performed equally better than all other estimators of the true distribution function and it can be seen that sample balancing does not affect the performance of the estimators.
5. Conclusions
In conclusion, using the results from Table 1 and the Figures 3 & 4  was found to be an efficient estimator of the distribution function for finite population.
  was found to be very inefficient of all the estimators with large conditional bias compared to the other estimators.
 can therefore be used in estimating distribution functions for various units in the population in various sectors of the economy.
References
| [1] | Burr, T., Hengartner, N., Matzner-Lober, E., Myers, S., and Rouviere, L. (2010). Smoothing low resolution gamma spectra. IEEE Transactions on Nuclear Science, 57(5): 2831–2840. |
| [2] | Chambers, R. and Clark, R. (2012). An introduction to model-based survey sampling with applications, volume 37. OUP Oxford. |
| [3] | Chambers, R. L., Dorfman, A. H., and Wehrly, T. E. (1993). Bias robust estimation in finite populations using nonparametric calibration. Journal of the American Statistical Association, 88(421): 268–277. |
| [4] | Chambers, R. L. and Dunstan, R. (1986). Estimating distribution functions from survey data. Biometrika, 73(3): 597–604. |
| [5] | Dorfman, A. H. and Hall, P. (1993). Estimators of the finite population distribution function using nonparametric regression. The Annals of Statistics, pages 1452–1475. |
| [6] | Fan, J. (1992). Design-adaptive nonparametric regression. Journal of the American statistical Association, 87(420): 998–1004. |
| [7] | Hardle, W. (1986). A note on jackknifing kernel regression function estimators (corresp.). IEEE transactions on information theory, 32(2): 298–300. |
| [8] | Kuk, A. Y. (1993). A kernel method for estimating finite population distribution functions using auxiliary information. Biometrika, 80(2): 385–392. |
| [9] | Linton, O. and Nielsen, J. P. (1994). A multiplicative bias reduction method for nonparametric regression. Statistics & Probability Letters, 19(3): 181–187. |
| [10] | Muller, H. G. and Stadtmuller, U. (1987). Variable bandwidth kernel estimators of regression curves. The Annals of Statistics, pages 182–201. |
| [11] | Onsongo, W. M. (2018). Nonparametric Estimation of Finite Population Total. PhD thesis, JKUAT-PAUSTI. |
| [12] | Rao, J. N. K., Kovar, J. G., and Mantel H. J. (1990). On Estimating Distribution Functions and Quantiles from Survey data Using Auxiliary Information. Biometrika, pages 365-375. |
| [13] | Zhao, P. Y., Tang, M. L., and Tang, N. S. (2013). Robust estimation of distribution functions and quantiles with non-ignorable missing data. Canadian Journal of Statistics, 41(4): 575–595. |

 Abstract
 Reference
 Full-Text PDF
 Full-text HTML