International Journal of Statistics and Applications

p-ISSN: 2168-5193    e-ISSN: 2168-5215

2018;  8(5): 226-248

doi:10.5923/j.statistics.20180805.02


Logistic Regression Predictive Models of Job and Degree Satisfaction among Greek Social Sciences Graduates

Aglaia Kalamatianou

Department of Sociology, Panteion University of Social and Political Sciences, Leof. Syngrou, Athens, Greece

Correspondence to: Aglaia Kalamatianou, Department of Sociology, Panteion University of Social and Political Sciences, Leof. Syngrou, Athens, Greece.

Email:

Copyright © 2018 The Author(s). Published by Scientific & Academic Publishing.

This work is licensed under the Creative Commons Attribution International License (CC BY).
http://creativecommons.org/licenses/by/4.0/

Abstract

Job and degree satisfaction of graduates are key indicators within the educational evaluation and effectiveness. Focusing on social science graduates, these indicators are of particular importance given a continued and widespread scepticism regarding the value of social sciences in the labour market, which in turn gives rise to perceptions questioning the value of social sciences per se. This study utilized secondary data from a sample of 6,412 social science alumni to perform logistic regression analyses in order to determine the predictive effects of demographic, educational and job characteristics on the degree and job satisfaction. The results, which are given in terms of the probabilities that graduates are satisfied with their degree or job, reveal both significant and non-significant relationships between predictors and outcome variables. The effect of a positive university experience to a corresponding work experience is particularly underlined. In addition, comparisons with the results of similar studies lead to the conclusion for a good position of the Greek social science graduates, regarding degree and job satisfaction, in the European context. The utility of logistic regression in the analysis of such issues is also highlighted.

Keywords: Degree satisfaction, Job satisfaction, Social science graduates, Greece, Binary Logistic regression

Cite this paper: Aglaia Kalamatianou, Logistic Regression Predictive Models of Job and Degree Satisfaction among Greek Social Sciences Graduates, International Journal of Statistics and Applications, Vol. 8 No. 5, 2018, pp. 226-248. doi: 10.5923/j.statistics.20180805.02.

1. Introduction

The enormous expansion of higher education, observed worldwide for more than half a century, has undoubtedly benefited people, e.g. economic growth, reducing inequalities [91, 76, 35], but it has also caused worries regarding, inter alia, the quality and value of the education offered and the professional rehabilitation of graduates. In this context, the field of study seems to have an interesting role. In general, research shows that graduates of more applied or technically oriented fields have better employment prospects compared to those of more theoretical fields, such as social sciences [72, 10, 67]. This is based on the premise that social sciences, and in particular soft social sciences, by their nature are not intended to develop occupation-specific skills. This results in a continued and widespread scepticism about their value in the labour market, which in turn gives rise to perceptions questioning the value of social sciences per se [22, 101, 49]. An assessment of this issue could be based on the views of such sciences graduates about how happy or satisfied are they from their studies and their work.
Satisfaction in general, constitutes a central concept in Social Indicators Research as a measurement of quality-of-life in society [98]. Specifically, it reflects the ‘subjective’ dimension of quality of life which is how people personally appreciate and evaluate their lives and separate sides of (i.e., health, education, job, etc.); the term ‘subjective’ implies that the criteria for judgment may vary from person to person, the standards are not explicit, and external judgment is not possible. Thus satisfaction (or alternatively, pleasure) concisely states how much likes something to someone.
Mutatis mutandis, in the case of higher education graduates, the concepts Degree Satisfaction (DS henceforth) and Job Satisfaction (JS henceforth) have been used correspondingly for assessing how individuals judge the quality of their studies and work and all benefits arising from them. Both concepts have emerged as key parameters in the evaluation process of higher education institutions [33, 12, 92, 64, 29, 105].
DS is an important indicator of measuring the efficiency and effectiveness of the institutions, given the ever-increasing pressure to improve the quality of their services. It reflects the extent to which the curriculum provided meets the needs and aspirations of students, but it also comprises wider dimensions covering the overall studying and learning experience. Since the 1970s, research focused on overall DS demonstrates its connection with student attitudes toward academic studies, its two-way relationship with the academic achievements, as well as its importance regarding the organizational effectiveness of the institutions. Thus, the study of DS is both a crucial and an important work in the sense that it interlocks with the development of a culture of continuous improvement of the quality of education, [39, 4, 29].
On the other hand, JS is, in general, a fundamental aspect of the quality of a person's working life [83] and eventually, an indicator of the individual's prosperity, [20] “…no research on subjective well-being can be complete without considering subjective well-being at work”, [45]. Its utility, besides employees, concerns also employers, given that it is closely related to employees’ labour market behavior such as productivity, absenteeism, quits and turnover [see, 27, 1, 19, 31, among other]. Focusing on employees with higher education, the analysis of JS evaluates additionally the role of their studies. This parameter is perhaps the most closely connected to the benefits of people from their education, [12]); higher education is considered to be associated with a higher degree of JS in the sense that it usually leads to positions with higher income and prestige –elements associated positively with satisfaction [33]. However, this relationship is not always confirmed and for some years now, there is greater interest for this matter, given the changing conditions concerning graduates’ employment prospects.
Quantitative research devoted to graduates' JS is extensive, somewhat less in the case of DS but corresponding interest seems irreducible at least as long as such results provide feedback to the ongoing process of efficiency evaluation of higher education institutions. Several large-scale surveys focus on graduates' issues, including DS and JS. In the European context, two are particularly highlighted, as their results are used where possible as a basis for comparison with those presented in this study: The “Careers after Higher Education Survey” (CHEERS), [79] where graduates from eleven European countries were surveyed in 1999, four years after graduation, and the “Research into Employment and professional FLEXibility” (REFLEX) project [5], where graduates from fifteen European countries and Japan were surveyed in 2005, almost five years after graduation; note that the later survey almost coincides with our own. Yet, more such surveys have been conducted at country or institutional level or focused on specific professional groups. However, none of the large-scale surveys involved Greece, while even country-level results are very limited or fragmentary regarding social science graduates. This work is intended to cover a part of this gap.
Greece, which has been undergoing a post-modernization on all levels -political, economic, cultural, social, and educational [32], has also experienced a great expansion of higher education, especially during the last four decades; traditionally, education in Greece has been inextricably linked to enhancing social status and occupational security and eventually, it is seen as a means of social mobility. An insight into this is portrayed by the share of students in tertiary education as % of 20-24 years old in the population that was 36% by 2013 and estimated to 39.2 for 2015, which is among the highest in Europe [24]. However, the gap between the supply and demand of the domestic economy for a highly educated manpower observed for several years [56], and the constantly changing labour market conditions in skills and occupations pose problems regarding graduates' prospects. In this reality, graduates of social sciences are probably the most vulnerable, as they constitute the majority of graduates, are mostly women, acquire competencies and skills that are not considered particularly marketable and are mainly absorbed in the public sector, which is experiencing drastic cuts.
In view of all the above, what is of interest in this paper is a) to report on how Greek graduates of social sciences self-identify their overall DS and JS b) to map the factors considered as predictive to satisfaction according to the existing knowledge and practice by means of logistic regression models and c) to capture similarities and differences observed in relation to other relevant researches. The results are expected to add to the relative literature on degree and job satisfaction of graduates and especially of graduates of social sciences where quantitative results are rather limited. Yet, since they reflect the era before the financial crisis in Greece they provide a reliable basis for future comparisons in the country and elsewhere.
This paper proceeds as follows: Section 2 provides a brief overview of the JS and DS definition and measurement issues in order to make clear what exactly is being studied below. The main predictor factors of DS and JS that have emerged in the literature are also reviewed, providing the background to the conceptual framework of the study. Section 3 is devoted to the methodology followed including data source, the conceptual framework of the study, and the statistical models used for the analysis. In Section 4 the results of the statistical analysis are described and compared with findings from other similar studies. The work concludes (Section 5) by highlighting the processual way in which DS and JS of our graduates is obtained.

2. Issues impacting the study of Job and Degree Satisfaction

Literature reveals a convergence of views on the complex and vague nature of the concept of satisfaction [8, 36, 107] but also a discrepancy in its definition and measurement while its multidimensional nature is particularly highlighted. This applies regardless of its implementation, including apparently DS and JS of alumni [38, 66].
Definitional issues: In the case of an employee' JS, the most studied issue of organizational psychology [47], the term was first introduced by Hoppock [41] at the beginning of the last century, the corresponding definitions are numerous; see [58, 104, 46] for a thorough research discussion. However, the probably more cited definition is that of Locke [58], stating that Job satisfaction may be defined (for the present) as a pleasurable or positive emotional state resulting from the appraisal of one’s job or job experiences. According to Clark [20], this is a classic reference for the meaning of job satisfaction that traces interest in workers’ subjective well-being back to the ideas of scientific management and fatigue reduction at the beginning of the 20th century. Yet, the phrase for the present, included in parentheses in the above definition, clearly indicates that the adventure of defining the issue has not reached an end. In the years to come, these definitions were further influenced by the research findings. Focusing on alumni JS, there does not seem to be any more specific definition, and the research is mainly geared towards identifying the factors that interpret the variability of the subject in this group of people. Practically the same holds for DS. However, some more specific references are given by Astin [7] who defines student satisfaction as the student’s perception pertaining to the college experience and perceived value of the education received while attending an educational institution, see also [13], while Elliot and Healy [23] perceive it as a short-term attitude resulting from an evaluation of a student’s educational experience; satisfaction results when actual performance meets or exceeds the student’s expectations.
Measuring issues: In practice and regardless of implementation, there is no single, generally accepted scale of satisfaction measurement. The questions raised relate to what we want to measure and what really counts when we measure (for an instructive discussion on the topic see [43, 45, 46] and included references). A variety of instruments has been developed for research purposes but being difficult to decide which is the most appropriate to adopt. Quite often researchers develop their own scale for responding objectives and peculiarities of the population understudy. As a consequence research results are often incomparable. Below is given a brief reference to the measurement of JS, but the same applies to the DS.
Traditionally, the measurement of JS has two directions reflecting correspondingly Job Facet or Specific Satisfaction and Overall JS. In the first case satisfaction has to do with particular and principally different aspects of the job (e.g. pay, promotions, work activities, working conditions) and measurement is performed by Multiple-item Scales which include questions (items) directed correspondingly to any one of the aspects. Respondents are asked to declare their level of satisfaction with a corresponding aspect on a usually 5, 7, 2 or 3 -point scale, from satisfaction to dissatisfaction or vice versa. The 20-item Minnesota Satisfaction Questionnaire (MSQ) [103], the six-item Quality of Employment Survey (QES) [71], and the five-item Job Descriptive Index (JDI) [81-82] are few of the most well-known and reliable facet scales for job satisfaction.
On the other hand, overall JS, also mentioned as Global Satisfaction, underline the view that JS is a unitary concept referring to employees’ overall feelings about their job without reference to any specific facets of it. Measurement is performed by the so called General or Global Scales which include both single-item and composite measures: Single-item measurements are carried out using a single-question such as “Overall, how satisfied are you with your job?” [75] or some similar [68, 90, 44] where, respondents have to answer on a 5, 7, 2 or 3 -point scale, as before. In this case it is assumed that some sort of processing takes place and the question requests for its end product, [44]. Composite (or global) scales include several questions and the final score of overall JS is formed by manipulating (usually by summing up) scores of the specific questions. These questions can either ask in different ways about overall JS, [50, 45] or about satisfactions from different aspects of the job, as for example in the Job in General Scale (JIG) [44], and in the Global Job Satisfaction (GJS) [70, 73].
There is much debate regarding validity, reliability and utility of the above methods, [see, 75, 44, 40, 90, 8, 68, 65, 74, 93, among others]. In any case, there are advantages and disadvantages; all methods have their uses depending mostly on the research peculiarities and what should be evaluated [102]. However, it must be highlighted that for rather practical reasons in fairly large surveys, the measurement of overall satisfaction on the basis of one-item has been preferred.
Key factors related to DS and JS of graduates: Research highlights many factors or variables that affect or relate to the self-assessment of graduates with regard to either JS or DS, thus demonstrating the multidimensional nature of the issues. To a large extent these factors depend on the particular problem under consideration, the focus group and the local and environmental/institutional conditions [38, 88], not overlooking that in some cases they derive from theories aiming at interpreting the phenomenon being studied [6, 11, 94, 9, 50]. Several classifications of these variables have been proposed, particularly in the case of JS, depending mostly on the peculiarities and objectives of the research; see for example [64, 62, 34, 50, 51, 97, 2]. However, it can be easily seen that in both cases of satisfaction three broad categories of variables are considered representing correspondingly Demographic or individual-specific characteristics, Educational and Job characteristics. However, the number and type of variables in each category may differ when looking at JS or DS, while the distinction between categories is not always clear.
Thus, from the category of demographics, individuals' gender, age, marital status and level of parental education are almost always considered in both cases of satisfaction; see for example [53, 25, 29, 60]. The same usually holds regarding the financial situation of the graduates themselves and of their parents, their ethnicity/race (if valid) and their class level or cohort of entrance, see also, [23, 14, 26].
The variables that are classified into the group of educational characteristics and are commonly used as explanatory in the analysis of both DS and JS of the graduates concern field of studies and other aspects of educational experience, such as perceptions regarding study provision and study conditions, e.g. design of curriculum, teaching quality, course difficulty, advice offered and others [53, 11, 7, 63, 29]. Yet, variables reflecting individuals’ participation in university academic and social life (course attendance, duration of studies or mode of study, social unions, work etc.) and academic achievements, are also considered as educational characteristics related to DS principally but to JS, as well, see also [59, 2, 21]. Furthermore, a few variables which theoretically refer to the period just before enrolling in the university, such as the way of admission and the order of preference of a specific department in the list of graduates’ choices are considered as educational attributes that may be related to DS and to some extent to JS. Some other variables that are considered as explanatory for DS and JS graduates and are classified into educational features, but are often also a separate class, have to do with individuals' life goals or their attitudes, motives, and beliefs about higher education; Note that values for these variables can be configured before and after entering the university [64, 29]. Finally, overall feelings concerning for example social life during college and course enjoyment are some more educational features that could influence both DS and JS while overall DS is only considered as influential to JS [53, 7].
The third category, named Job or labour-market status variables, includes a variety of features, related to both employees and work, considered as predictors to JS of graduates. Among the work characteristics, the most commonly used are earnings, type and size of institution or firm, employment sector, working hours, type of employment and the like. Of those belonging rather to employee’ features are mainly, self-reported acquired competencies and job-relatedness to education taken, see, [77, 87, 64, 100], among many others. However, it is important to mention that when examining DS of individuals some years after graduation, some more variables are also considered, as belonging to this third group. These usually correspond to overall JS itself, satisfaction with earnings, employment sector, job-relatedness to education taken, and job security [53, 105].

3. Methodology

3.1. Background and Conceptual Approach

The Panteion University of Social and Political Sciences, based in Athens, is the fifth most senior Higher Education Institution and the first political science school of Greece. It was founded by private funds in 1927 as a Free School of Political-Economic Sciences, began to function officially in 1930, was renamed to Panteion School of Political Sciences in 1931, was upgraded in 1937 to a higher school and became a public law institution. In 1963, the traditional form of a university organization was introduced, with attendance of four years and the faculty departments of Political Science and Public Administration. The year 1983 is considered a benchmark in the evolution of the institution with the establishment of the Sociology department; the school now includes three departments. In 1989 it was renamed to Panteion University of Social and Political Sciences. Gradually, more departments came into operation covering the range of social and political sciences. Today, it consists of nine academic departments –the departments of: Public Administration, Sociology, Political Science and History, International and European Studies, Economic and Regional Development, Communication, Media and Culture, Psychology, Social Policy and Social Anthropology-. All departments are offering four-year bachelor degrees, as well as postgraduate studies in an apparently wide range of social science disciplines, wholly classified (ISCED 1997) under the broad education field of Social Sciences, Business and Law and, in particular, under the subfields of ‘Social and Behavioral Science’, ‘Journalism and Information’ and ‘Business & Administration’. Concerning students’ admissions, Panteion is the 9th largest university out of the twenty-two Greek University Institutions and the 4th largest in the capital area of Athens. However, the key feature, that makes the Panteion of great importance for research on issues related to studies and graduates of social science in Greece, is that among Greek universities it is the only one with an exclusive focus on social sciences.
The present study on DS and JS of Greek social sciences alumni is developed in the general context of what was mentioned in Section 2, but it is mostly guided by various models and procedures adopted by researchers in similar cases. In particular, key elements have been used of the conceptual logic of Kressel' work [53], probably the only devoted to both JD and DS of social science graduates, of the Garcia-Aracil’ model [29] regarding European graduates’ level of satisfaction with higher education and of the work of Mora et al. [64], Vila et al. [100], Schomburg [77], and Støren and Arnesen [87] concerning JS of European graduates. Yet, the methodologies of Cabrera’ et al [16] have been taken into account.
Accordingly, it is considered that: a) Overall DS, as well as overall JS, of our social science graduates, are unitary concepts measuring as a whole satisfactions and dissatisfactions with their studies and job respectively. b) The variability observed in both cases of satisfaction among graduates is related to three broad groups of variables representing demographic & other individual-specific characteristics, educational and job characteristics. As regards the individual variables, which are described in details in subsequent sections, it is further assumed that those included in the first group are the same when examining DS or JS while they differ as regards the other two groups. The last is because different variables from the same group explain the variability in the two cases of satisfaction. Figure 1 depicts the hypothesized conceptual framework.
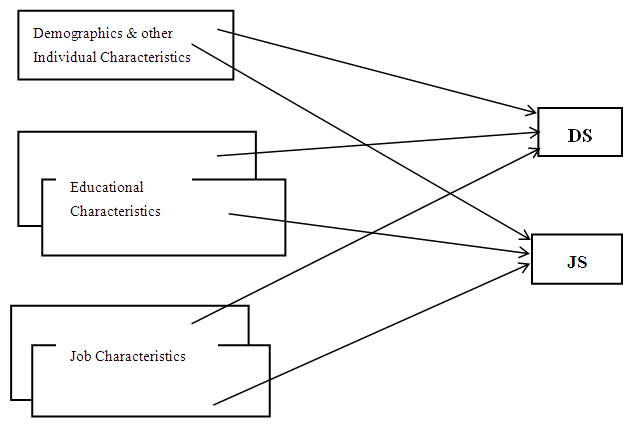
Figure 1. Conceptual framework for studying Degree and Job Satisfaction of Greek social science graduates (Source: Author)

3.2. The Data and the Variables

The data used in this study is mainly based on information derived from a survey -the customary method to-date for studying individuals' attitudes- that was aimed at studying issues related to the studies and prospects of Panteion University graduates, it was organized and conducted by the author and it was partly funded by university resources. This survey, which is the first of its kind at the country level, took place during the period 2006-2007 and was originally intended for all graduates from 1988 to 2002. The year 1988 coincides with the earliest cohorts of graduates we could have since the introduction of sociology, while 2002 relates to the latest cohort considering enough time (almost five years after graduation) for graduates to start work and males to complete military service -a compulsory duty for Greek males. The total number of graduates in these 14 years is 12,570. However, it was advisable, for comparison purposes, to look at earlier and more recent graduates. Given the lack of previous relevant results, the idea was to assess possible changes in the respondents’ views over time; different cohorts enter the university, graduate and join the labour market in different time. Thus, as "earlier graduates" were considered all those before 1998 and as "more recent" all those who graduated during 1998-2002.
Within the scope and limitations of the empirical research regarding time, money and human resources, it was decided from the earlier population to consider graduates every three years, specifically of the years 1988, 1991, 1994 and 1997 amounting to 3,006 and representing 41.4% of the graduates of the 1988-1997 period. For the more recent population, it was decided to examine it as a whole, that is to say, 5,306 graduates, seeing that the relevant surveys for DS and JS emphasized the younger graduates. Finally, the sampling population consisted of 8,312 graduates. From them, 6,427 (77.3% of the total) were found and surveyed. From them, 6,412 graduates answered the basic question of DS and 5,726 the corresponding JS question (as not all graduates had a job). Information was gathered by telephone interviews using a questionnaire including closed and open-ended questions. Yet, the survey data were matched with university official records.
The two outcome (dependent) variables in this study are graduates’ self-assessed overall Degree Satisfaction (DS) and overall Satisfaction with current Job (JS). Consistent with prior studies these variables were measured on the basis of two corresponding questions worded as: “Altogether, to what extent are you satisfied with your studies –or correspondingly with your current job” where the graduates' answers were given on a Likert scale of five ordered categories ranging from 1 (very dissatisfied) to 5 (very satisfied). However, in the analysis, both outcome variables are treated as categorical consisted of two levels created by collapsing the 5- point scale to 2 categories: ‘‘very satisfied or satisfied’’ versus ‘‘neutral, dissatisfied or very dissatisfied’’ [3, 15, 42, 16, 106]. Clearly, the two levels are stating graduates' satisfaction and dissatisfaction and are coded correspondingly as 1 (ranking 4 and 5 on the 1-5 scale) and 0 (ranking otherwise).
According to the above conceptual framework and following well-known practice and reasoning, information was gathered for a number of predictor or independent variables considered as influencing graduates’ DS and JS. For the sake of brevity, the full description of all predictor variables and of their values is given in Tables 1 and 3 together with descriptive results relating respectively to DS and JS. In the tables it is clear which of the educational features and which of the job characteristics are used as predictor variables of DS and JS. Note also that for the purpose of the analysis the group of educational characteristics is divided into two subgroups entitled correspondingly individuals’ desires, incentives and beliefs regarding their studies and other educational characteristics [64]. Yet, to facilitate understanding, the variables belonging to the other educational characteristics are further classified into five categories representing elements about enrolment to the university, participation in the studies, individuals’ viewpoints regarding curriculum, academic characteristics-course difficulty and postgraduate studies. Likewise, job characteristics are grouped as elements regarding looking for a job, reasons for JS, income, relationship between education and work and other job characteristics, including sector and type of employment and career prospects.

3.3. Statistical Analysis

The examination of graduates DS and JS in relation to the factors/variables involved was performed by means of both descriptive and multivariate analysis, using graduates as the units of the analysis. Descriptive analyses aim at a first picture of the relationships between satisfaction and variables through the percentages of satisfied graduates with different backgrounds, as well as the chi-squared statistics of association between satisfaction and variables. However, such descriptive statistics can be misleading, as they fail to control simultaneously for all existing associations with the dependent variable, [69]. In our case, this weakness is treated by conducting multidimensional analysis consisting of four different specifications of the logistic regression model for assessing the relationship between groups of variables with the probability of a graduate to be satisfied either with studies or job. In these models, the dependent variable is considered as a dichotomous measure of satisfaction as described in the previous section. Concerning the interpretation of the resulting probabilities given below, the principle is that “they should be interpreted as being predictive rather than casual … causal connections for most of the variables examined are not tenable when the alumni survey collects predictive (e.g., job satisfaction) and criteria (e.g. income) measures in a simultaneous manner” [16, 108].
For both cases of satisfaction, the four specifications of the logistic regression model hereinafter referred to as DS or JS Model I, II, III and IV, aim correspondingly to clarify the effects of four groups of explanatory variables, which are entered into regression in a sequential order, on the probability of a graduate to be satisfied either with his/her degree or job. Specifically, Model I provides information about the effects of demographic characteristics. Model II incorporates individuals’ desires, incentives and beliefs regarding their studies, Model III the rest of the educational characteristics and Model IV job characteristics. In particular the general form of the logistic models can be written as follows
(1)
where the dependence of graduates’ JD or JS on four groups of variables is estimated. Specifically, the left side of (1) represents the log-odds of a graduate to be satisfied, the indicators i, j, l, and m sum-up respectively the variables of the four groups and are ML parameter estimates.

4. Results

Description of Respondents: Almost 68% of the respondents are women, 32% men while all of them are Greek nationals. Eighty-one percent were born in the capital where Panteion University is also located, 14% in other regions of the country and about 5% abroad, while 30% of respondents have at least one of their parents with tertiary education. Nearly 37% are aged 26-30 years, 56% of 31-40 years and the others are older than 41. Fifty-four percent are unmarried, 43% married and the rest are divorced. Thirty-three percent of the sample members hold postgraduate degree (master's or doctorate), 25% would like to proceed with postgraduate studies while others have no such interest. Finally, 93% are employed and 7% are unemployed.

4.1. Estimation results for Degree Satisfaction

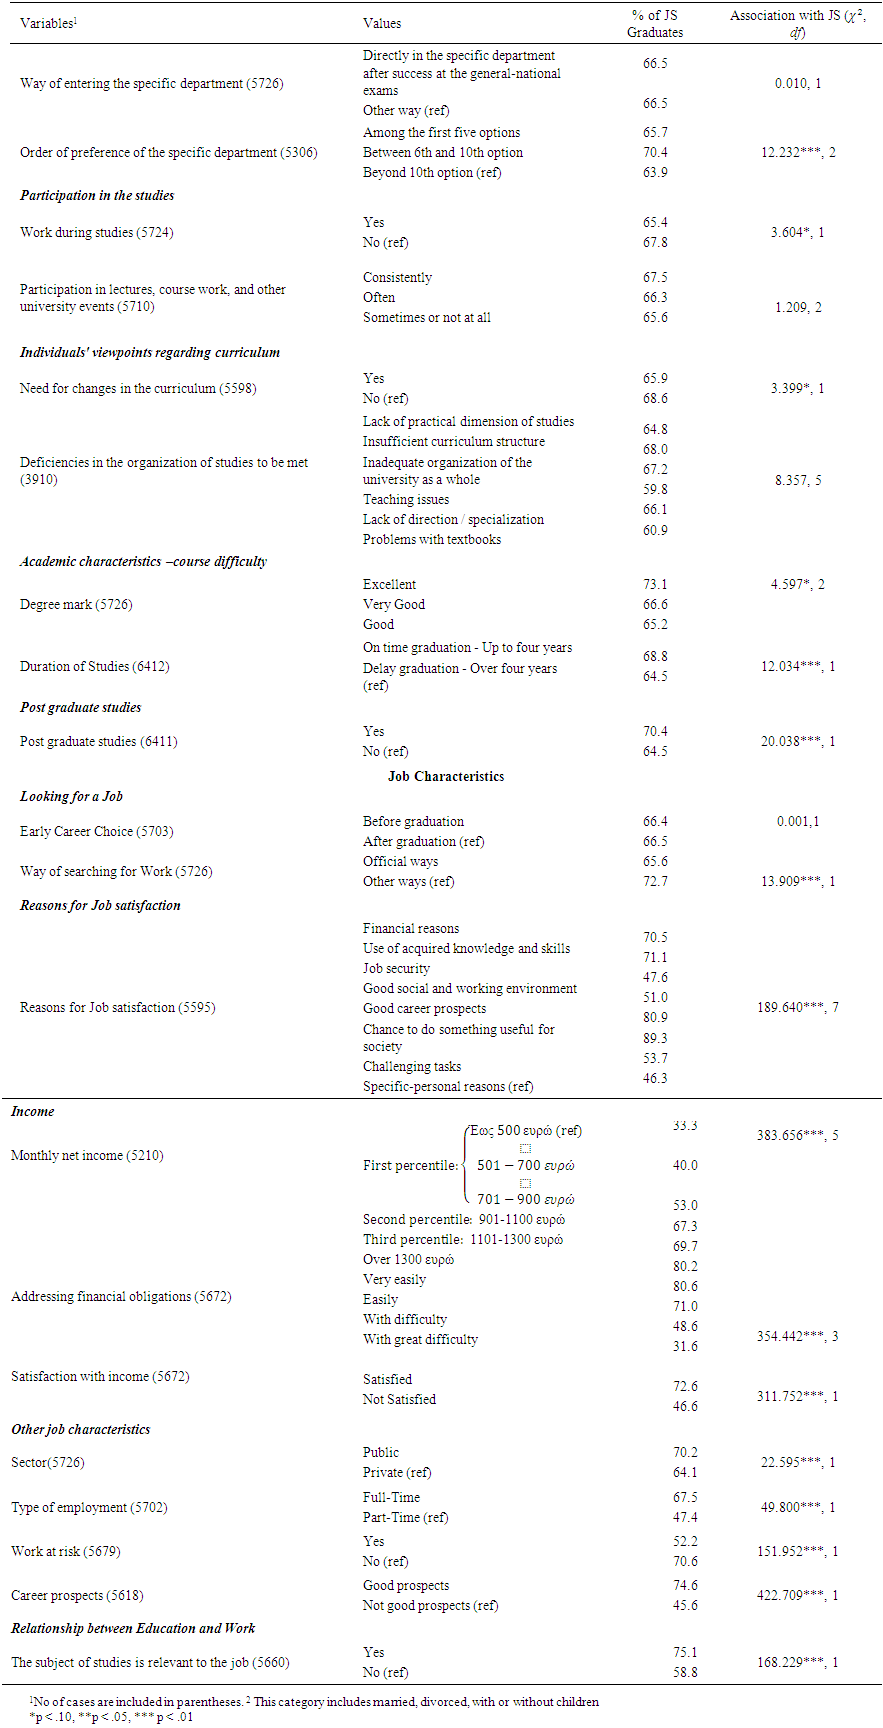
Descriptive results: Table 1, displays information about all predictor variables and summarizes the relationships between variables and DS. Specifically, it accommodates short descriptions of the variables (definition and values) while for categorical variables which are then included as explanatory in the logistic regression analysis, the reference category is correspondingly indicated as (ref). The table also reports the percentages of satisfied graduates (reporting DS of 4 and 5 on the 1-5 scale) with a different background as well as chi-squared statistics of association between DS and corresponding variable.
Overall, it seems that most of our graduates, making retrospective judgements about their studies feel happy with them; 57.3% of the total, reported DS. Similar results indicating positive feelings towards the experience of higher education are also reported for graduates of other European countries however with different individual rates: Thus, overall the graduates (regardless of their field of study) from eleven European countries [57], surveyed in the context of REFLEX reported, in a higher percentage (63%), satisfaction with their study program and the chosen institution while the highest figure is for French (71%) and Swiss (69%) graduates, and the smallest for Spanish (49%), without a reasonable explanation for these differences. Similar results are for the graduates of twelve Western European countries and of six Eastern European including Turkey, examined correspondingly in the context of REFLEX and HEGESCO (Higher Education as a Generator of Strategic Competences), a similar to REFLEX project for Eastern European countries [105]. Overall, for the eighteen countries, 60% of the respondents reported satisfaction with higher education, with the highest figures in Austria and Belgium (approx. 70%) and the lowest in Turkey and Lithuania (39% and 50%, respectively). However, in a small sample of American social sciences graduates [53], satisfaction was reported from a rather low percentage (39%), but there, the corresponding measurement was different. From all these figures and whereas under CHEERS it was found [29], that social science graduates are more satisfied than graduates in natural, medical and law sciences and less satisfied than graduates in mathematics and humanities, it may be concluded that our graduates are to a great extent happy with their studies as is the case in the majority of the European countries.
The chi-squared test analyses show significant association between DS and almost all variables of the four groups but at a different level of significance. Some exceptions to this general trend have to do with the financial parental level (from the individual characteristics), work during studies, postgraduate studies and the specific field of study (from the group of educational characteristics). Regarding individual characteristics, the feeling of DS is higher for women than for men, for married than for unmarried, for those whose mother and/or father had not higher education than those whose parents had such level of education and for earlier than for more recent graduates. Concerning age, the older the graduates the more satisfied they were.
Table 1 provides evidence to suggest that graduates’ level of DS changes taking into account their desires, incentives and beliefs regarding their studies. Thus, those who had a strong desire for higher education studies as well as those who believe that their expertise is useful in Greek society, and in the Greek labour market, are far more satisfied than the graduates who reported otherwise.
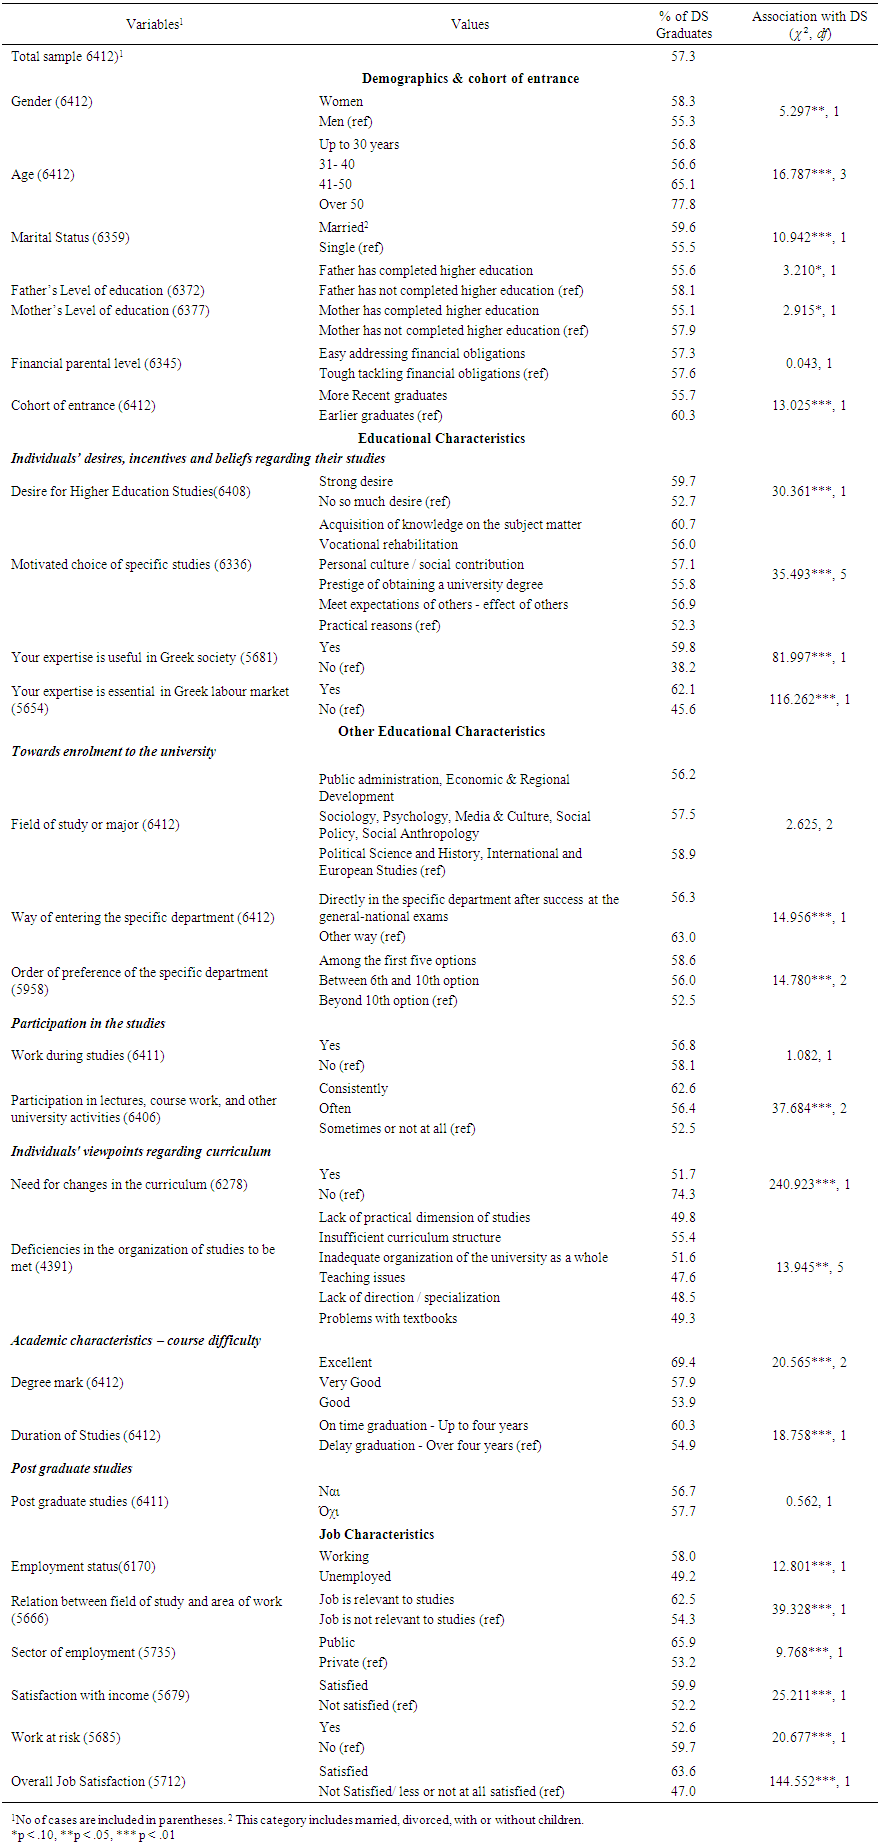
Table 1. Variable definitions and values. Descriptive statistics on DS of graduates with different background
In addition, and taking into account the incentives for or expectations from studies, the more satisfied graduates are those who score acquisition of knowledge of the subject matter, followed in turn by those who mark personal culture or social contribution, meet expectations of others, vocational rehabilitation, prestige of obtaining a university degree and lastly, practical reasons.
The first main conclusion that emerges for the relationship between graduates’ DS and the rest of educational characteristics is that the more targeted and committed the graduates are to their studies, the more satisfied they are. Also, the more graduates trust the curriculum, the happier they are. In particular, it appears that graduates for whom the specific studies were among their first five choices, as well as those who enrolled in the specific department utilizing ways of enrollment other than through general exams (e.g. transfer from another university or department) are more satisfied with their studies than those who felt or acted otherwise. Graduates who consistently participated in lectures and other university activities, those who did not have to work for living during studies, those who managed to graduate on time and achieved good performance report higher DS than those who proceeded differently. Moreover, and very importantly, graduates, who trust the curriculum stating that it does not need changes, are much more pleased with their degree than those who say the opposite. It is useful to note that among those graduates who stated that the curriculum needs changes, the less pleased are those who have pointed out teaching issues as a deficit in the organization of studies and follow in ascending order, those who reported lack of direction/specialization, problems with textbooks, lack of practical dimension of studies, inadequate organization of the university as a whole and insufficient curriculum structure. Unlike the above, a non-significant difference arises in the level of DS of the graduates taking into account the specific field of studies and whether they have completed postgraduate work. However, the percentage of satisfied graduates is slightly higher among graduates who followed studies oriented to political science and history than that among those who followed a more sociological direction and those whose studies are directed to public administration and economics.
Finally, the cross-tabulation results provide strong evidence that graduates’ DS is associated with a number of job characteristics. In particular, DS is higher among graduates reporting that they have a job, their work is related to their studies, they work for the public sector, they are satisfied with their income, their work is not at risk and overall they are satisfied with their job.
Comparisons of the above results with those of other researchers are attempted below taking also into account the results of the logistic regression.
Logistic regression results: Table 2 reports the magnitude of the association between the predictors and DS in terms of logistic regression coefficient betas, their standard error and exp(betas) which facilitate comprehension. At first view, it is clear that the above emerging descriptive profile where DS seems to be associated with most of the predictors is not verified to all cases when controlling for all associations between DS and independent variables: According to the model I, where it is supposed that DS could be explained mostly by personal-demographic elements, only gender, and age, have a significant relationship with DS. Note however, that these results also appear when the other groups of variables are included in the analysis (models II, III and IV, Table 1). In particular, according to Model I, women report themselves as being noticeably more satisfied with their studies than do comparable men; the probability for a satisfied woman is 1.171 times higher than that of a man. This finding is in line with those concerning correspondingly social science graduates [53], international higher education full-time undergraduate students in Ireland reviewed during 2009-2010 [26], and Irish students reviewed in 2013 [89]. Yet, it could be said that it falls in with the results of other researchers who find that, female graduates regret their studies less than men which is in some way an indirect indication of graduates' satisfaction with their studies. Mention the work on UK graduates surveyed three years after graduation [17], and on Spanish and Dutch graduates surveyed in the frame of REFLEX, where that result was found for the Spanish graduates but not for Dutch (although the results were not significant) [54]. However, this result is contrary to what was found for European graduates examined in the frame of CHEERS [29], and for undergraduate and postgraduate Norwegian students surveyed in 2014 [37].
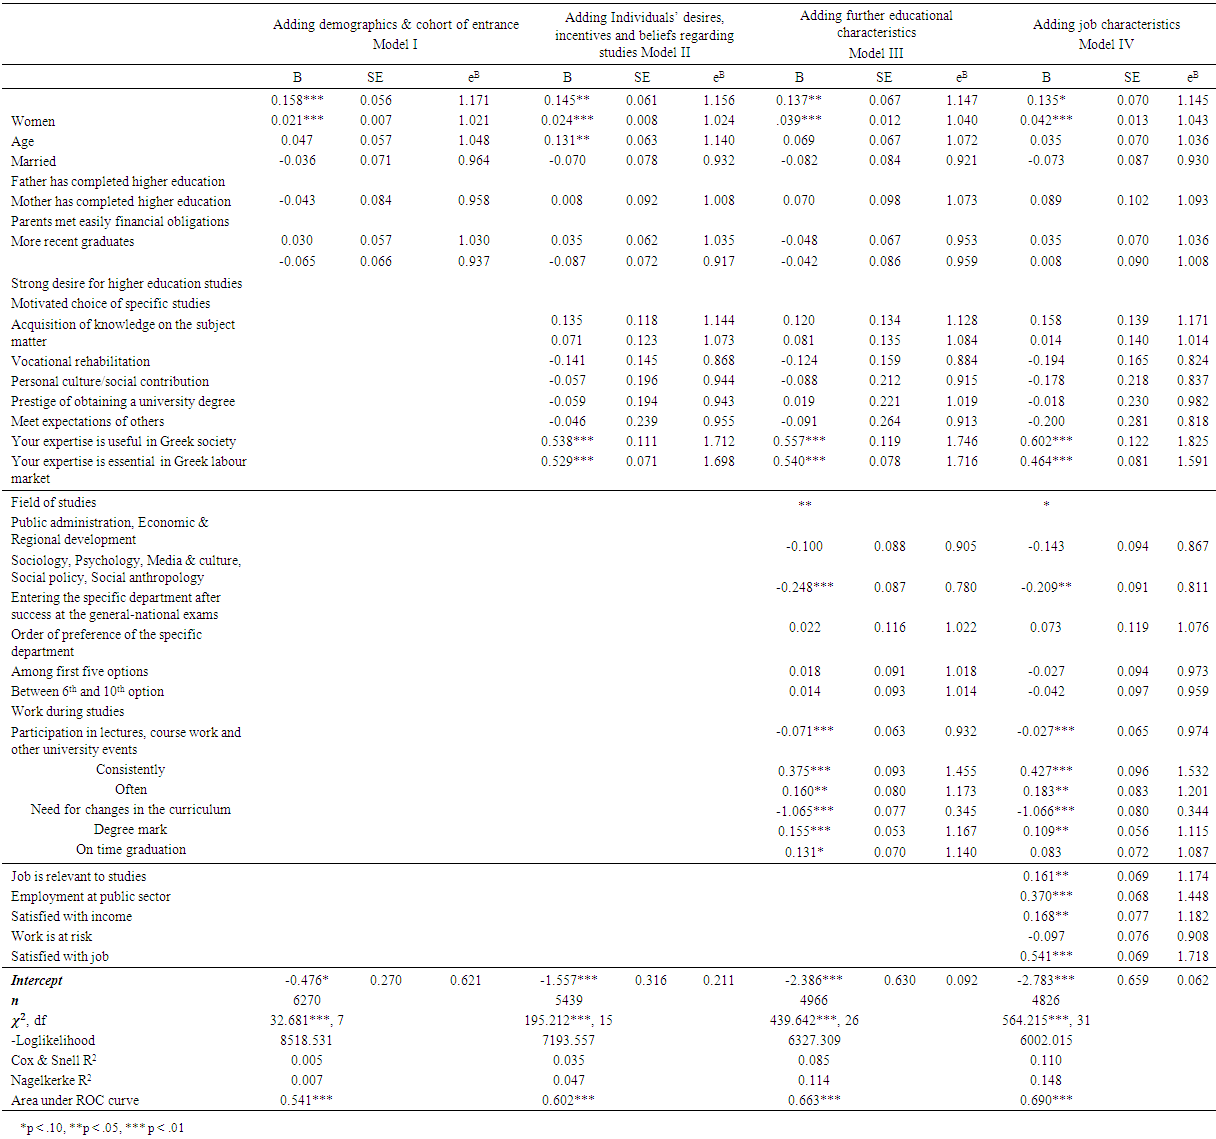
Table 2. Logistic regression results for degree satisfaction
Regarding age, like in the case of European graduates, surveyed in the frame of CHEERS [29] it is found that older graduates tend to report higher satisfaction; the probability of a graduate of a certain age to be satisfied is 1.021 times higher than of a graduate one year younger. This finding could be first attributed to the idea that moving away from past experiences creates nostalgia that mitigates any negative images that may have been formed.
As to the rest of the results of the model I, although not significant, it may be useful to note the trends they suggest: Consequently it turns out that married graduates, those belonging to earlier cohorts, those whose parents met financial obligations with ease, and those whose mothers or fathers had not completed higher education seem more satisfied than graduates who exhibit the opposite characteristics. The latter result, which is contrary to what emerges for European graduates surveyed in the frame of CHEERS [29], could be attributed to the fact that Panteion University, where the data originated, has traditionally absorbed a number of students mainly from low or medium socioeconomic strata and actually covered their need for higher education studies; a strong perception in Greek society [96].
Model II adds factors reflecting individuals’ desires, incentives and beliefs regarding their studies as an alternative explanation to demographics. Results show that individuals’ beliefs about their profession are significantly related to the satisfaction they express for their studies; those who loudly consider their profession as useful in the Greek society or essential in the Greek labour market are correspondingly 1.712 and 1.698 times more satisfied than counterparts with different considerations.
This result is of particular value and usefulness and should be taken into account by policy-makers in education and employment. Commenting on the rest of the results of Model II, although not statistically significant we note that graduates who score acquisition of knowledge on the subject matter as the main incentive for choosing their specific studies are more satisfied than those scoring practical reasons while those scoring vocational rehabilitation, personal culture/social contribution, prestige of obtaining a university degree, and meet expectations of others (effect of others) tend to be less satisfied than those scoring practical reasons. Generally speaking, these results could be considered similar to those for European graduates surveyed in the frame of CHEERS [29], where graduates who are motivated by their personal growth rather than financial gains are happier with their studies.
Model III adds further educational characteristics aiming at the estimation of their direct impact on DS and their indirect effects via demographics and individuals’ previous incentives and beliefs. Results, besides supporting the main significant outcomes from Model I and II, show that field of studies has overall a significant impact on DS. However, it comes out that graduates oriented to Sociology/Psychology /Media & Culture/Social Policy & Anthropology are significantly less satisfied (0.780 times) with their studies than the reference group which includes graduates from the departments of Politics/History/International-European studies while graduates of Public Administration, as well as of Regional & Economic Development department are less satisfied, but not significantly, than counterparts of the reference category. Yet, it is found that systematic participation in lectures and other university events, degree mark, on time graduation and positive attitudes towards the curriculum have a progressive and significant effect on the graduates' overall DS. More specifically, we found: Graduates who consistently or often participate in lectures and in other university events are correspondingly 1.455 and 1.173 times more satisfied than those who participate sometimes or not at all; On the scale [10-20], one more unit in the degree mark differentiates 1.167 times the satisfaction; Individuals graduating on time are 1.140 times more satisfied than those who have a late graduation; and graduates who feel that there is need for changes in the curriculum are 1.066 times less satisfied than those who feel otherwise. Finally, admission to the university through national exams, compared to other ways, has a positive but insignificant effect on DS, and so is the case with respect to the order of preference of the particular department - the higher the preference the greater the satisfaction, while also, work during studies has a negative though insignificant effect on graduates satisfaction with their studies. Overall, these results fall in line with the results for European graduates surveyed under CHEERS [29] as well as with those for American social sciences graduates [53], where graduates' study satisfaction seems to a large extent to be guided by elements of the academic environment and perceptions of the college experience.
The final model IV adds job characteristics as predictors to DS. The results support also the main conclusions obtained from the models I, II and III. In addition, it appears that the JS, the job-studies relevance, the employment sector and the satisfaction with income are significantly related to DS. Precisely, the model shows that graduates who report themselves as happy with their work, who work in the public sector, those who say are happy with their income and that job is related to their studies are respectively 1.718, 1.448, 1.182, and 1.174 times more satisfied with their studies than counterparts who feel or declare otherwise. On the other hand, graduates, who feel that their work is at risk appear to be less satisfied with their studies, although not significantly, than graduates with more stable work. This outcome is in the spirit of what has been also emerged for European graduates examined under CHEERS [29] and REFLEX [57] projects, and for American Social Science graduates [53], which ultimately show that, when satisfaction with studies is considered retrospectively, it is linked to key dimensions of employment, such as job-studies relevance and job satisfaction.

4.2. Estimation Results for Job Satisfaction

Descriptive results: Table 3 shows information similar to those given in Table 1 but tailored to the issue of graduates' JS. In the main, the picture which emerges several years after graduation is that most graduates seem satisfied with their job; almost two-thirds of them or 66.4% reported JS. By comparison, the specific figure is slightly lower than that obtained for a total of graduates (irrespective field of study) of eleven European countries (68%), who participated in REFLEX research [57]. In more detail, it is fairly smaller than what corresponds in Austria and in Norway (74%) but higher than that corresponding to Italy (58%) and Spain (63%) [87]. Note also, that for the same graduates, there was found no significant differences among satisfaction rates taking into account the field of study [28]. Comparing with the results for the graduates of the eighteen European countries surveyed under REFLEX and HEGESCO (mentioned also above) [105], it is clear that the percentage of our satisfied graduates is almost the same as that provided for the total of graduates of all those countries (66.1%). However, it is pretty lower than the corresponding to Austria (74.8%), Belgium, Czech Republic, Germany and Norway (approx. 70% -72.5%) but fairly higher than the one of Turkey (49.9%), Italy (56.1%) and Spain (62.1%). Yet, positive feeling towards work experience is also reported for the European graduates examined earlier in 1999 under the CHEERS [77, 63, 64]. From all this, it is easy to conclude that our social science graduates report to a great extent satisfaction with their work like their counterparts in the vast majority of European countries.
The results of chi-squared test analysis (Table 3) indicate a significant association between graduates’ JS and most of the variables from all four groups. The only exceptions have to do with the variables representing: father’s and mother’s level of education and graduates’ age, treated as an ordinal variable (from the individual characteristics); way of entering the specific department, participation in lectures or in other university activities, and deficiencies in the organization of studies (from the educational characteristics), and early career choice (from the job characteristics).
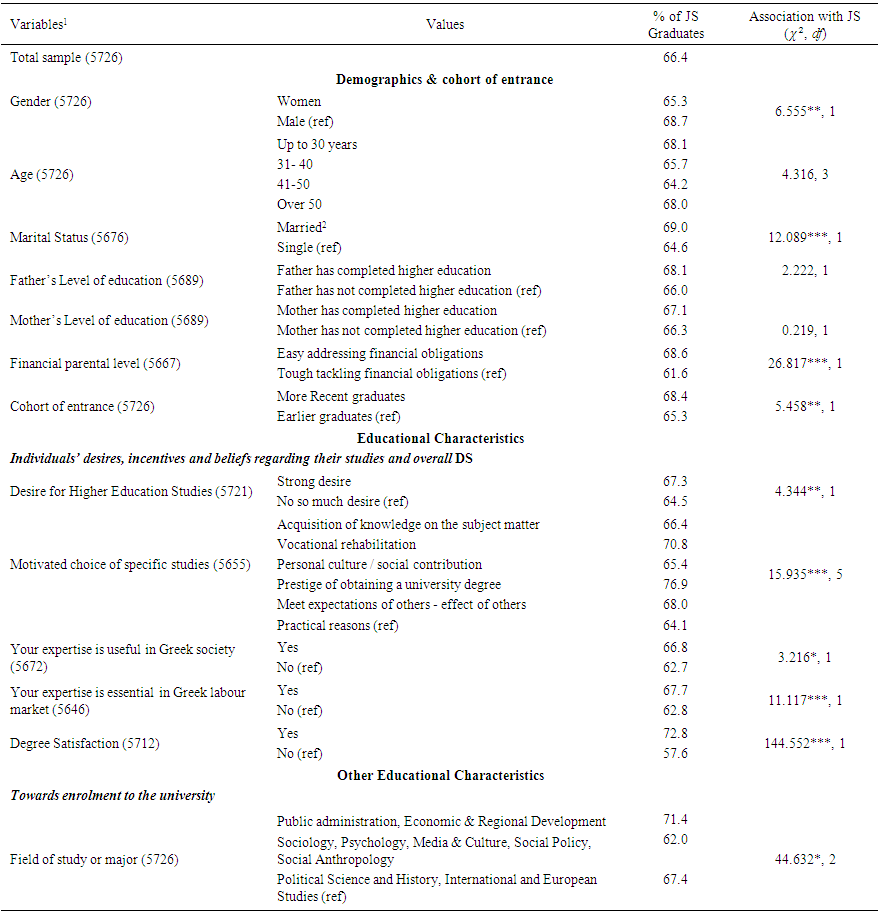
Table 3. Variable definitions and values. Descriptive statistics on JS of graduates with different background
Table 3. Continued
More precisely, the arising descriptive job satisfaction profile of the graduates has as follows: more satisfied are men graduates than women, younger and older than middle age graduates (U-shape skim), married than single, those whose parents easily address financial obligations than those whose parents do not have that possibility and earlier than more recent graduates. Yet, more satisfied seem to be the graduates who had a strong desire for higher education studies, those who state correspondingly that their profession is useful in the Greek society and in the Greek labour market and those reporting satisfaction with their studies, than the graduates who report differently regarding these issues. Also, taking account graduates goals regarding their studies, the most satisfied are those scoring prestige of obtaining a university degree followed by those scoring vocational rehabilitation, meet expectations of others (effect of others), acquisition of knowledge on the subject matter, personal culture/social contribution and last practical reasons (they had no specific goals or expectations). Considering the rest of the educational characteristics, the JS profile of the graduates is supplemented as follows: More satisfied with their jobs are the graduates of the group of the departments Public Administration, Economic and Regional Development followed by those of the group of Political Science and History, International and European Studies and in the third and final position is the group that includes the departments of Sociology, Psychology, Media and Culture, Social Policy and Social Anthropology. Additionally, more satisfied with their job are the graduates for whom the specific studies were between the 6th and 10th choice, followed by graduates who had their studies in the first 5 choices, while the less satisfied are those for whom their studies were at least the tenth choice. Yet, JS is higher among graduates who did not work during studies, stated that the curriculum do not need any changes, have achieved a higher degree mark, graduated on time and have followed postgraduate studies, than among graduates with opposite features.
Finally, taking into account job characteristics, the JS profile of the graduates is completed as follows: As to the main reasons for JS, the graduates report first and in large proportions the opportunity to do something useful for society and then they indicate, in turn, good career prospects, use of acquired knowledge and skills, financial reasons, challenging tasks, good social and working environment, job security and specific personal reasons. Yet, clearly, income plays an important role in the JS of graduates; the higher the income, the higher the rates of graduates reporting job satisfaction. The results are similar, taking into account the degree of ease with which graduates declare that they are addressing their financial obligations while also much higher is the proportion of graduates reporting JS among those referring overall satisfaction with their income than those who say they are not. Furthermore, more satisfied are the graduates who work in the public sector vs those working in the private sector, those who have a full-time job against those with part-time jobs, those whose work is not at risk, those who have good career prospects comparatively to those they don’t feel that way and those who did not use official ways when searching for a job vs those using official ways. Lastly, graduates who state that their job is relevant to their studies are far more satisfied compared to those who do not.
A discussion of the above results compared to those of other surveys is attempted below taking also into account the results of the logistic regression analysis.
Logistic regression results: Table 4 shows logistic regression results for graduates' JS, in a manner similar to that of Table 2. Findings under JS Model I, confirm the ones emerging from the descriptive analysis, regarding the significance of individual attributes in graduates’ JS. In addition, they provide information that the probability of JS is: 0.827 times lower in women than in men; 0.814 times lower among recent graduates than among their earlier counterparts; 1.297 times higher among those who are somehow involved in a family plan than among singles; and 1.391 times higher for graduates whose parents easily meet their financial obligations than for those whose parents do not have this feature. Finally, treating age as a quantitate discrete variable, it is found that, every additional year of age reduces the probability of satisfaction by 0.975. Overall these results are in line with the findings of other researchers concerning graduates or higher-educated people, mentioned in particular, those concerning European graduates examined under CHEERS and REFLEX [64, 30, 105]. As it is discussed at the right point below, these results remain also significant when taking into account educational characteristics (Model II and III) but this is not true, as regards gender and cohort, when the job characteristics are in addition considered as predictors.
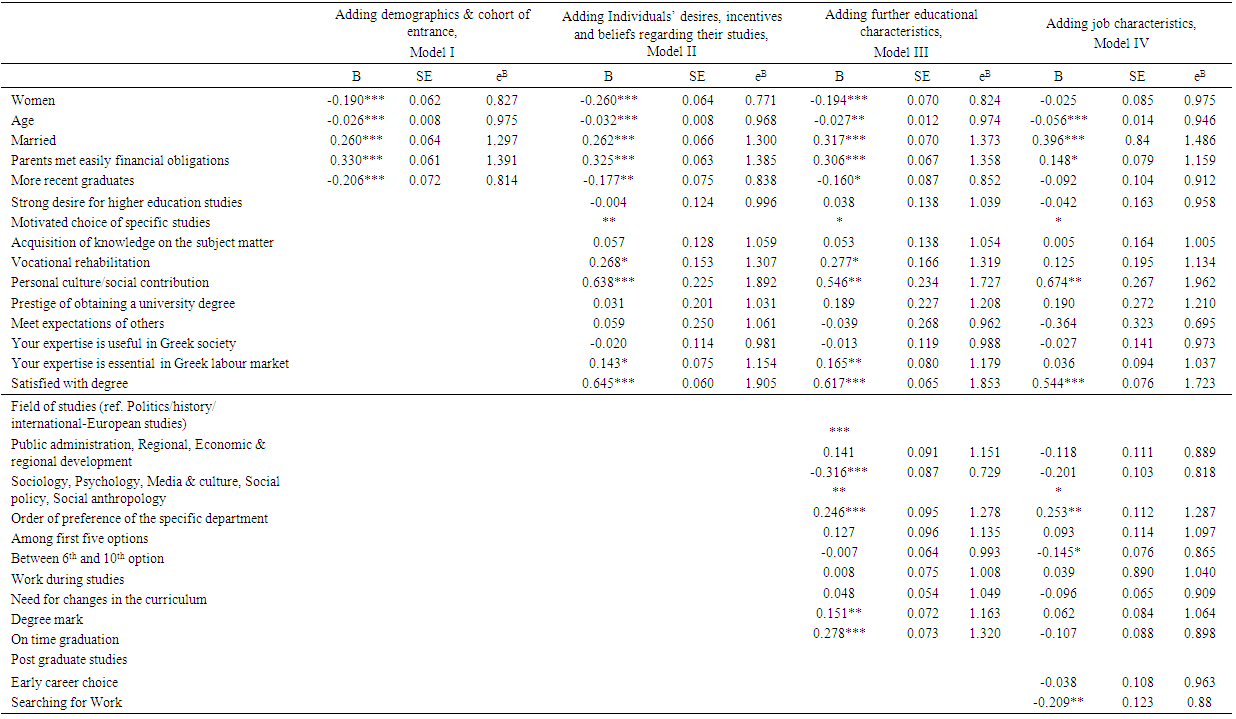
Table 4. Logistic regression results for job satisfaction
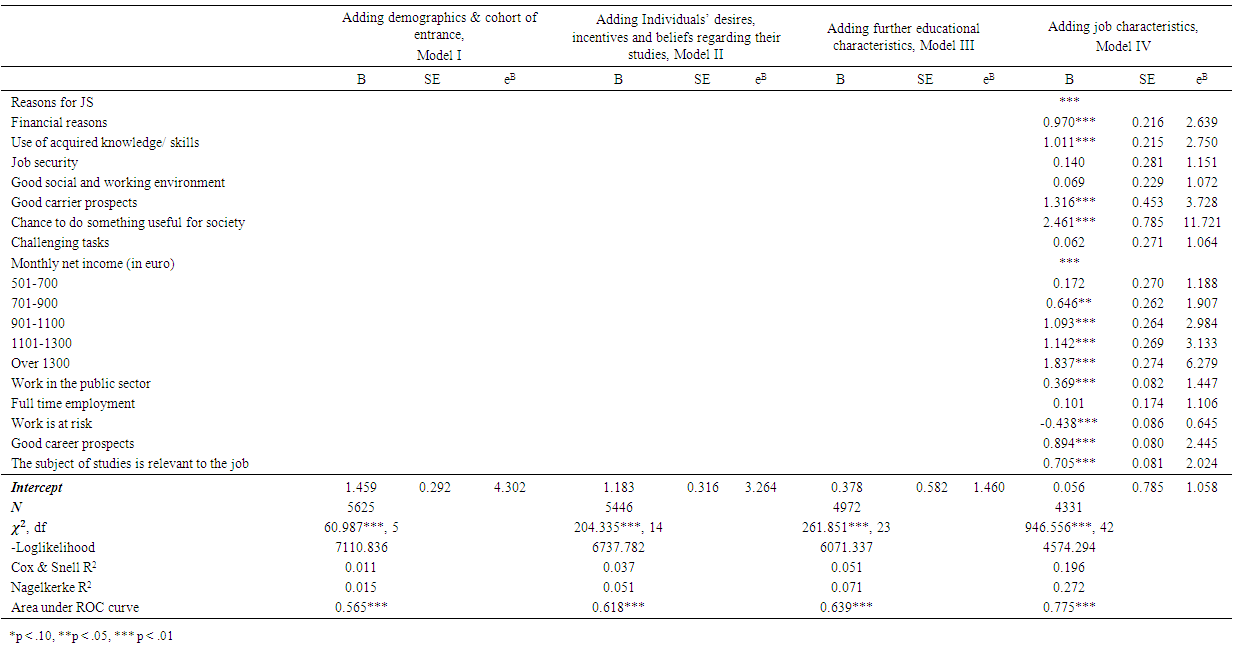
Table 4. Continued
JS model II, which adds graduates’ perceptions about their studies and their expertise as explanatory variables to JS, first endorses the results obtained from JS model I. Further discloses that three of the five variables representing graduates’ perceptions and emerged as important in the descriptive analysis have now a significant effect on JS. Especially, it turns out that the probability for JS of the graduates stating that their profession is essential in the Greek labour market and of those who say that they are satisfied with their studies are respectively 1.154 and 1.905 times higher than for the graduates reporting differently. It also appears that although motivating reasons for choosing the specific studies are overall important in shaping graduates’ attitudes towards JS, this is mainly due to the cases where personal culture/social offer and vocational rehabilitation are indicated as such causes; specifically, the probabilities for JS of the graduates who rely on these two reasons are respectively 1,307 and 1,892 times higher than that of the graduates who score practical reasons (reference category). As will be seen below, these results, which are in line with the reasoning of the results obtained for European graduates surveyed under CHEERS [64], are also obtained in model III, but there are some differences when tested in model IV.
JS model III supports the results obtained from models I and II and substantiates the significance of four out of seven educational characteristics which added in this model as regressors. The field of studies has overall significant effect to graduates JS, however, this is particularly due to graduates of Sociology, Psychology, Media and Culture, Social Policy and Social Anthropology whose probability for JS is 0.729 times less compared to graduates of the reference category (Politics/History/International-European studies). Also, graduates’ order of preference of their department of studies (in the list of choices) has an overall significant effect to JS but this is mainly exemplified for graduates who had their department among the first five preferences whose probability of JS is 1.278 times higher than that of graduates for whom the department of studies was the tenth or higher choice. Lastly, it is found that on-time graduation and postgraduate studies are significantly related to JS; the probability for JS of graduates who managed an on-time graduation and of those who realized postgraduate studies is correspondingly 1.163 and 1.320 times higher than those for graduates who do not demonstrate such features. The significant effect of these variables on JS, which also occurs in similar research cases and where such a comparison is possible (e.g., [53]) is greatly reduced when considering job characteristics.
JS Model IV enhances regressors with job characteristics including congruency between field of studies and job. In the first place, the results show some differences regarding the findings of the previous models I, II and III. Regarding individual characteristics, there is no longer a significant difference in the satisfaction reported by former and more recent graduates, which may indicate that as the time since graduation increases, differences in attitudes towards JS are lessening. Also, gender no more shows any significant effect on JS. Women appeared significantly less satisfied with their work than comparable men, when demographic and/or educational characteristics were considered as predictors of JS (models Model I, II and III). However, this is no longer the case when job characteristics are taken into account (Model IV). These findings are mainly in line with the results for European graduates examined in the frame of CHEERS [64], REFLEX & HEGESCO [105, 28], and they seem to be converging on the grounds that women's higher levels of job satisfaction may be transient as they improve their position in the labour market[18, 84]. However, given that the effect of gender on professional success is generally characterized as complex [78], our results are opposed to assessments and findings for employees with not necessarily higher education, where women appear generally more pleased with their work compared to male counterparts, because mainly of their lower expectations [18, 80, 85, 48, 52].
In respect to the impact of the graduates’ beliefs and expectations regarding their studies to JS, the trends, noted above, remain also under Model IV, however, only two of them have now a significant effect. The one corresponds to DS; the probability of the graduates stating DS to report also JS is 1.723 higher than that of the graduates who did not report DS. This result also appears for American social sciences graduates, [53] as well as for European graduates surveyed under REFLEX [105], verifying that eventually, a satisfied student makes a satisfied worker [sic]. The second characteristic has to do with the graduates’ motives for choosing the specific studies where significance is now only due to the perception of personal culture & social contribution; the probability of the graduates, who scored that perception as their foremost expectation from their studies, to report JS is 1.962 times higher than that of the graduates who scored practical reasons.
It could be said that a similar result appears for the European graduates examined in CHEERS survey [64], on the ground that, there it was concluded that individuals who score on non-pecuniary motives tend to be more satisfied than those who score on more practical benefits.
As to the rest of the educational characteristics, under model IV, the particular field of study, on-time graduation, and postgraduate studies do not anymore have a significant impact to JS while the order of the particular department in the list of graduates' choices still significantly affects and in the same manner the JS. However, a new outcome emerging from Model IV has to do with graduates’ employment status during studies. This feature is now becoming important in shaping views on satisfaction, as is the case with American social science graduates [53], where however it is referred as an early career choice. In particular, it is estimated that the probability for JS of a graduate who had a job during studies is 0.865 times the probability of a graduate who did not have a job.
Finally, model IV verifies the significant influence to JS of almost all of those job characteristics identified before as important according to the descriptive results. Indeed, it is clear that the probabilities for JS, for those graduates who have used official ways of finding employment, for those working in the public sector and for those who report good career prospects in their current work, are respectively 0.880, 1.447 and 2.445 times higher compared to those corresponding to graduates who have stated otherwise. Conversely, graduates who reported their work is at risk are 0.645 times less likely to report JS than those who do not face this risk. The probability for a graduate to be JS is obviously increased by income. Precisely corresponding probabilities for graduates declaring net monthly income 501-700 euro, 701-900, 901-1100, 1101-1300 and Over 1300 are respectively 1.188, 1.907, 2.984, 3.133 and 6.279 times higher than the probability of graduates with income less than 500 euro. As to the reasons that produce JS, it turns out that the JS probabilities for graduates reporting correspondingly the chance to do something useful for society, good career prospects, use of acquired knowledge and skills and financial reasons are respectively 11.721, 3.728, 2.750 and 2.639 times higher compared to the probability of those reporting specific-personal reasons. Finally, job-studies congruency has significant effect to JS. The JS probability of graduates stating that their job is relevant to their studies is 2.024 times higher than that of graduates stating the opposite. To the extent that comparisons are possible, all these results are generally in line with other findings regarding graduates. In particular, they are in the spirit of results and conclusions drawn on graduates from several European countries investigated in the frame of the projects CHEERS [64, 30], REFLEX and HEGESCO [105, 57]. Yet, and especially with regard to the impact of job-studies relevance to graduates' JS, the results are consistent with those for Spanish graduates [55] as well for immigrant graduates in Europe [61] examined also in REFLEX, for Mexican graduates [16] and American social science alumni [53].

5. Conclusions

In this paper, the questions of individuals' demographic, education, and job-related determinants of Degree and Job Satisfaction for Greek social science graduates are approached. Over the years a number of studies have been published on graduates’ JS or DS, but those focusing on social science graduates are very few. This research contributes to lessening this lack utilizing a targeted data set and logistic regression models to tackle the questions. The results are useful to decision-makers in both education and employment policy, at a national or institutional level. They also enrich the pool of results on the specific issues thereby serving comparisons at European and international level. The value of statistical methods to address such important issues becomes clear while a great field of applications, which might be taken into account in the professional orientation of new statisticians, is also highlighted.
In the main, results showed that: A high proportion of our graduates reports DS, and an even higher one JS, as is the case of graduates of several other European countries. Altogether, the results are in the spirit of most of the literature however, the positive impact of DS on JS is particularly underlined.
Given that graduates make retrospective assessments for their studies, it appears that DS is mainly shaped by the gender and age of individuals, their views on the usefulness of their profession in Greek society and the labour market, their perceptions regarding the curriculum they followed and, the difficulties they faced in obtaining their degree. Moreover, it turns out that employment in the public sector, good economic benefits, and overall job pleasure, are factors influencing positively graduates' retrospective assessment for their studies.
In a similar way, graduates' JS is mainly formed according to individuals' age and marital status, the degree of satisfaction with their studies, and, to the status of specific job-related features which correspond to financial gains, employment sector, career development, work stability, and work-studies relevance. In addition, it turned out that, the more the studies taken were in high preference by the individuals, and the more the workplace provided opportunities for doing something useful for society, the more the likelihood of the graduates to report JS.
However, the above results although indicative, have limitations to be taken into account when compared. In general, data based on a single institution may limit internal and external comparisons, although, for this study, it should be noted that the particular university from which the data originates can be considered representative of the Greek reality as regards soft social sciences. Another limitation of this study rests in use of perceptions for assessing job-studies relevance. The alternative of using objective and subjective indicators for this construct [86] was not possible in the frame of our survey; however, recent research highlights also the effectiveness of self-perceived assessments [53, 99, 16].
In conclusion, it may be useful to mention that, because as it is believed that the careers of social science graduates may take longer to blossom, [95, 53] than in the case of science graduates, the results of this study, that essentially reflect the situation before the economic crisis in the country, provide a powerful springboard for new studies on the subject at a time the circumstances come again.

ACKNOWLEDGEMENTS

At an early stage, this research was partly supported by Panteion University.

References

[1]  Akerlof, G. A., Rose, A. K. and Yellen, J. L. (1988), Job switching and job satisfaction in the US labour market, Brooking Papers on Economic Activity, 2, 495–582.
[2]  Aldemir, C. and Gulcan, Y. (2004), Student Satisfaction in Higher Education: a Turkish Case, Higher Educ. Manage. Policy, 16, 2, 109-122.
[3]  Aldrich, J. H. and Nelson, F. D. (1986), Linear probability, logit and probit models (3rd ed.), Beverly Hills, CA: Sage Publications.
[4]  Aldridge, S. and Rowley J. (1998), Measuring customer satisfaction in higher education, Quality Assurance in Education, 6 ,4, 197-204.
[5]  Allen, J. and Van der Velden, R. (eds.) (2011), The Flexible Professional in the Knowledge Society. (Higher Education Dynamics, 35 (Series) Dordrecht: Springer.
[6]  Astin, A. W. (1984), Student involvement: A developmental theory for higher education, Journal of College Student Personnel, 25, 4, 297-308.
[7]  Astin, A.W. (1993), What matters in college? Four critical years revisited, San Francisco, CA: Jossey-Bass.
[8]  Babin, B. J. and Griffin, M. (1998), The Nature of Satisfaction: An Updated Examination and Analysis, Journal of Business Research, 41,127-136.
[9]  Bailey, B. L., Bauman, C. and Lata, K. A. (1998). Student retention and satisfaction: The evolution of a predictive model. Retrieved at 15/4/2018 from ERIC database (ED424797) https://scholar.google.gr/scholar?cites=4560393183050926205&as_sdt=2005&sciodt=0,5&hl=el.
[10]  Ballarino, G. and Bratti, M. (2009), Field of Study and University Graduates, Early Employment Outcomes in Italy during 1995-2004, Labour, 23, 3, 421-457.
[11]  Bean, J. P., and Bradley, R. (1986), Untangling the Satisfaction-Performance Relationship for College Students. Journal of Higher Education, 57, 4, 393-412.
[12]  Belfield, C. R. and Harris, R. D. F. (2002), How well do theories of job matching explain variations in job satisfaction across education levels? Evidence for UK graduates, Applied Economics, 34, 535- 548.
[13]  Bolliger, D. U. and Martindale, T. (2004), Key factors for determining student satisfaction in online courses, International Journal on E-Learning, 3, 1, 61–67.
[14]  Borooah, V. K. (2009), Comparing levels of job satisfaction in the countries of Western and Eastern Europe, International Journal of Manpower, 30, 4, 304-25.
[15]  Cabrera, A. F. (1994), Logistic regression analysis in higher education: An applied perspective. In J. C. Smart (Ed.), Higher education: Handbook of theory and research, 10, 225–256, New York, NY: Agathon Press.
[16]  Cabrera, A. F., Vries, W. and Anderson, S. (2008), Job satisfaction among Mexican alumni: A case of incongruence between hunch-based policies and labor market demands, Higher Education, 56, 699–722.
[17]  Chevalier, A. (2002), Education, motivation and pay of UK graduates: Are they different for women?, European Journal of Education, 37,4, 347-369.
[18]  Clark, A. (1997), Job satisfaction and gender: why are women so happy at work?, Labour Economics, 4, 4, 341-372.
[19]  Clark, A. E., Georgellis, Y. and Sanfey, P. (1998), Job satisfaction, wage changes, and quits, Research in Labour Economics, 17, 95–121.
[20]  Clark, A. E. (1996), Job Satisfaction in Britain, British Journal of Industrial Relations, 34, 189-217.
[21]  Douglas, J., Douglas, A. and Barnes, B. (2006), Measuring student satisfaction at a UK university, Quality Assurance in Education, 14, 3, 251-267.
[22]  Drewes, T. (2002), Value added: humanities and social sciences degrees. Evidence supports long-term employment success, Ontario Confederation of University Faculty Associations Forum (OCUFA Forum), Spring issue, 10-12.
[23]  Elliott, K. and Healy, M. (2001), Key factors influencing student satisfaction related to recruitment and retention, Journal of Marketing for Higher Education, 10, 1-11.
[24]  Eurostat (2017), https://0x9.me/cso0D.
[25]  Farag, S. and Allen, J. (2007), Japanese and Dutch graduates’ work orientations and job satisfaction. In J. Allen, Y. Inenaga, R. van der Velden, and K. Yoshimoto (eds.) Competencies, Higher Education and Career in Japan and the Netherlands. Series Higher Education Dynamics, 21 (Dordrecht: Springer), 191–210.
[26]  Finn, M. and Darmody, M. (2017), What predicts international higher education students satisfaction with their study in Ireland?, Journal of Further and Higher Education, 41,4, 545-555.
[27]  Freeman, R. (1978), Job satisfaction as an economic variable, American Economic Review, 68, 135–41.
[28]  Gajderowicz, T., Grotkowska, G. and Wincenciak, L. (2014), Graduates’ job satisfaction across domains of study, International Journal of Manpower, 35, 4, 470-499.
[29]  García-Aracil, A. (2009), European Graduates' Level of Satisfaction with Higher Education. Higher Education, 57, 1, 1-21.
[30]  García-Aracil, A. and Van der Velden, R. (2008), Competencies for Young European Higher Education Graduates: Labor Market Mismatches and their Payoffs, Higher Education, 55, 2, 219-239.
[31]  Gazioglu, S. and Tanse, A. (2006), Job satisfaction in Britain: individual and job related factors, Applied Economics, 38, 1163–1171.
[32]  Giamouridis, A. and Bagley, C. (2006), Policy, Politics, and Social Inequality in the Educational System of Greece, Journal of Modern Greek Studies, 24, 1, 1-21.
[33]  Glenn, N. D. and Weaver, C. N. (1982), Further Evidence on Education and Job Satisfaction, Social Forces, 61, 46-55.
[34]  Gruenberg, B. (1980), The happy worker: An analysis of educational and occupational differences in determinants of job satisfaction, American Journal of Sociology, 86, 2, 247–271.
[35]  Gu, J. (2012), Harmonious expansion of China's higher education: a new growth pattern, Higher Education, 63, 4, 513-528.
[36]  Hagedorn, L. S. (2000), Conceptualizing Faculty Job Satisfaction: Components, Theories, and Outcomes. New Directions for Institutional Research, 5–20. doi:10.1002/ir.10501.
[37]  Hamberg, S., Damen, M-L. and Bakken, P. (2015), Personal feedback and advising in Norwegian higher education: Explaining student dissatisfaction. Paper presented in track 2/8 at the EAIR 37th Annual Forum in Krems, Austria 30 August till 2 September 2015. Retrieved 14/6/2015 at https://0x9.me/mkGA7.
[38]  Hartman, D. E. and Schmidt, S. L. (1995), Understanding Student/Alumni Satisfaction from a Consumer’s Perspective: The Effects of Institutional Performance and Program Outcomes, Research in Higher Education, 36, 2, 197-217.
[39]  Hearn, J. C. (1985), Determinants of college students overall evaluations of their academic programs, Research in Higher Education, 23, 4), 413-437.
[40]  Highhouse, S. and Becker, A. S. (1993), Facet measures and global job satisfaction, Journal of Business and Psychology, 8, 1, 117-127.
[41]  Hoppock R. (1935), Job satisfaction, New York: Harper and Brothers. Reprint. New York: Amo Press, 1977.
[42]  Hossmer, D. W. and Lemeshow, S. (2000), Applied logistic regression (2nd ed.). New York, Wiley.
[43]  Hulin, C. L. and Judge, T. A. (2003), Job attitudes. In Borman, Walter C. (Ed); Ilgen, Daniel R. (Ed); Klimoski, Richard J. (Ed). Handbook of psychology: Industrial and organizational psychology, 12, 255-276, Hoboken, NJ, US: John Wiley & Sons Inc.
[44]  Ironson, G. H., Brannick, M. T., Smith, P. C., Gibson, W. M. and. Paul, K. B. (1989), Construction of a Job in General Scale: A Comparison of Global, Composite, and Specific Measures, Journal of Applied Psychology, 74, 2, 193-200.
[45]  Judge, T. A., and Klinger, R. (2008), Job satisfaction: Subjective well-being at work. In M. Eid & R. Larsen (Eds.), The science of subjective well-being, 393–413, New York, Guilford Publications.
[46]  Judge, T. A., Hulin, C. L., and Dalal, R. S (2012), Job Satisfaction and Job Affect. In S. W.J. Kozlowski (Ed), The Oxford Handbook of Organizational Psychology, 496-525, Volume 1, New York Oxford University Press.
[47]  Judge, T. A., Parker, S., Colbert, A. E., Heller, D. and Ilies, R. (2001), Job satisfaction: A cross-cultural review. In Handbook of industrial, work and organizational psychology, Vol. 2, ed. N. Anderson, D. S. Ones, H. K. Sinangil, and C. Viswesvaran, 25–52. London: Sage.
[48]  Kaiser, L. C. (2007), Gender Job satisfaction differences across Europe: An indicator for labor market modernization. International, Journal of Manpower, 29, 1, 4–6.
[49]  Kalamatianou, A. G. and Kougioumoutzaki, F (2012), Employment Status and Job-Studies Relevance of Social Science Graduates: The Experience from a Greek Public University, International Journal of Economic Sciences and Applied Research, 5, 1), 51-75.
[50]  Kalleberg, A. L. (1977), Work values and job rewards: A theory of job satisfaction, American Sociological Review, 42, 124–143.
[51]  Kalleberg, A. L. and Loscocco, K. A. (1983), Aging, values, and rewards: Explaining age differences in job satisfaction, American Sociological Review, 48, 1, 78–90.
[52]  Kifle, T. and Kler, P., (2007), Job satisfaction and gender: Evidence from Australia. Paper presented at the HILDA Survey Research Conference 2007, Melbourne, July 19–20, 2007. Retrieved May 9, 2018, at https://espace.library.uq. edu.au/view/UQ:160183.
[53]  Kressel, N. J. (1990), Job and degree satisfaction among social science graduates, Teaching of Psychology, 17, 4, 222-227.
[54]  Kucel A. and Vilalta-Bufí, M. (2013a), Why do tertiary education graduates regret their study program? A comparison between Spain and the Netherlands, Higher Education, 65, 5, 565-579.
[55]  Kucel, A and Vilalta-Bufí, M (2013b), Job satisfaction of university graduates. Revista de Economía Aplicada, 3, 179, 1-27.
[56]  Liagouras, G., Protogerou, A. and Caloghirou, Y. (2003), Exploring mismatches between higher education and the labour market in Greece, European Journal of Education, 38, 4, 413-426.
[57]  Little, B. and Arthur, L. (2010), Less time to study, less well prepared for work, yet satisfied with higher education: A UK perspective on links between higher education and the labour market, Journal of Education and Work, 23, 3, 275–296.
[58]  Locke, E.A. (1976), The nature and causes of job satisfaction. In M.D. Dunnette (Ed.), Handbook of Industrial and Organizational Psychology, 1297–1349, Chicago: Rand McNally. 1st ed.
[59]  Low, L. (2000), Are College Students Satisfied? A National Analysis of Changing Expectations, Noel-Levitz, Iowa City, IA, cited in Banwet, D.K. and Datta, B. (2003), Study of the effect of perceived lecture quality on post-lecture intentions, Work Study, 52, 5, 234-43.
[60]  Machado, M. d. L., Brites, R., Magalhães, A. and Sá, M. J. (2011), Student satisfaction with higher education: Critical data for student development, European Journal of Education, 43, 415–432.
[61]  McGuinness, S. and Byrne, D. (2014), Examining the relationships between labour market mismatches, earnings and job satisfaction among immigrant graduates in Europe. IZA Discussion Paper No. 8440. The Institute for the Study of Labor.
[62]  Miller, J. (1980), Individual and occupational determinants of job satisfaction: A focus on gender differences, Sociology of Work and Occupations, 7, 337–366.
[63]  Mora J-G., Vila, L. E. and García-Aracil, A. (2005), European Higher Education Graduates and Job Satisfaction, European Journal of Education, 40, 1, 35-44.
[64]  Mora, J-G, García-Arasil, A., and Vila, L. E. (2007), Job satisfaction among young European higher education graduates, Higher Education, 53, 29–59.
[65]  Nagy, M. S. (2002), Using a single-item approach to measure facet job satisfaction, Journal of Occupational and Organizational Psychology, 75, 77–86.
[66]  Navarro, M., Iglesias, M. and Torres, P. (2005), A new management element for universities: satisfaction with the offered courses, International Journal of Educational Management, 19, pp. 505-526.
[67]  Núñez, I. and Livanos, I. (2010), Higher education and unemployment in Europe: an analysis of the academic subject and national effects, Higher Education, 59, 4, 475–487.
[68]  Oshagbemi, T. (1999), Overall job satisfaction: how good are single versus multiple-item measures?, Journal of Managerial Psychology, 14, 5, 388-403.
[69]  Pedhazur, E. J. (1982), Multiple regression in behavioral research: Explanation and prediction. 3rd ed., Wadsworth, Thomson Learning, USA.
[70]  Quinn, R. P. and Shepard, L.J. (1974), The 1972-73 quality of employment survey, Institute for Social Research, University of Michigan. Ann Arbor.
[71]  Quinn, R. P. and Staines, G. L. (1979), The 1977 Quality of Employment Survey. Ann Arbor, MI: Institute for Social Research.
[72]  Reimer. D., Noelke. C. and Kucel, A. (2008), Labor Market Effects of Field of Study in Comparative Perspective. An Analysis of 22 European Countries, International Journal of Comparative Sociology, 49, 4/5, 233-256.
[73]  Rice, R. W, Frone, M. R. and McFarlin, D. B. (1992), Work-nonwork conflict and the perceived quality of life, Journal of Organizational Behavior, 13, 155-168.
[74]  Russell, S. S., Spitzmuller, C., Lin, L. F., Stanton, J. M., Smith, P. C. and Ironson, G. H. (2004), Shorter can also be better: the abridged job in general scale, Educational and Psychological Measurement, 64, 5, 878-893.
[75]  Scarpello, V. and Campbell, J. P. (1983), Job Satisfaction: Are all the parts there?, Personnel Psychology, 36, 577-600.
[76]  Schofer, E. and Meyer, J. W. (2005), The Worldwide Expansion of Higher Education in the Twentieth Century, American Sociological Review, 70, 6, 898-920.
[77]  Schomburg, H. (2007a), Work orientation and job satisfaction, in Teichler, U. (2007), Careers of university graduates, New York, Springer, 247-264.
[78]  Schomburg, H. (2007b), The professional success of higher education graduates, European Journal of Education, 42, 35-57
[79]  Schomburg, H. and Teichler, U. (2006). Higher education and graduate employment in Europe: Results of graduate survey from twelve countries. Higher education dynamics, Vol. 15, Springer, Netherlands.
[80]  Sloane, P. and Williams, H. (2000), Job satisfaction, comparison earnings and gender, Labour, 14, 473-501.
[81]  Smith, P. C., Kendall, L. M. and Hulin, C. L. (1969), The measurement of satisfaction in work and retirement, Chicago: Rand McNally.
[82]  Smith, P. C., Kendall, L. M. and Hulin, C. L. (1985). The Job Descriptive Index (Rev. ed.). Bowling Green, OH: Department of Psychology, Bowling Green State University. (Original work published 1975)
[83]  Solomon, L.C. and Tierney, M.L. (1977), Determinants of Job Satisfaction among College Administrators, The Journal of Higher Education, 48: 412-431.
[84]  Sousa-Poza, A. and Sousa-Poza, A. A. (2003), Gender differences in job satisfaction Great Britain, 1991-2000: Permanent or Transitory?, Applied Economic Letters, 10, 691-694.
[85]  Souza-Poza, A. and Souza-Poza, A. A. (2000), ‘Taking another look at the gender/job satisfaction paradox, Kyklos, 53, 135–152.
[86]  Spokane, A. R., Meir, E.I. and Catalana, M. (2000), Person-environment congruence and Holland’s theory: A review and reconsideration, Journal of Vocational Behavior, 57, 137-187.
[87]  Støren, L. A. & Arnesen, C. Å., (2011), Winners & losers’, in Allen, J. & Van der Velden, R. (Eds.) The Flexible Professional in the Knowledge Society (Higher Education Dynamics, 35 (Series) Dordrecht: Springer.
[88]  Sum, V., McCaskey, M. J. and Kyeyune, C. (2008), A survey research of satisfaction levels of graduate students enrolled in a nationally ranked top-10 program at a mid-western university, Research in Higher Education Journal, 7, 2, 1-17.
[89]  Sweeney, L. (2016), A Predictive Model of Student Satisfaction, Irish Journal of Academic Practice, 5, 1, Article 8. Available at: http://arrow.dit.ie/ijap/vol5/iss1/8.
[90]  Taber, T. D. and Alliger, G. M (1995), A task-level assessment of job satisfaction, Journal of Organizational Behavior, 16, 101-121.
[91]  Teichler, U. (1989), Research on Higher Education and Work in Europe, European Journal of Education, 24, 223-247.
[92]  Thomas, E. H. and Galambos, N. (2004), What satisfies students? Mining Student-Opinion Data with Regression and Decision Tree Analysis, Research in Higher Education, 45, 3,. 251-269.
[93]  Thompson, E. R. and Phua, F. T. T. (2012), A Brief Index of Affective Job Satisfaction, Group & Organization Management, 37, 3, 275-307
[94]  Tinto, V. (1993), Leaving college. (2nd ed.). Chicago: University of Chicago Press.
[95]  Titley, R. W. (1978), Whatever happened to the class of '67? Psychology baccalaureate holders one, five, and ten years after graduation, American Psychologist, 33, 12, 1094-1098.
[96]  Tsoukalas, K. (1977), Dependence and Reproduction: the social role of educational mechanisms in Greece (1832 1922), Athens, Themelio. (in Greek).
[97]  Van Saane, N., Sluiter, J. K., Verbeek, A. M. and Frings-Dresen, M. H.W. (2003), Reliability and validity of instruments measuring job satisfaction - a systematic review, Occupational Medicine, 53, 191–200.
[98]  Veenhoven, R. (1996), Developments in satisfaction research, Social Indicators Research, 37, 1-46.
[99]  Vila, L. E. and García-Mora, B. (2005), Education and the determinants of job satisfaction. Education Economics, 13, 4, 409-425.
[100]  Vila, L. E., Garcia-Aracil, A. and Mora, J-G. (2007), The Distribution of Job Satisfaction Among Young European Graduates: Does the Choice of Study Field Matter?, The Journal of Higher Education, 78, 1), 97-118.
[101]  Walters, D. (2004), A Comparison of the Labour Market Outcomes of Postsecondary Graduates of Various Levels and Fields over a Four-Cohort Period, Canadian Journal of Sociology, 29, 1, 1-27.
[102]  Wanous, J. P., Reichers, A. E., and Hudy, M. J. (1997), Overall job satisfaction: How good are single-item measures?, Journal of Applied Psychology, 82, 2, 247-252.
[103]  Weiss, D. J., Dawis, R. V., England, G. W, and Lofquist, L. H. (1967), Manual for the Minnesota Satisfaction Questionnaire. Minneapolis: Industrial Relations Center, University of Minnesota.
[104]  Weiss, H. M. (2002), Deconstructing job satisfaction: separating evaluations, beliefs and affective experiences, Human Resource Management Review, 12, 173-194.
[105]  Whelan, A. and McGuinness, S. (2017), Does a Satisfied Student Make a Satisfied Worker?, IZA Discussion Papers, No. 10698. Retrieved 15/4/2018 at https://papers.ssrn.com/sol3/papers.cfm?abstract_id=2956793.
[106]  Wilkins, S. and Balakrishnan, M. S. (2013), Assessing student satisfaction in transnational higher education, International Journal of Educational Management, 27, 2, 143–156.
[107]  Willdridge, K. J. (2013), An Exploration of Educational Psychologists’ Views of Their Role and Job Satisfaction. Doctorate in Educational Psychology, Cardiff University. Retrieved 15/4/2018 at http://orca.cf.ac.uk/51785/1/2013WilldridegeKDEdPsy.pdf.
[108]  Wolniak, G. C. and Pascarella, E. T. (2005), The effects of college major and job field congruence on job satisfaction, Journal of Vocational Behavior, 67, 233–251.