Ikughur A. J.1, Imande M. T.2, Ohioma E. O. B.3
1Department of Mathematics/Statistics/ Computer Science, University of Agriculture, Makurdi, Nigeria
2Department of Mathematics/Computer Science, Benue State University Makurdi, Nigeria
3Department of Real Sector and Household Statistics, National Bureau of Statistics, Abuja, Nigeria
Correspondence to: Ikughur A. J., Department of Mathematics/Statistics/ Computer Science, University of Agriculture, Makurdi, Nigeria.
| Email: |  |
Copyright © 2018 The Author(s). Published by Scientific & Academic Publishing.
This work is licensed under the Creative Commons Attribution International License (CC BY).
http://creativecommons.org/licenses/by/4.0/

Abstract
The problem of food security is of great concern to all stakeholders for national development. Food shortage in an economy inflicts undesirable costs on citizens as food is a basic human need. Of statistical concern is the estimation of crop yield in a single period called survey period. When data is available over different periods of time, it becomes plausible that the trend of the estimated yields be also investigated. Thus, this study utilized design and model based ratio and regression estimators to provide estimates of total national yields of maize and then fit linear trend to determine the growth in crop yield over time in Nigeria. It further investigated the performance of the estimator using samples of sizes 20 and 30 drawn using simple random sampling without replacement strategy from the 37 survey plots (36 states and FCT, Abuja) and the variables namely, maize yield (Y) and land area (X) were observed for estimation. Similarly, the asymptotic properties of the estimator are also investigated. Results revealed that there was increase in the year by year estimate of total yield of maize in each of the sample size cases except in 2006 where a sudden fall was experienced. It further showed that regression estimator performed better than the ratio estimator when the Mean Squared Error (MSE), Root Mean Squared Error (RMSE) and Coefficient of Variation (CV) are utilized for all sample sizes considered for both design and model based estimators.
Keywords:
Food security, Estimation, Auxiliary variable, Relative efficiency
Cite this paper: Ikughur A. J., Imande M. T., Ohioma E. O. B., Estimation of Total Maize Yields in Nigeria, International Journal of Statistics and Applications, Vol. 8 No. 4, 2018, pp. 211-218. doi: 10.5923/j.statistics.20180804.06.
1. Introduction
In most developing countries, agriculture is both the main traditional pursuit and the key to sustained growth of the modern economy. Economic growth has gone hand in hand with agricultural progress. On the other hand, stagnation in agriculture is the principal explanation for poor economic performance, while rising agricultural productivity has been the most important concomitant of successful industrialization (Abayomi, 1997). In Nigeria, the trend in the share of agriculture in the gross domestic product (GDP) shows a substantial variation and long-term decline from 60% in the early 1960s through 48.8% in the 1970s and 22.2% in the 1980s (Abayomi, 1997). A slight increase in the GDP was witnessed in 2010, 23.89% (NBS, 2011) and 23.33% in 2013 (NBS, 2014). It has been predicted that there would be a catastrophic widespread food famine, the type the world has never experienced before the year 2020 (Food Security and National Development, 2014) even as Wood (2011) observed that, the earth’s population would grow so great as to overcome the earth’s ability to provide enough food and other infrastructures necessary for human survival.Food Security is achieved when all people, at all times, have physical and economic access to sufficient, safe and nutritious food to meet their dietary needs and food preferences for an active and healthy life (FAO, 1996). Thus, the main goal of food security is for individuals to be able to obtain adequate food needed at all times, and to be able to utilize the food to meet the body’s needs. It is therefore of national interest to devise strategies to guard against food insecurity and hence the need to provide statistical information for good national planning and execution of sustainable agricultural development programmes and policies that will ensure stable food supply.One useful means for planning agricultural activities for the future is the use of agricultural statistics that are collected either by censuses, which require enumeration of the total population of interest, or by samples requiring enumeration of only a small part of the population and estimating population characteristics. The data so collected are put in the form of models to estimate or predict the characteristics of interest. There are several models or estimators of crop yield that are found in the works by Jain et al., (1984), Martis et al., (1988), Brus and Gruijter (1997), Bornn and Zidek (2012) among others.In this study, we employ the design based ratio estimator to provide estimates of total maize yields in Nigeria under the assumption that each administrative state in Nigeria forms a survey plot under which the yields reported are assumed to be realization of a crop-cutting experiment. The aim of the study, therefore, is to provide estimates of total crop yields (for maize) in Nigeria and the trend of maize yield over time. Specifically, we utilize the regression and design based ratio estimator to provide estimates of total crop yields for samples of sizes 20 and 30, and to study the efficiency of the estimators using design based efficiency criteria.
2. Literature Review
Agricultural productivity refers to the output produced by a given level of input(s) in a given economy (Fulginiti and Perrin, 1998). More formally, it can be defined as “the ratio of the value of total farm outputs to the value of total inputs used in farm production” (Olayide and Heady, 1982). Crop Yield on the other hand, is the measurement of the amount of a crop that was harvested per unit of land area (also referred to as “actual seed generation from the plant” or “agricultural output”).Mathematically, we define crop yield as crop yield = (amount of harvested product) / (crop area).This ratio expresses in kilograms (kg) or metric tonnes (t) of product per hectare (ha). In essence, the estimation of crop yield thus involves both estimation of the crop area and estimation of the quantity of product obtained from that area which Michael (2007) portrayed as the product of two components namely: area (to be) harvested and (expected) yield per unit area.In survey sampling studies, there are several estimators that utilize auxiliary information. These include ratio estimators, regression estimators, probability proportional to size with and without replacement strategies (Chaudhuri, 2010 and Raj, 1965) among others and they provide foundational estimators of population characteristics when auxiliary information are available.Anneke (2011), revealed that pioneers in sampling and survey design in the late 1940s developed a method (crop-cut methods) for estimating crop yields based on sampling of small subplots within cultivated fields in India. One of such early contribution include works by Cochran (1940). In the 1950s, crop-cut methods were adopted as the standard method recommended by the Food and Agriculture Organization of the United Nations (FAO) to measure crop production (FAO, 1982; Murphy, Casley, and Curry, 1991).In India, the sampling design of the crop surveys is a stratified two-stage random sampling with villages in the circles as the primary sampling units, fields growing the crop in the selected villages as the second stage units and standard plots usually of size 5 m x 5 m in the selected fields as the ultimate sampling units while in Nigeria, agricultural data is collected by National Bureau of Statistics (NBS) through the two data collection infrastructure; National Integrated Survey of Household (NISH) and National Integrated Survey of Establishment (NISE). A two-phase sampling scheme has been adopted by NBS for traditional/peasant sector of the sample survey. Cochran (1940) made the first attempt to investigate the problem of estimation of population mean when auxiliary variables are present and he proposed the ratio estimator of population mean making use of information related to the supplementary characteristics having positive correlation with the variable under consideration. Bellow (2007) revealed that the National Agricultural Statistics Service (NASS) in United States Department of Agriculture used ratio estimation method to derive county level yields. The simple ratio estimator was computed as the sum of Quarterly Agricultural Surveys (QAS) reported crop production divided by the corresponding sum of reported harvested acreage. It was deduced that the estimator produced unreliable yields due to fluctuations in harvested area from year to year.Arunachalam and Balakrishnan (2012) investigated the trends in area, production and productivity of wheat crop grown during 1950 - 1951 to 2009 - 2010 in India using different non-linear models for data. They found that the Sinusoidal model was suitable to fit the trend in production of wheat. Similarly, Makwoski and Micheal (2013) used dynamic linear model for predicting crop yield trends in foresight studies on food security. They observed that the world’s population is fast growing to pass 9 billion in 2050 and this raises increasing concern about the capacity of agriculture to feed the world. They presented a foresight study on food security by estimating crop yields using statistical methods such as Time series, linear and non-linear regression, and moving average.Although many models have been used to estimate crop yields at local level, none has estimated crop yields at national level in Nigeria while considering land use as auxiliary variable using the design and model based ratio estimation techniques along with the study of trend of the estimates. Therefore, this study focused on the use of design and model based ratio estimators to estimate maize yields in Nigeria. Trend analysis was also carried out to determine the growth of crop yields.
3. Methods
In this section, method of data collection and the estimator of crop (maize yield) using the design and model based estimation perspectives are presented. Data reported by National Bureau of Statistics (NBS) in her annual Agricultural Surveys from 1994 to 2009 is considered and it consists of the study variable, Y (maize yields) and auxiliary variable, X (land area) for the 36 states of Nigeria and the Federal Capital Territory (FCT). Using this as sampling frame with N=37, we select a samples of size n = 20 and n = 30 states using simple random sampling without replacement (SRSWOR) strategy. The choice of n=20 and n=30 is to permit the comparison of the ratio estimator of crop yields. A uni-cluster design with varying elements taken at one stage only is assumed in this study.The Ratio EstimatorConsider a population of size N from which a sample of size  is drawn without replacement. Suppose that a SRSWR scheme is implemented,
  and
and  are drawn from the sample. Let
  and
and  be unbiased estimators of the population totals Y and X of the study and auxiliary variable respectively. Then, the design based ratio estimator of the population total is defined as
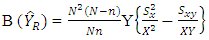
  | (1) |
Under probability sampling design, the ratio estimator is a biased estimator of population total as  Bias and Mean Squared Error of the Ratio EstimatorThe approximate bias of the ratio estimator denoted as
  is given as
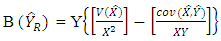 | (2) |
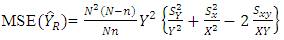
while the Mean Square Error of the ratio estimator, denoted by  is given as
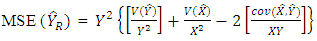 | (3) |
Since the samples are selected using the SRSWOR procedure, the following results for estimator, it’s bias and MSE that conform with the SRSWOR scheme are given below: | (4) |
 | (5) |
 | (6) |
The corresponding sample means, variances for Y and X and the covariance are respectively given below;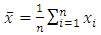 | (7) |
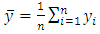 | (8) |
 | (9) |
 | (10) |
and | (11) |
When samples have been drawn, the observations are used to estimate the population mean square error and the associated inference based on the sample so selected. The estimated MSE of the population total for ratio estimator under SRSWOR is given by;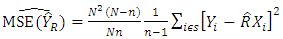 | (12) |
where | (13) |
Super-population modelsConsider the super population model | (14) |
With the following assumptions namely,  and
and  defined as model based expectation, variance and covariance respectively. Under super population model, noting that
  we have
 | (15) |
which confirms that ratio estimator is a special case of regression estimator.Model Based Estimator of MSE and its stabilityThe model based estimator of population  for ratio estimator is
 | (16) |
where  and
and  In (16) above, there are two components namely
 | (17) |
and | (18) |
Thus (17) and (18) when summed together satisfy the non-negativity of variance condition and the stability of the variance of the estimator could be investigated using the criterion namely | (20) |
for estimated values of  and
and  Investigating Asymptotic Property of the EstimatorThe Chebychev’s Inequality is used here to investigate the asymptotic property of the ratio estimator. In particular, if
  and we set
  so that
  . Thus, by Chebychev,
 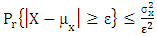 or
or 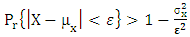 and further substituting
  we get
  For the estimator of maize yield
  , Let the bias be
  and the MSE given as
  , then
  (see Chaudhuri, 2010)
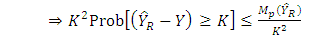 | (21) |
 | (22) |
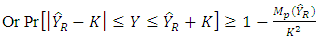
Neyman (1934) demonstrated this version of Chebychev’s inequality in the context of survey sampling by taking K =  where
where  is a positive constant. It follows that
 | (23) |
where  is used as proxy for
  Regression Estimator of Population TotalThe linear regression estimator like others is designed to increase precision by the use of an auxiliary variate
  that is correlated with
  We suppose that
  on
on  are obtained for every unit in the sample and that the population mean
  of the
  is known. The linear regression estimate of
  the population mean of the
  is
is  | (24) |
Where lr denotes linear regression and  is estimate of the change in y when x is increased by unity where
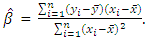 Therefore, the corresponding estimate of the population total Y is given as
 | (25) |
The sample estimate of  is given as
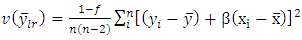 | (26) |
The corresponding estimates of population total is  | (27) |
Where the estimated variance can also be written as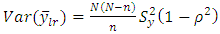 | (28) |
Comparison of Regression and Ratio EstimatorsTwo comparable variances for the estimated population mean  for regression and ratio estimators are
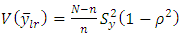 and
and 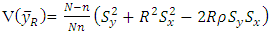 respectively.Regression estimator is more efficient than the Ratio estimator if and only if
 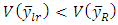 Which is equivalent to
  Assuming that
  and also
  are negligible, we realize
 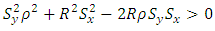 and by factorization noting that,
 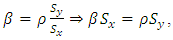 the condition becomes
  If
If  and hence
  are not negligible, then
  or
or  When
When  so that
  or
or  Thus
Thus  is the necessary condition for regression estimator to be more efficient than ratio estimator.Measures of EfficienciesIn this study, we utilize some measures of efficiency for our inference namely, coefficient of variation and Relative efficiency computed by
  | (29) |
and | (30) |
where the Root Mean Square Error is given as | (31) |
or in terms of Relative Efficiency | (32) |
4. Results and Discussion
The results for the Design Based Estimation of total maize yields using ratio and regression estimators, their Mean Squared Error (MSE) and Root Mean Squared Error for sample of size 20 are shown on Tables 1, 2 and 3 as well as Figures 1, 2 and 3 respectively. Tables 4, 5 and 6 compare estimates of total maize yields using ratio and regression estimators, its Mean Squared Error (MSE) and Root Mean Squared Error for samples of size 20 for both ratio and regression estimators. The total maize yield for the samples of size n= 20 and n=30 were compared using ratio and regression estimators. The results shown in Figures 1, 2 and 3 reveal that regression estimator is better when the sample size is 20 and the two estimators are approximately equal for samples of size 30.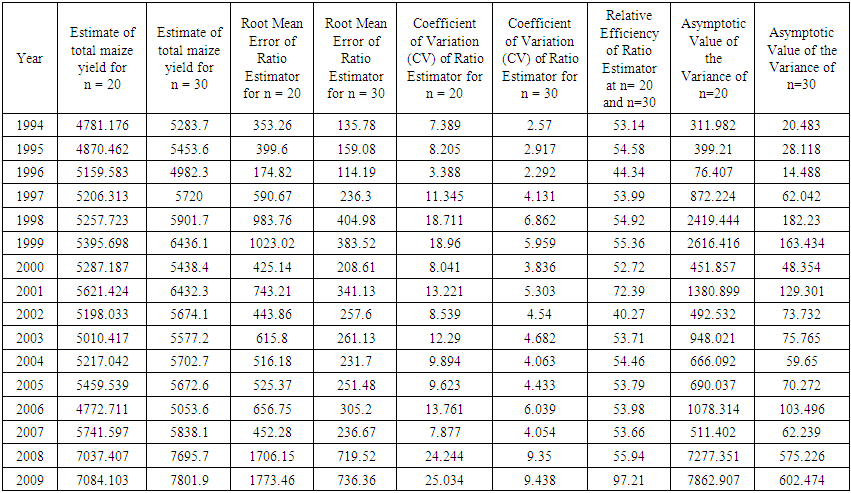 | Table 1. Estimate of Total Maize Yield using Ratio Estimator for samples of size n=20 and n=30 with the optimality Criteria utilized |
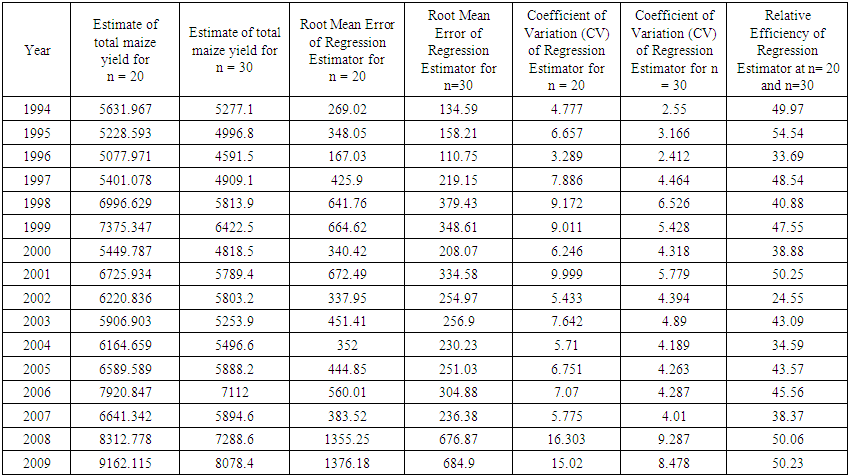 | Table 2. Estimate of Total Maize Yield using regression Estimator for samples of size n=20 and n=30 with the optimality Criteria utilized |
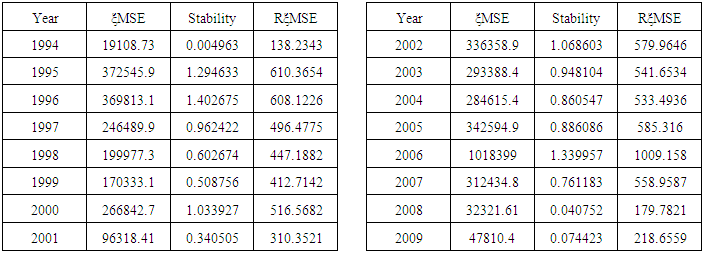 | Table 3. Model Based Mean Squared Error, Stability and Root Expected Mean Squared Error for the Estimator at n=20 |
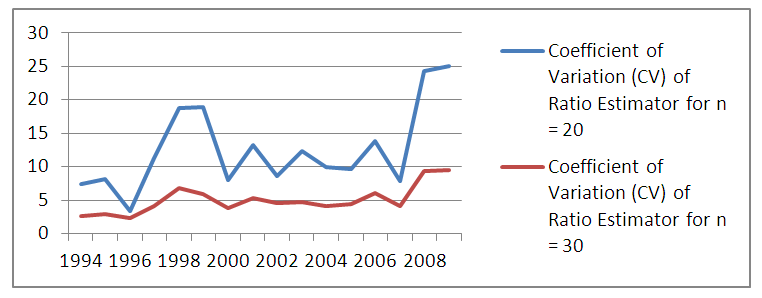 | Figure 1. Coefficient of Variation (CV) of Ratio Estimator for n= 20 and n=30 |
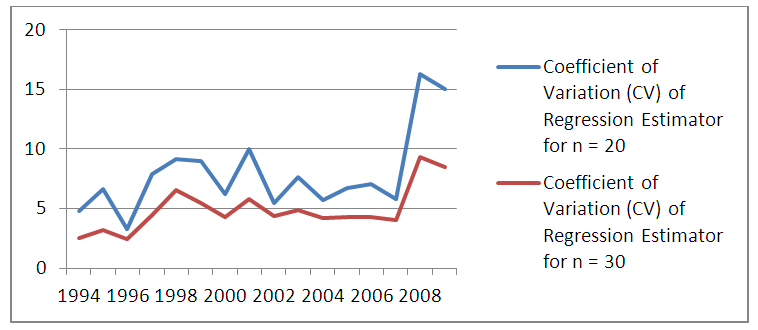 | Figure 2. Coefficient of Variation (CV) of Regression Estimator for n=20 and n=30 |
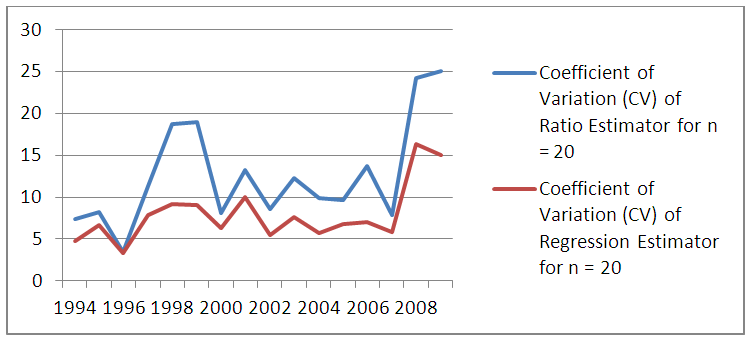 | Figure 3. Comparison of CV of Ratio and Regression Estimators for n=20 |
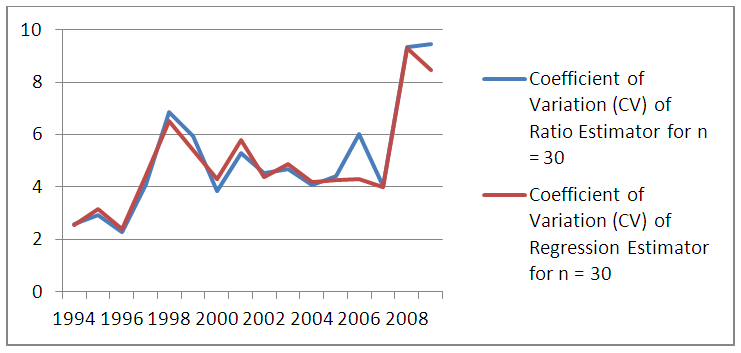 | Figure 4. Comparison of CV of Ratio and Regression estimators for n=30 |
The total maize yield for the samples of size n= 20 and n=30 were estimated using ratio and regression estimators. Similarly the efficiency of the estimator determined by the relative efficiency (RE) as well as coefficient of variation (CV) is used as optimality criteria. Results showed that regression estimator is better when the sample size is 20 but when the sample size is 30, the two estimators tend to be approximately the same efficiencies at most points in time. This is in agreement with theoretical results of laws of large numbers (Neyman, 1934, Chaudhuri, 2010) that as  the anticipated variance tends to 0. Thus, throughout the period of estimation, CV
  (20) always. Similarly MSE
  (20). In terms of Relative Efficiency (RE) and asymptotic value of the variance for n=20 and n=30, we discovered that the RE of the estimators for n = 30 is far less than 100% indicating that the variation for n = 30 is less than that of n= 20.The results in Table 3 showed the expected Mean Squared error
  and hence, the stability of the estimator. Thus, the model based RMSE of our estimator for n=20 and n=30 showed that the model’s root mean squared error for n=30 is consistently better than that for n=20. In terms of stability of the estimator we have shown that, the estimator is stable under the condition of
  or
or 
5. Concluding Remark
The study utilized Design based Ratio and regression Estimators to provide estimates of total maize yields in Nigeria from 1994 to 2009. The study investigated the performance of the estimator using MSE and CV (and hence, the corresponding model based estimates of MSE and CV) criteria for samples of sizes 20 and 30. The Mean Squared Error and Coefficient of Variation obtained showed that the regression estimator performed better than ratio estimator for sample of size 20. However, for n = 30, the two estimators appear to be converging with each other. The model based MSE also is a pointer to the fact that large sample size is preferable. Importantly, the estimators have succeeded in estimating total maize yields in Nigeria whose trend is increasing with time. We conclude that both the ratio and regression estimators are useful in providing estimates of crops yields so as to provide needed information to evolve policy that will ensure Food Security in Nigeria especially, when data at state levels are available and large sample size is considered. Similarly, the trend shows an increasing yield over time. However, when small sample size is of interest, regression estimator provides better estimates of population characteristics.
References
| [1] | Abayomi, Y.O. (1997). The Agricultural Sector in Nigeria, the Way Forward, 21(3), Local Government Finance Office, Research Department, Central Bank of Nigeria. |
| [2] | Anneke, F. and Todd B. (2011). Estimating Yield of food Crops Grown by Smallholders Farmers, A Review in the Uganda Context. IFPRI Discussion Paper 01097. |
| [3] | Arunachalam and Balakrishnan (2012). Statistical Models for Wheat Production, International Journal of Statistics and Application, 2(4); 40-46. |
| [4] | Bellow, M., and Lahiri, P. (2012) “Evaluation of Methods for County Level Estimation of Crop Harvested Area that Employ Mixed Models”, Proceedings of the DC-AAPOR /WSS Summer Conference, American Statistical Association, Bethesda Maryland. |
| [5] | Bornn, L. and Zidek, J.V. (2012). Efficient Stabilization of crop yield production in the Canadian Prairies Agricultural and Forestry Methodology 152: 223-232. |
| [6] | Brus, D.J. and de Gruijter, J.J. (1997). Random Sampling on Geo-statistical Modelling; focusing between design based and model-based sampling Strategies for Soils Geoderma 80: 1-44. |
| [7] | Chauldhuri, A. (2010). Essential of Survey Sampling: PHI Learning Limited, New Delhi-1100 Indian. |
| [8] | Cochran, W.G. (1940). The Estimation of the Yields of Cereal Experiments by Sampling for the Ratio Gain to Total Produce. Jour. Agric. Soc. 30: 262-275. |
| [9] | Cochran, W.G. (1977). Sampling Techniques, Wiley Eastern Limited, New York: John and Sons. |
| [10] | David, I. P. (1978). “Non-sampling Errors in Agricultural Surveys Review, Current Findings and Suggestions for Future Research.” Paper presented at the Philippine Statistical Association Annual Conference, June 19, Manila, Philippines. |
| [11] | FAO (Food and Agriculture Organization of the United Nations). (1982). The Estimation of Crop Areas and Yields in Agricultural Statistics. Economic and Social Development Paper No. 22. Rome, Italy. |
| [12] | Fulginiti, L.E. and PerriR.K (1998). Agricultural Productivity in Developing Countries. Agricultural Eonomics. 19 (1-2): 45-51. |
| [13] | Makwoski D. and Micheal L (2013). Use of dynamic linear model for predicting crop yield trends in foresight studies on food security. ICAS VI, 6th International Conference on Agricultural Statistics. |
| [14] | Martis, J.H, Gaito, T, Grant, W.E, Irwing, W.C and Ritchie, J.C (1988). A Markov Chain Approach to Crop Yield Forecasting. Agricultural Systems, 18: 171-187. |
| [15] | Michael, E. B. (2007). Improved County-Level Estimation of Crop Yield Using Mode l- Based Methodology with a Spatial Component. |
| [16] | Murphy, J., CasleyD. J., and CurryJ. J. (1991). Farmers’ Estimations as a Source of Production Data. World Bank Technical Paper 132. Washington, DC: World Bank. |
| [17] | National Bureau of Statistics, (NBS, 2007). Filling Data Gaps in Agricultural Statistics. NBS (2014) Gross Domestic Product Rebasing Publication. |
| [18] | Okafor, F.O. (2002). Sample Survey Theory with Application. 1st Edition, University of Nigeria, Nsukka, Afro-Orbis Publication Ltd. |
| [19] | Olayide, S.O and Heady, E. (1982). Introduction to Agricultural Production Economics. Ibadan University Press, Nigeria. |
| [20] | Raj, D. (1965). On a method of using multi-auxiliary information in sample Surveys, Journal of the American Statistical Association, 60: 154–165. |
| [21] | Rao, J.N.K., Hartley, H.O and Cochram, W.G. (1962). On a simple procedure of Unequal Probability Sampling Without replacement. Jour. Roy. Stat. Soc. Ser B, 24: 422-491. |
| [22] | Wood, J. (2011). Mathius, Famine Disease and World Population Retrieved 24 Jan 2015. Available from http//www.malthus.famine.disease and world.Population/htm/. |
| [23] | Yates, F. (1960). Sampling Methods for Censuses and Surveys. Charles Griffin & Company Limited, London. |

 Abstract
 Reference
 Full-Text PDF
 Full-text HTML