-
Paper Information
- Next Paper
- Previous Paper
- Paper Submission
-
Journal Information
- About This Journal
- Editorial Board
- Current Issue
- Archive
- Author Guidelines
- Contact Us
International Journal of Statistics and Applications
p-ISSN: 2168-5193 e-ISSN: 2168-5215
2018; 8(4): 173-188
doi:10.5923/j.statistics.20180804.03

Comparing the Crash Injury Severity Risk Factors at High-Volume and Low-Volume Intersections with Different Traffic Control in Alabama
 Abstract
 Reference
 Full-Text PDF
 Full-text HTML
Sumalatha Kesavareddy, Kirolos Haleem, Mehrnaz Doustmohammadi, Michael Anderson
Department of Civil and Environmental Engineering, University of Alabama in Huntsville, Huntsville, United States
Correspondence to: Sumalatha Kesavareddy, Department of Civil and Environmental Engineering, University of Alabama in Huntsville, Huntsville, United States.
| Email: |  |
Copyright © 2018 The Author(s). Published by Scientific & Academic Publishing.
This work is licensed under the Creative Commons Attribution International License (CC BY).
http://creativecommons.org/licenses/by/4.0/

Objective: Typically, intersections that carry more traffic will have more crashes; however, these crashes might not be severe. On the other hand, low-volume intersections might have lower number of crashes; however, can be more severe than their high-volume counterparts. Since the geometric and traffic characteristics of signalized and stop-controlled intersections are different, the significant factors affecting crash severity at both intersection types will be also different. This paper identifies and compares those significant factors affecting crash severity at high- and low-volume signalized and stop-controlled intersections in Alabama using five-year crash data from 2010 to 2014. A cut-off value of 1,000 vehicles/day was used to classify intersections as high-volume vs. low-volume. Method: A random forest model was used to rank variable importance and a binary logit model was applied to identify the significant factors at both high- and low-volume signalized and stop-controlled intersections. Four discrete models (high-volume signalized, low-volume signalized, high-volume stop-controlled, and low-volume stop-controlled) were developed. Roadway, traffic, vehicle, driver, and environmental characteristics were used as independent variables in the models. Results: In all four models, crashes in rural areas showed higher severity compared to urban areas and right-turning maneuver showed relatively lesser severity. Rear-end crashes showed lower severity compared to side impacts at high- and low-volume stop-controlled and high-volume signalized intersections. Head-on crashes, driving under influence (DUI) of alcohol/drugs, and increase in driver age showed higher severity at high- and low-volume signalized intersections. Motorcycles were associated with higher severity at high- and low-volume signalized intersections, as well as high-volume stop-controlled intersections. Conclusions: Most of the factors with the highest ranking from the random forest model were found significant in the binary logit models. Strategies to alleviate crash severity at different intersections are suggested. Practical Applications: Since the left-turning vehicle maneuver showed higher severity likelihood at high-volume signalized intersections, providing enough sight distance and protected left turn phase (with no permitted phase) in busy intersections is suggested. Also, education programs should be designed disseminating the dangerous effect of DUI on crash severity while crossing signalized intersections.
Keywords: Crash Injury Severity, Signalized Intersections, Stop-Controlled Intersections, High-Volume, Low-Volume, Significant Factors
Cite this paper: Sumalatha Kesavareddy, Kirolos Haleem, Mehrnaz Doustmohammadi, Michael Anderson, Comparing the Crash Injury Severity Risk Factors at High-Volume and Low-Volume Intersections with Different Traffic Control in Alabama, International Journal of Statistics and Applications, Vol. 8 No. 4, 2018, pp. 173-188. doi: 10.5923/j.statistics.20180804.03.
Article Outline
1. Introduction
- The purpose of an intersection is to organize vehicles turning maneuvers to allow smooth flow of vehicles from the intersecting approaches. Crashes at intersections may or may not be severe, and this could depend on the traffic volume. Although high-volume intersections typically have more crashes than low-volume ones, it is undetermined whether the crash severity will be higher or not, which mainly depends on the characteristics of the crash and the geometric characteristics of the intersection. Since the geometric and traffic characteristics of signalized and stop-controlled intersections are different, the significant factors affecting crash severity at both intersection types will be different as well. Based on the distribution of traffic volumes (either high- or low-volume) at signalized and stop-controlled intersections, the percentage of crash severity varies. For instance, in the state of Alabama, from 2010 to 2014, 34.15% of the total crashes occurred at high-volume signalized intersections, 3.90% occurred at low-volume signalized intersections, 12.37% occurred at high-volume stop-controlled intersections, and 2.16% occurred at low-volume stop-controlled intersections. In this study, a high-volume intersection is that intersection having an annual average daily traffic (AADT) greater than 1,000 vehicles/day, whereas a low-volume intersection is that intersection with an AADT less than or equal to 1,000 vehicles/day. This definition of high- and low-volume intersections has been emphasized in previous studies (see for example, Peshkin et al. (2009)). The driver behavior and the inherent geometric and traffic characteristics at signalized and stop-controlled intersections are significantly different; thus, separately analyzing crash severity at each intersection type is needed. Furthermore, the factors that affect crash severity at high- and low-volume signalized and stop-controlled intersections are essential to know, to devise the essential countermeasures to alleviate the crash severity. To the author’s knowledge, no study has been conducted to-date to identify and compare the significant factors affecting crash severity at high- and low-volume signalized and stop-controlled intersections. However, few studies have investigated the crash frequencies and travel delays at both signalized and stop-controlled intersections (see for example, Liu (1979); Penmetsa and Pulugurtha (2017)). The main objective of this study is to identify and compare the significant factors that affect crash severity at high- and low-volume signalized and stop-controlled intersections. The study uses 5-year historical crashes in Alabama from 2010 to 2014. The factors considered in the study include roadway, geometric, traffic, vehicle, environmental, and driver characteristics which are deemed essential to investigate and compare crash severity at these intersection types with high- and low-volumes. The crash severity includes two levels; severe and non-severe. Severe crashes include fatalities and incapacitating (or serious) injuries. On the other hand, non-severe crashes include property damage only (PDO), possible injuries, and non-incapacitating injuries. To identify and compare the significant risk factors of crash severity at intersections types, the binary logit model is applied. In addition, one of the common variable screening methods, the random forest, is used to rank the importance of the independent variables explored in the study.
2. Literature Review
- This section reviews the most relevant studies which identified factors that affect crash severity at signalized and stop-controlled intersections. Researchers have adopted many statistical techniques to identify factors that affect crash severity. Among the various models, the binary logit model was widely used for identifying the factors that affect crash severity. For example, Wang and Abdel-Aty (2008) used the binary logit model while analyzing left turn crash severity and concluded that injury severity was higher when left turning vehicles collide with opposing through traffic. They found that driver attributes, vehicular characteristics, geometric design, and environmental factors were the significant variables that affect injury severity for left turn crashes. Al-Ghamdi (2002) also used the binary logit model to identify the factors that affect crash severity and concluded that location and crash type were the two key significant variables impacting the crash severity.Different independent variables were considered when analyzing crash severity. According to Dissanayake and Lu (2002), the driver’s use of alcohol or drugs, ejection from the vehicle in the crash, point of impact, existence of curve or grade at the crash location, and vehicle speed were determined as factors that increased the severity for young drivers. Savolainen and Mannering (2007) concluded that crashes were less severe under wet pavement conditions and near intersections, because of lower speeds maintained by drivers in those conditions. Kockelman and Kweon (2002) concluded that passenger cars are safer than pickups in single-vehicle crashes, while concluding the opposite for two-vehicle crashes. Duncan et al. (2002) identified that high speed, driving at night, female drivers, and driving under the influence increased the risk of severity. Nassar et al. (1994) developed severity models for bad weather conditions and concluded that drivers may be more attentive in inclement weather conditions. Zwerling et al. (2005) concluded that the total number of crashes, as well as crashes with fatalities or injuries were higher in rural areas compared to urban areas. Kim et.al (2013) found that the probability of fatal injury for drivers in single-vehicle crashes increased significantly compared to other crash types, e.g., multi-vehicle crashes.While focusing on signalized intersections, Huang et al. (2008) identified the factors that affected the driver injury severity and vehicle damage. They concluded that severity was lower for crashes that occurred in peak period and in good street lighting condition compared to crashes that occurred at night, T-intersections, vehicles traveling in the right-most lane, and for intersections equipped with red light running cameras. They also found that heavy vehicle drivers were less likely to be injured when compared with two-wheeler riders because of the better protection offer to the driver.Studies that analyzed severity at unsignalized intersections can also be found in the literature. Wang and Qin (2002) studied driver mistakes that occurred at uncontrolled, stop-controlled, and signalized intersections. Wang and Qin (2002) also identified potential countermeasures and concluded that running stop signs, high speed, driving under the influence (DUI) of alcohol or drugs, and poor visibility can be the causes of increased crash severity. As concluded from Devlin et al. (2011), running stop signs was the common error made drivers which increased injury severity. Haleem and Abdel-Aty (2010) studied the factors that relate to crash severity at unsignalized intersections using traffic volume, number of through lanes, geometric factors, shoulder width, number of left turn movements, number of left and right turn lanes on major approach, and driver age. From the abovementioned literature review, it can be concluded that no single study was conducted to compare the significant predictors of crash severity at high- and low-volumes at both signalized and stop-controlled intersections. This study attempts to fill this gap while considering various independent predictors. The detailed description of the data and variables considered is shown in the “Data and Variable Settings” section.
3. Data and Variable Settings
- In this study, five years of intersection-related crash data (2010 to 2014) in the state of Alabama were used. The data were extracted from the Critical Analysis Reporting Environment (CARE) database, which is maintained by the Center for Advanced Public Safety (CAPS). After exclusion of other intersections types, such as yield-controlled intersections and unknown intersection types, only crashes that occurred at signalized and stop-controlled intersections were considered. The total numbers of crashes were further categorized into four separate datasets, representing crashes at high-volume signalized, low-volume signalized, high-volume stop-controlled and low-volume stop-controlled intersections. In the analysis, the cut-off value for low traffic volume was less than or equal to a major-approach AADT (or intersection-entering vehicles) of 1,000 vehicles/day, whereas a major-approach AADT greater than 1,000 was considered high traffic volume. Note that due to data unavailability, the minor-approach AADT was not considered in the analysis. The major intersection approach represented the approach with greater number of lanes compared to the minor approach and that approach was usually a state-maintained roadway (for this, the AADT was available). On the other hand, the minor intersection approach represented the approach with less number of lanes compared to the major approach and that approach was mostly a local roadway (or a non-state-maintained roadway, where the AADT was mostly unavailable). The use of 1,000 vehicles/day as the cut-off value for separating high- and low-volumes has been also used in previous studies (see for example, the Cornell Local Roads Program (2017)). Close to twenty independent variables were considered. These variables include driver characteristics (driver age, driver gender, and driver condition), roadway characteristics (roadway type, speed limit, roadway condition, and terrain), land use (urban and rural), and environmental characteristics (e.g., weather and lighting conditions). As previously mentioned, four separate models (high-volume signalized, low-volume signalized, high-volume stop-controlled, and low-volume stop-controlled) were developed for comparing the significant factors contributing to crash injury severity. Twenty independent variables were included in all the four models (as shown in Tables 1 and 2). Descriptive statistics of the variables considered at high- and low-volume signalized intersections, and high- and low-volume stop-controlled intersections are shown in Tables 1 and 2, respectively. In this study, driver age is treated as a continuous independent variable. The AADT at the intersections is calculated by summing up the traffic volumes from both directions on the main road. As shown in Tables 1 and 2, the response (dependent) variable in the analysis was crash severity. The crash severity includes two levels; severe and non-severe. Severe crashes include fatalities and incapacitating (or serious) injuries. On the other hand, non-severe crashes include PDO, possible injuries, and non-incapacitating injuries.
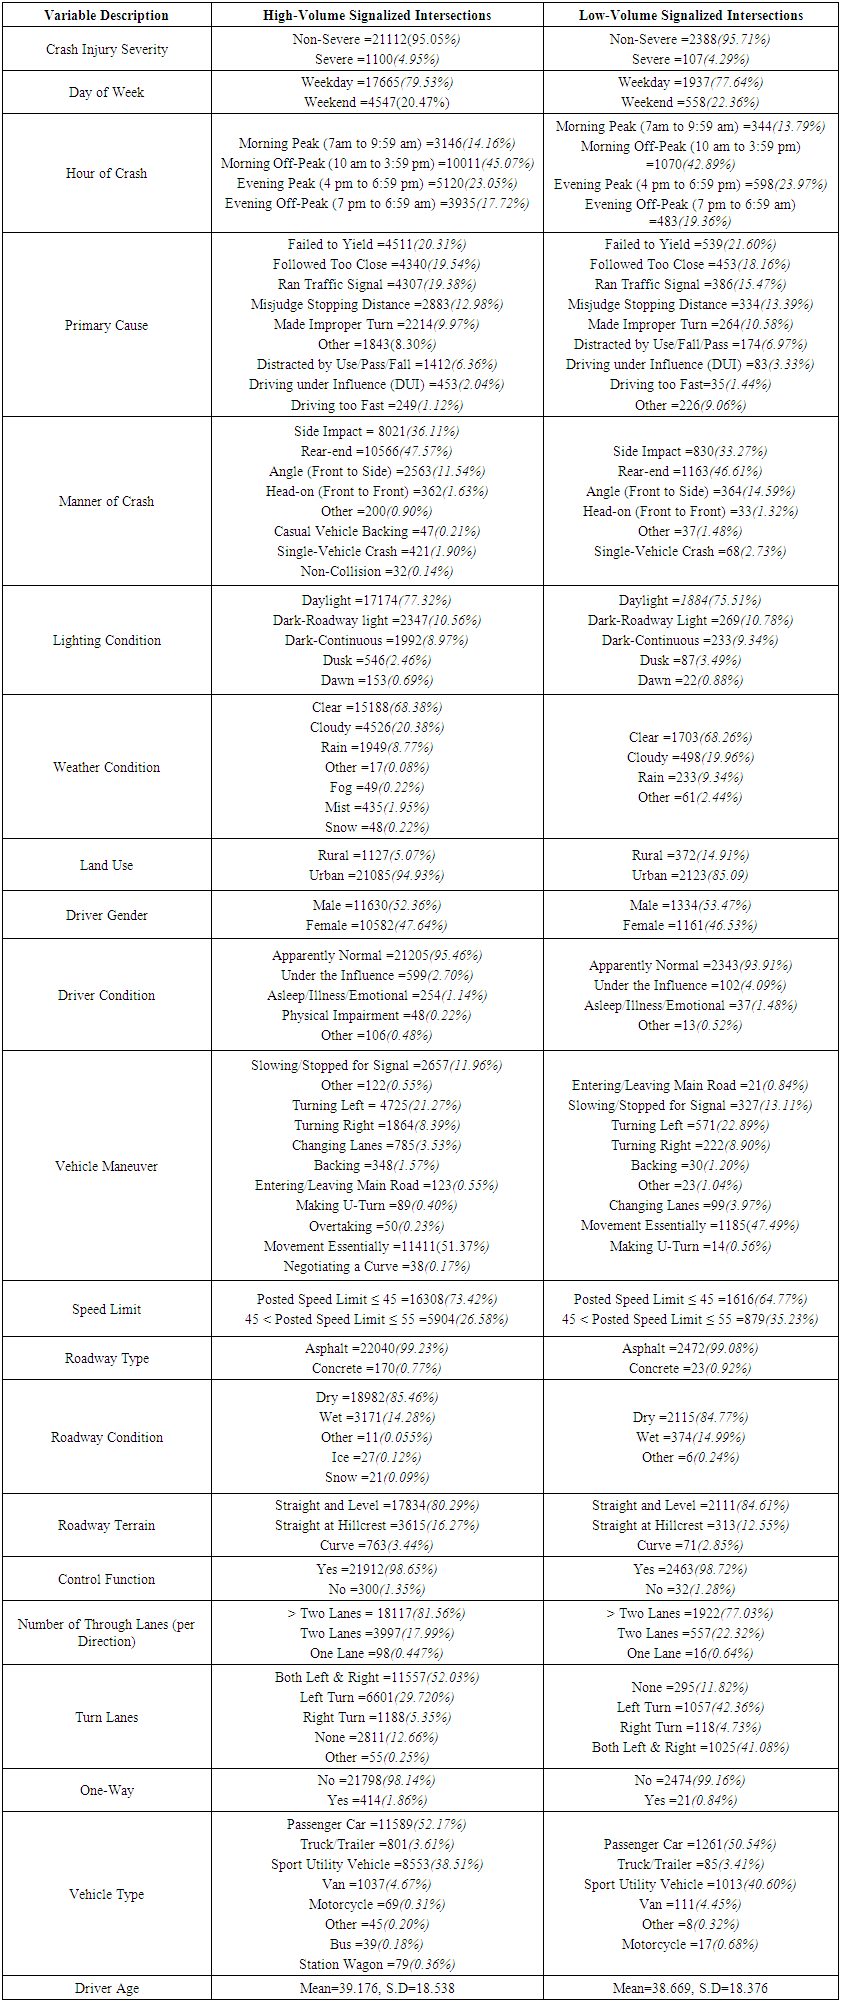 | Table 1. Descriptive Statistics of Variables at High- and Low-Volume Signalized Intersections |
 | Table 2. Descriptive Statistics of Variables at High- and Low-Volume Stop-Controlled Intersections |
4. Methodology
4.1. Binary Logit (Logistic Regression) Model
- The approach used in this paper to identify the significant predictors of injury severity was the logistic regression model (or logit model). The logistic regression determines the relationship between categorical dependent variables and one or more independent (categorical, continuous, or both categorical and continuous) variables. The response variable in logistic regression can be binary or dichotomous (see for example, Wang and Abdel-Aty (2008); Al-Ghamdi (2002)). Therefore, the response is dichotomous and it takes the values “zero” and “one”, representing “non-occurring” and “occurring” events, respectively (Chang and Yeh (2006)). If the dependent variable is categorized into more than two levels, then the multinomial logistic regression model can be applied (Shankar and Mannering (1996); Islam and Mannering (2006)). In this study, since fatalities were relatively few at the four different model types, fatalities were aggregated with incapacitating injuries to represent severe injuries. The other response level was non-severe injuries. For this the binary logit (logistic regression) model was applied in this study. The binary logistic regression equation takes the following form:
 | (1) |
 for the pair (xi, yi) is given below in Equation (2) (the logistic regression from Carnegie Mellon University (2017)):
 | (2) |
 (or “p(x)”) and the non-severe injury probability
  (or “1 – p(x)”) are estimated as shown in Equations (3) and (4) below (per Haleem (2016)):
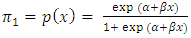 | (3) |
 | (4) |
4.2. Random Forest
- Random forest model was used in this study to rank the importance of variables. This was performed prior to binary logit model to find out the key variables, and then compare the final list of important variables with the final variables in each of the four binary logit models. Ho (1995) created the first algorithm of random decision forest, then it was developed by Breiman (2001) and is considered one of the promising machine learning techniques for screening important variables (see for example, Abdel-Aty and Haleem (2011); Haleem and Gan (2013)). In this technique, a number of trees are grown by selecting some observations randomly from the original data set with substitution, then searching over a randomly selected subset of variables at each split till the variable significant is ranked (Haleem and Gan (2013)). Several studies have used the random forest to analyze binary response variables (see for example, Harb et al. (2009); Sparks (2009)). To rank the variables, the Gini index was used in this study, which tests the homogeneity of the nodes and leaves (or the purity of the variables) in the resulting random forest model. A higher Gini index indicates a relatively important (or pure) variable, and vice-versa.
5. Results and Discussion
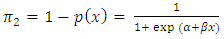
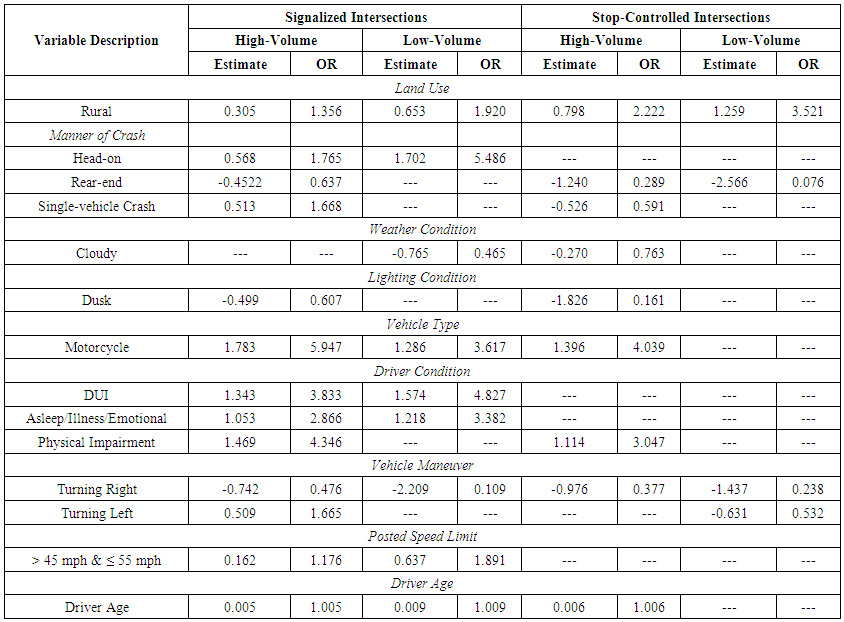
- The results of the four binary logit models for analyzing crash severity at both signalized and stop-controlled intersections with high- and low-volumes are shown in Tables 3 and 4, respectively. Table 3 shows the two binary logit models at signalized intersections with high- and low-volumes, while Table 4 shows the two models at stop-controlled intersections with high- and low-volumes. In both tables, only the significant variables are shown. The goodness-of-fit statistics (i.e., the AIC, Pseudo R2, and residual and null deviance estimates) are shown in all the four models towards the end of the tables.
5.1. Interpretation of the Binary Logit Models at High- and Low-Volume Signalized Intersections
- As shown in Table 3, rural areas in both types of signalized intersections had higher likelihood of severe crashes (β=0.305, OR=1.356 for high-volume and β=0.653, OR=1.920 for low-volume) compared to urban areas. This could be interpreted as drivers tempted to drive faster than the posted speed limit. Moreover, what might encourage speeding in rural areas is the lack of pedestrian activities compared to urban areas. These results are consistent with the findings of Zwerling et al. (2005). It is also observed that crash severity is 56.4% higher in low-volume signalized intersections compared to high-volume signalized intersections.
 | Table 3. Binary Logit Models at Signalized Intersection |
5.2. Interpretation of the Binary Logit Models at High- and Low-volumes of Stop-Controlled Intersections
- As shown in Table 4, at both types of stop-controlled intersections, crashes in rural areas (β=0.798, OR=2.222 for high-volume; β=1.259, OR=3.521 for low-volume) were more likely to result in an increased severity likelihood compared to urban areas. Similar to signalized intersections, low-volume stop-controlled intersections were associated with higher severity at rural areas. For the high-volume stop-controlled intersections model, running a stop sign (β=0.406, OR=1.501) was associated with higher severity likelihood compared to failing to yield at the intersection. These results are consistent with Devlin et al. (2011). Running a stop sign can cause an angular collision with other vehicles, which could possibly increase the likelihood of the injury severity for the drivers and accompanying passengers.
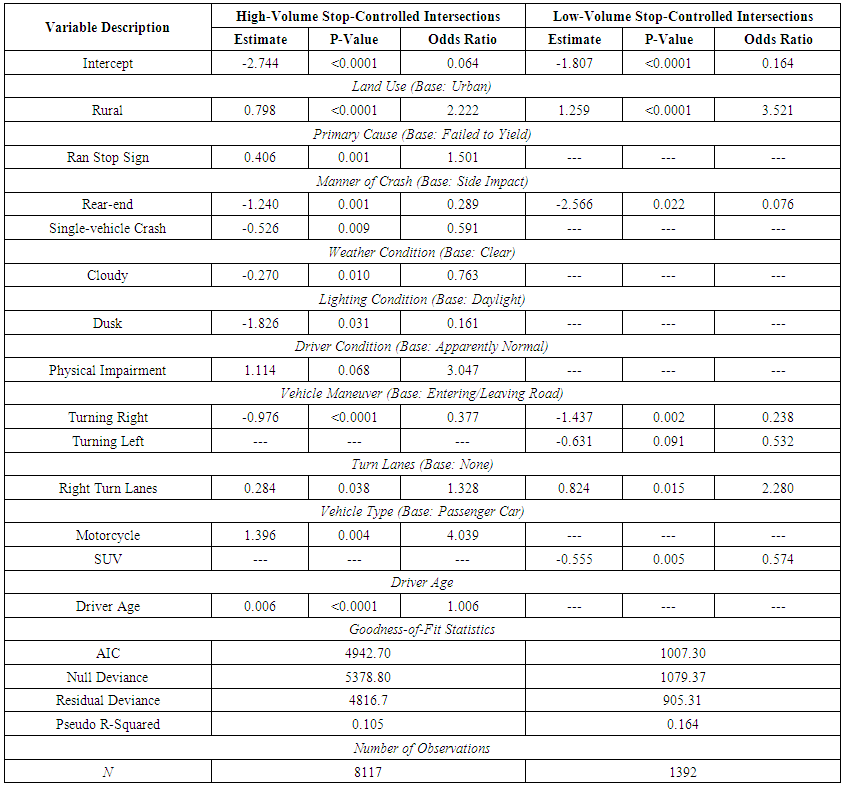 | Table 4. Binary Logit Models at Stop-Controlled Intersections |
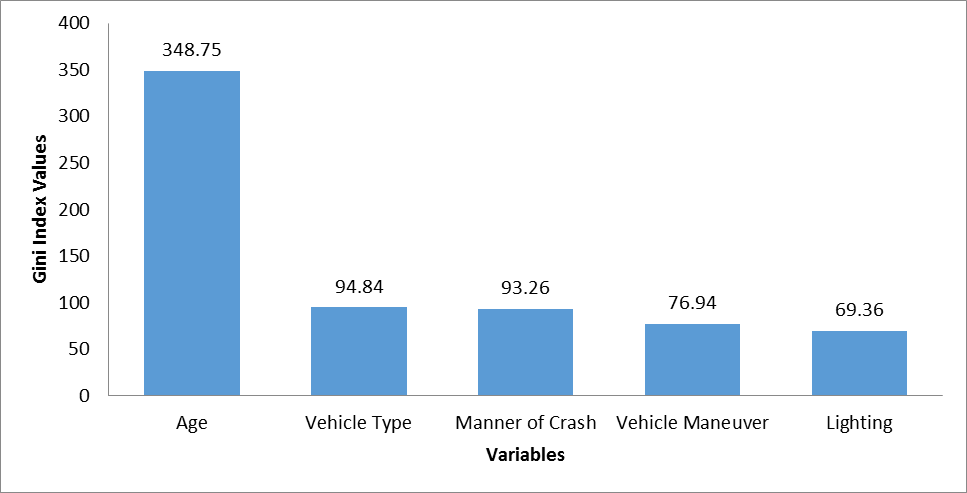
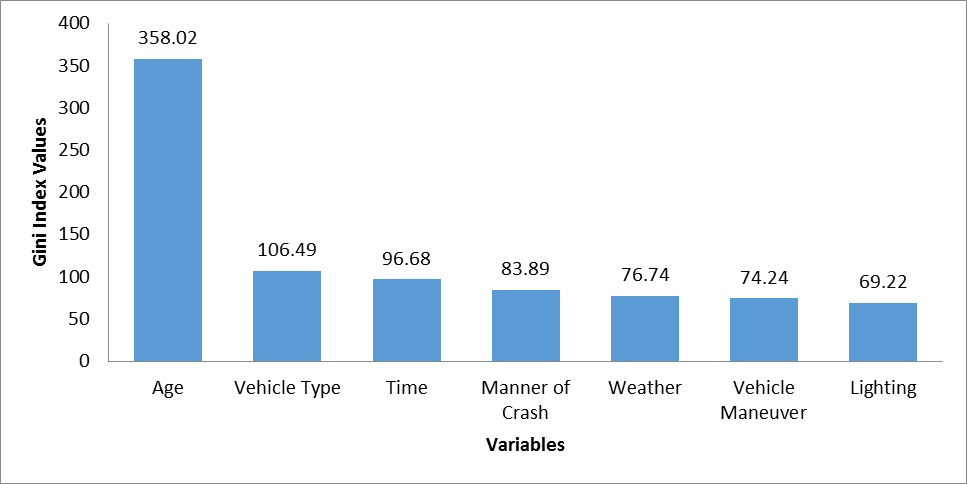
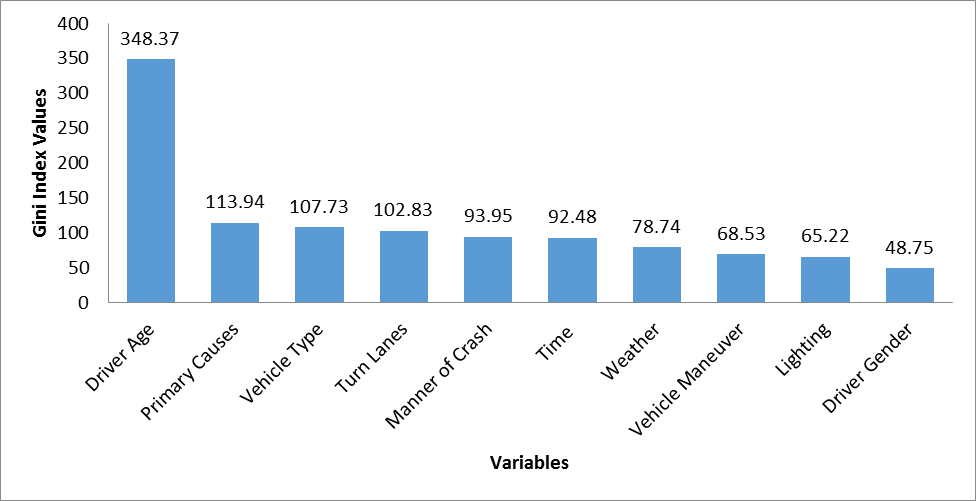
5.3. Variable Importance Analysis Using Random Forest
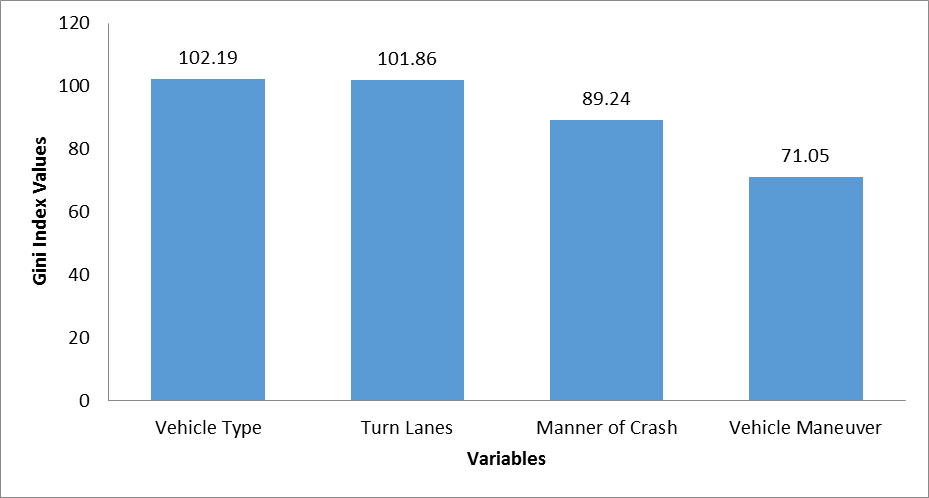
- The random forest technique was used in this study for ranking and screening of variables. The finally-screened variables were then compared with the significant variables from the fitted binary logit models (based on the P-value significance rather than the OR). Using the R package, a random forest model was fitted at each of the four intersection types. It was found that the top variables in the ranking list were mostly matching with the significant variables identified from the four binary logit models. When comparing Figure 1 with the left portion of Table 3, it is observed that all the five variables from the random forest technique were found significant in the binary logit model for high-volume signalized intersections. When comparing Figure 2 with the right portion of Table 3, it is observed that six out of seven variables from the random forest technique were found significant in the binary logit model for low-volume signalized intersections. Similarly, when comparing Figure 3 with the left portion of Table 4, it is observed that eight out of ten variables from the random forest list were found significant in the high-volume stop-controlled intersections model. Finally, when comparing Figure 4 with the right portion of Table 4, it is seen that three out of four variables from the random forest list were found significant in the low-volume stop-controlled intersections model. This evaluates and shows the importance of the resulted variables in each model in affecting the severity at the analyzed intersections. A random forest output for the four models are shown in Figures 1, 2, 3, and 4. These figures show the top ten variables ranked by the Gini index criterion. Among these top ten variables, many variables were found in the four binary logit models. The variables were the driver age, primary causes, vehicle type, lane turns, manner of crash, weather, vehicle maneuver, and lighting conditions.
 | Figure 1. Variable Ranking Using Random Forest Technique at High-Volume Signalized Intersections |
 | Figure 2. Variable Ranking Using Random Forest Technique at Low-Volume Signalized Intersections |
 | Figure 3. Variable Ranking Using Random Forest Technique at High-Volume Stop-Controlled Intersections |
 | Figure 4. Variable Ranking Using Random Forest Technique at Low-Volume Stop-Controlled Intersections |
5.4. Comparison of the Crash Severity Risk Factors at Intersections based on Traffic Volume
- This section emphasizes and compares the common significant variables resulted from the binary logit models at signalized and stop-controlled intersections. The common significant variables are shown in Table 5.There were nine common variables for at least two intersection types, as shown in Table 5. The common variables mentioned in the table were land use, manner of crash, weather condition, lighting condition, driver condition, vehicle maneuver, posted speed limit, and driver age. Rural areas in land use and turning right in vehicle maneuver were the only variables which showed significance in all the four models. Rural areas in all the four models showed higher likelihood of severity compared to their urban counterparts. The highest increase of severity was at low-volume stop-controlled intersections, followed by high-volume stop-controlled intersections, then low-volume signalized intersections, and finally high-volume signalized intersections. In general, drivers tend to drive with higher speeds in rural areas compared to urban areas. Regarding vehicle maneuver, turning right is associated with reduction of severity in all the four models, especially at stop-controlled intersections. Head-on collisions were associated with higher likelihood of severity at both types of signalized intersections. On the other hand, rear-end crashes were showed as reduction of crashes at both types of stop-controlled intersections and at high-volume signalized intersections. Single-vehicle crash type showed contrast results for high-volume signalized and high-volume stop-controlled intersections. This is because of the relatively lower speeds at stop-controlled intersections.Cloudy weather conditions were associated with lesser severity likelihood at low-volume signalized and high-volume stop-controlled intersections. A higher reduction was found at low-volume signalized intersections (53.5% reduction) compared to high-volume signalized intersections (23.7% reduction). The increase in traffic volume at these intersections was associated with a reduction in injury severity likelihood. Similarly, dusk condition showed lesser likelihood of severity at signalized and stop-controlled intersections with high traffic volumes. Motorcycles showed higher severity at signalized and high-volume stop-controlled intersections. The highest increase of severity was at high-volume signalized (494.7%), followed by high-volume stop-controlled (303.9%) and then low-volume signalized intersections (261.7%). As expected, all the significant variables in driver condition (DUI and asleep/illness and physical impairment) were associated with higher likelihood of crash severity. The left-turning maneuver at high-volume signalized intersections (OR=1.665) showed higher severity likelihood, and surprisingly it showed lesser severity likelihood at low-volume stop-controlled intersections. This could be the reason that drivers might be more cautious when performing left turns at stop-controlled intersections. As expected, higher speed limit roadways (> 45 mph & ≤ 55 mph) at signalized intersections experienced higher severity. Higher speed limits at low-volume signalized intersections showed higher severity likelihood (89.1%) compared to high-volume signalized intersections (17.6%). To show the impact of rural areas on crash severity at both signalized and stop-controlled intersections, Figure 5 is shown. This figure shows the percentage of severity (including both fatalities and severe injuries) at each intersection type. As shown, crashes at stop-controlled intersections in rural areas were associated with higher severity compared to signalized intersections in rural areas. Furthermore, low-volume intersections were associated with higher severity likelihood compared to high-volume intersections. These results concur with the OR interpretation in Table 5, where the OR for stop-controlled intersections were higher than that for signalized intersections.
 | Table 5. Common Significant Variables at the Different Intersection Types |
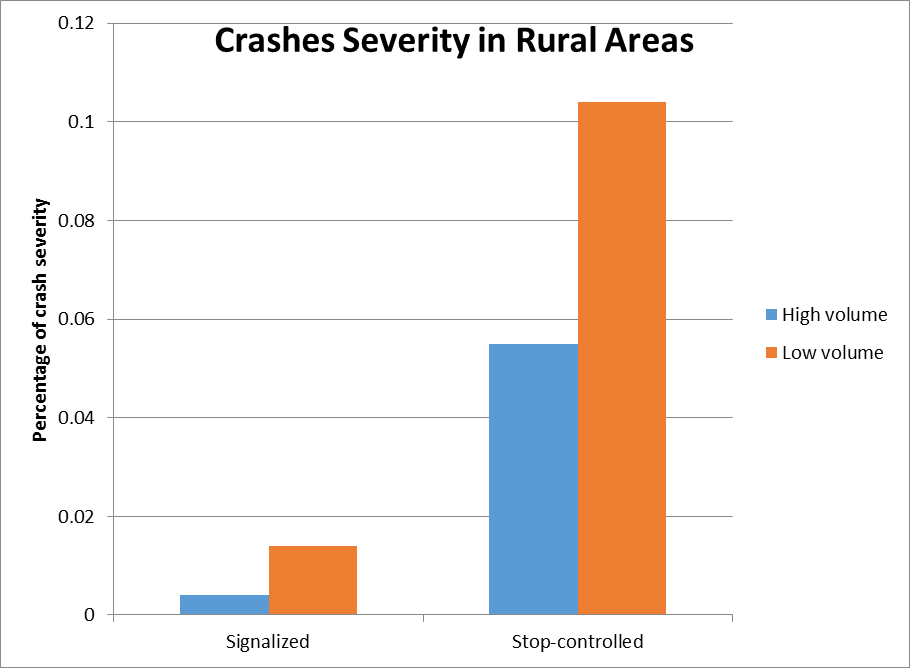 | Figure 5. Severity of Rural Areas at High- and Low-Volume Signalized and Stop-Controlled Intersect |
6. Conclusions and Study Applications
- This study identified and compared the factors that affect crash severity at high- and low-volumes signalized and stop-controlled intersections. The study used a list of variables related to roadway geometric characteristics, traffic characteristics, vehicle characteristics, driver characteristics, and environmental conditions. Four separate binary logits were fitted at high-volume signalized, low-volume signalized, high-volume stop-controlled, and low-volume stop-controlled intersections. Several significant variables were found in the final models. Besides the binary logit model, this study used the random forest technique to rank the importance of the variables. It was concluded that the binary logit model and random forest technique had several significant variables in common.In all the four models, rural areas experienced higher severity than urban areas. All the significant variables in driver conditions (DUI, asleep/illness, and physical impairment) showed higher crash severity likelihood at signalized and stop-controlled intersections. Rear-end crashes, cloudy weather condition, and dusk lighting condition showed lesser severity at signalized and stop-controlled intersections. Head-on crashes, single-vehicle crashes, turning left maneuver, and higher speed limits showed higher severity at signalized intersections. On the other hand, single-vehicle crash and turning left maneuver showed lesser severity at stop-controlled intersections. There were nine common variables for at least two intersection types. These common variables were land use, manner of crash, weather condition, lighting condition, driver condition, vehicle maneuver, posted speed limit, and driver age. It was concluded that cloudy weather was associated with lesser severity likelihood at low-volume signalized and high-volume stop-controlled intersections. However, a higher reduction was found at low-volume signalized intersections compared to high-volume stop-controlled intersections. Driver age at both types of signalized intersections and high-volume stop-controlled intersections was found to be associated with higher crash injury severity likelihood.Based on the above-mentioned findings, some recommendations can be proposed to alleviate injury severity at intersections. Since the left-turning maneuver showed higher injury severity likelihood at high-volume signalized intersections, providing enough sight distance and protected left turn phase (with no permitted phase) in busy areas can be suggested. Since crashes in rural areas at signalized and stop-controlled intersections were associated with higher severity, installation of warning signs that discourage speeding is suggested and higher police patrolling activities can be suggested at those locations. In addition, enforcement and education countermeasures can be suggested. For example, enforcing non-speeding by law enforcement officers at signalized and stop-controlled intersections is essential since higher speed limits were associated with increased injury severity likelihood. Education programs can be performed for drivers to educate them not to operate the vehicle if having unfavorable physical conditions since these conditions were associated with higher crash injury severity likelihood. Similarly, education programs should be designed disseminating the dangerous effect of DUI on crash severity, especially at low-volume signalized intersections. This can also imply more enforcement of DUI drivers at signalized intersections, particularly those with relatively low traffic volume. Future research can consider the minor-approach traffic volume at both types of intersections when investigating the crash severity. In this study, the minor-approach AADT was unavailable since the minor approaches were mostly located on local (non-state) roads. Considering both major and minor traffic volumes for intersections might better explain the significance of some of the variables.
ACKNOWLEDGMENTS
- The authors would like to thank the Alabama Department of Transportation (ALDOT) for providing the traffic volume data at the intersections used in this study.