-
Paper Information
- Paper Submission
-
Journal Information
- About This Journal
- Editorial Board
- Current Issue
- Archive
- Author Guidelines
- Contact Us
International Journal of Statistics and Applications
p-ISSN: 2168-5193 e-ISSN: 2168-5215
2018; 8(3): 129-132
doi:10.5923/j.statistics.20180803.03

Parametric Survival Models for Predicting of Pregnancy in Friesian Cattle
 Abstract
 Reference
 Full-Text PDF
 Full-text HTML
Fatma D. M. Abdallah1, Eman A. Abo Elfadl2
1Department of Animal Wealth Development, Faculty of Veterinary Medicine, Zagazig University, Egypt
2Department of Animal Husbandry and Development of Animal Wealth, Faculty of Veterinary Medicine, Mansoura University, Egypt
Correspondence to: Eman A. Abo Elfadl, Department of Animal Husbandry and Development of Animal Wealth, Faculty of Veterinary Medicine, Mansoura University, Egypt.
| Email: |  |
Copyright © 2018 The Author(s). Published by Scientific & Academic Publishing.
This work is licensed under the Creative Commons Attribution International License (CC BY).
http://creativecommons.org/licenses/by/4.0/

Background & objectives: This work was performed to apply different parametric survival models instead of nonparametric ones for predicting pregnancy in Friesian dairy cattle by using days open as a time variable. The models used were exponential, normal, log-normal, Weibull, logistic, log logistic and smallest extreme value. Data for present study were obtained from animal records belongs to different Dakhalia farms (n = 1842) Covering the period between 2009 and 2011. Variables included in this study were days open as a dependent variable and the independent variables were: age at calving, dry period, calving interval, season, and lactation order. The survival time data were modeled by using life data regression procedure of Statgraphics statistical package program. Model parameters were estimated and comparisons among models were done based on Akaike Information Criterion (AIC). The Weibull model was the best option for evaluating time till occurrence of pregnancy where it had the smallest (AIC) value. It also showed a good fit with the studied data. This Weibull survival model can be used to predict the length of time from calving to conception in Friesian. But the Logistic was not appropriate to describe the dataset.
Keywords: Days open, Survival analysis, Parametric models, Censored data and Akaike Information Criterion (AIC)
Cite this paper: Fatma D. M. Abdallah, Eman A. Abo Elfadl, Parametric Survival Models for Predicting of Pregnancy in Friesian Cattle, International Journal of Statistics and Applications, Vol. 8 No. 3, 2018, pp. 129-132. doi: 10.5923/j.statistics.20180803.03.
Article Outline
1. Introduction
- There are many factors influencing the fertility in dairy cattle. Days open is one of these factors which play an important role in reproductive and productive efficiency of individual cows (Arthur et al., 2001). Days open is the number of days between the most recent calving and conception (calving conception interval). Standard statistical techniques such as multivariable regression analyses used to describe and quantify the effect of factors influencing days open in dairy cattle. Survival analysis is an important area in statistics as it gives a number of advantages over other regression techniques that it can solve the problem of censored observations (Kleinbaum and Klein, 2005). Censoring means that the animal does not achieve the expected event during the study period. Datasets in survival analysis are usually non-negative, continuous and its specific survival function. A survival function can be detected by adjusting parametric models, which is usually nonlinear models, instead of the usual non-parametric (Kaplan-Meier) and Cox proportional hazard model which is a semi-parametric (Colosimo and Giolo, 2006).The use of censored data provides less biased estimates for factors affecting reproductive performance (Del et al., 2005; Del et al., 2006) and for this reason, survival analysis is the recommended method for analysis of dairy cow reproductive data.Since survival data are usually asymmetric, the assumption of normality of the data is not essential. Therefore, exponential, normal, log-normal, Weibull, logistic and log logistic distributions are generally used for these data (Collet and Kimber, 2011).
2. Material and Methods
- Data for present study were obtained from animal records belongs to different Dakhalia farms (n = 1842) Covering the period between 2009 and 2011. The data set were fitted to different survival parametric models. The animals which became pregnant at the study period are considered complete data.The following categories of records were considered as censored data:Ÿ Cows still non pregnant at the end of the study period;Ÿ Cows sold to anther herd.Ÿ Cows culled from the herd throughout the breeding period for reasons apart from reproductive failure.Ÿ Cows with days open, or interval between last calving and the end of data, longer the study period were considered censored (Roxstrom et al., 2003).Variables under study were days open is a dependent variable. Season of calving (categorical independent variable) is coded as (1) in case of summer season and (summer season is omitted) and (2) in case of winter season. Calving interval, previous dry period and age at calving are continuous independent variables. Lactation order (categorical independent variable) is coded as: lactation order 1= (1), lactation orders 2 = (2), lactation order 3 = (3), lactation order 4 = (4) and lactation order 5 and over = (5). (Lactation order 5 and over is omitted as a reference group).
2.1. Statistical Data Analysis
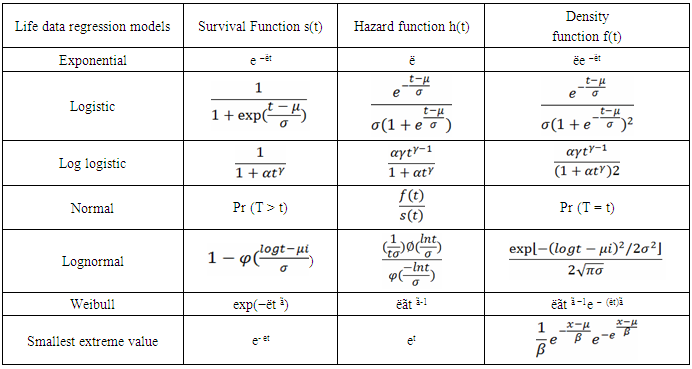
- Multivariate regression or parametric survival analysis was performed using several survival modeling methods. Several accelerated failure time parametric models are exponential, normal, log-normal, Weibull, logistic, log logistic and smallest extreme value distributions. All survival models were constructed using life data regression procedure of Statgraphics statistical package program (Statgraphics, 2015). Estimates for the parameters from different models fits estimated by using maximum likelihood and comparisons among different models were done by using Akaike information criterion (AIC) (Akaike, 1974). Lower AIC values indicate a better model fit. The formula for AIC is:AIC = -2 log L + 2kwhere log L is the log likelihood of the proposed model, and k is the number of model parameters.As it is known that the core of survival analysis is survival and hazard functions. These functions are used in the process of prediction of the event under study.Survival function, density function and hazard function for different parametric models were shown in Table (1) as they are the core of survival analysis.
|
2.1.1. Parametric Survival Model
- The parametric regression model can also be used to test the relationship between the time variable (days open) and the explanatory variables. Generally any distribution defined for t ∈[0,∞] can be treated as a survival distribution. Through a logarithm transform we get log (t) ∈(−∞,+∞) which is more suitable for modeling. For example, a Weibull distribution which is most commonly used in survival analysis. The general regression model is given below (Rodriguez, 2005).
 Where 𝛼 = −log (h(𝑡)) has a specific distribution.For Weibull distribution,
 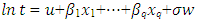 Where, X1,…, are explanatory variables B1,…, are regression coefficients σ is a scale parameter W has the extreme value distribution U is an interceptThe regression parameters will be used to interpret the direction and strength of the relationship of each explanatory on the effect of the survival time. Positive value of Bp is indicative of increased survival.
3. Results
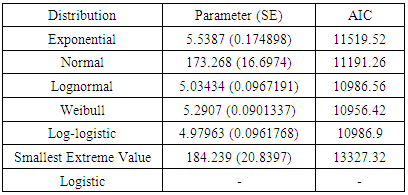
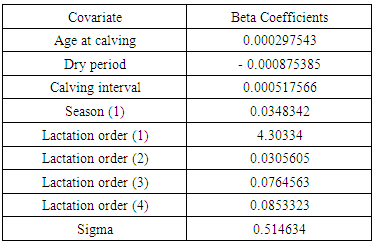
- A total of 1842 animals divided into 854 uncensored values with percent 46.36% (pregnant animals) and 988 censored values with percent 53.64% (non-pregnant).After constructing different types of parametric survival models Weibull, normal, exponential, logistic, log-logistic, lognormal and smallest extreme value and compared their AIC (Table 2) to determine the best fit model. The Weibull model had the lowest AIC which is (10956.42) in days open dataset, indicating a better overall fit than the other models with parameters 5.2907(0.0901337). The Logistic was not appropriate to describe the dataset.The parameters from different model fits are displayed in Table (2). Positive value of
 is indicative of increased survival (increasing the event occurrence). The Akaike Informational Criterion (AIC) is also provided at this table.
|
|
4. Conclusions
- The parametric survival models can be used to model dairy data as it deals with censored values. The AIC is used to evaluate model performance, as this is one of the most widely used metrics. The Weibull model demonstrated the best performance compared to other parametric models so its equation is used in predicting process of the event under study. The Logistic was not appropriate to describe the dataset. Finally, this model is good for prediction process of all events belonged to dairy farms depending on the variables affecting these events.