International Journal of Statistics and Applications

p-ISSN: 2168-5193    e-ISSN: 2168-5215

2018;  8(2): 35-41

doi:10.5923/j.statistics.20180802.01


Binary Probit Crash Analysis for Various Curve and Grade Conditions

Mehrnaz Doustmohammadi 1, Michael Anderson 2

1Research Scientist, Civil Engineering, University of Alabama in Huntsville, Huntsville, 35899, United States

2Professor, Civil Engineering, University of Alabama in Huntsville, Huntsville, 35899, United States

Correspondence to: Mehrnaz Doustmohammadi , Research Scientist, Civil Engineering, University of Alabama in Huntsville, Huntsville, 35899, United States.

Email:

This work is licensed under the Creative Commons Attribution International License (CC BY).
http://creativecommons.org/licenses/by/4.0/

Abstract

Traffic crashes occur at different rates depending on several geometric conditions and actions of the drivers. Hills and curves have different crash rates and severities that level and straight segments of roadway. This paper presents data that were collected and analyzed using a binary probit model to determine the characteristics associated with higher crash severity of different grades (level, upgrade and downgrade) along with curve conditions (straight, turning left and turning right). Additionally, the paper continues the use of the binary probit model to analyze specific aspects that lead to run off the road crashes. The models developed in this research show that crash severity and run off the road crashes are often due to driver operating characteristics and not environmental or roadway factors. The application of the binary probit model demonstrates a convenient tool to analyze a large number of variables containing categorical crash data.

Keywords: Binary Probit, Crash Modeling, Geometric Conditions

Cite this paper: Mehrnaz Doustmohammadi , Michael Anderson , Binary Probit Crash Analysis for Various Curve and Grade Conditions, International Journal of Statistics and Applications, Vol. 8 No. 2, 2018, pp. 35-41. doi: 10.5923/j.statistics.20180802.01.

1. Introduction and Background

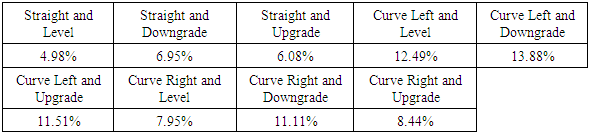
Traffic crashes have various causes ranging from environmental issues, driver ability levels, overall distractions, sight distance limitations, to basic roadway geometrics. Regarding roadway geometrics, crash data collected from Alabama between 2010 and 2014 show that straight horizontal alignment with a level grade is the safest driving environment with respect to severe crashes, essentially those crashes that result in an incapacitating injury or fatality, with less than 5 percent of the crashes that occur on these roadway segments resulting in a severe crash [1]. Contrarily, of the crashes that occur on roadway segments that curve to the left on a downgrade, almost 14 percent of crashes result in severe crashes [1]. For comparison purposes, 11 percent of the crashes on roadways curving right and downgrade were classified as severe [1]. Table 1 contains the percent of severe crashes of all crashes that occur on the particular horizontal alignment and grade.
Table 1. Percent of Severe Crashes in Alabama between 2010 and 2014
     
Previous crash studies have been developed indicating that roadway geometric condition is an explanatory variable when considering crashes. Al-Deek et al. studied crashes along an interstate corridor and found the crashes on upgrade sections were greater than downgrade or level sections [2]. A study in Virginia concluded that speed and traffic flow were more important than roadway grade [3]. Other studies focused on continuous grade roadway segments and determined that steeper grades were associated with increases in crashes; however, the surrounding environment was a contributing factor to the number of crashes [4-9]. Additionally, horizontal curves have been identified as a contributing increases in crashes [10-14]. A recent study on curvature concluded that horizontal curves have a significant impact on crash occurrences [15]. The combination of grade and curvature was studied by Bauer to identify crash modification factors [16] while other studies focused on age and grade as they related to crashes [17, 18].
This paper presents the factors that impact crash severity on specific roadway grade and curvature segments within Alabama. Within the paper, a binary probit model is used to statistically analyze the crash data collected with respect to several key variables including: time of day, primary contributing circumstance, distracted driving, manner of crash, lighting, weather, land use, driver age, driver condition, speed limit, roadway condition and material in the roadway. The paper presents the statistical results of the analysis and interprets the data to identify which conditions and variable tend to lead to increase crash severity of curve and grade segments. The paper continues to use the binary probit model to analyze run off the road crashes to determine specific factors that cause drivers to leave the roadways. The results from the study show that driver operating characteristics are the key element to determine the severity and number of run off the road crashes. The paper concludes that the use of the binary probit model is a convenient tool to study crashes from a collection of categorical data.

2. Model Description

A Binary Probit model is used in this paper. The use of probit modeling for crash analysis is common in the recent literature and several studies have provided examples and demonstrated use of the model for crash analysis [19-24]. The goal of the probit model is to model a series of observations of possible outcomes, severe and not severe, based on a collection of observed data values that are intended to relate the outcome [25, 26]. The definitions of the variables Y and X are as follows:
• Let Y, for any subset i, be a binary response variable such that Yi = 1 if the trait is present in observation and Yi = 0 if the trait is not present in observation.
• Let X = (X1, X2, ..., Xk) be a set of explanatory variables which can be discrete, continuous, or a combination. xi is the observed value of the explanatory variables for observation.
For our analysis, the response variable will be Yi = 1 when a crash with a certain severity is observed and Yi = 0 if the alternate severity is recorded. The explanatory variables X1, X2, ..., Xk will be collected from the crash analysis database as an attempt to define the dependent variable.
In the model, let i be the individual driver and K indicate the severity of crash, either K=0 for non-severe and K=1 for severe. The individual variables that relate to the outcome being severe or not severe are associated with environmental and driver and infrastructure factors present at the time, location and characteristics of those involved in the crash.
The model specifically takes the form Pr(Y=1|X) = Φ(XTβ) where Pr is the probability and Φ is the Cumulative Distribution Function of the standard normal distribution. The parameters of the model, β, are estimated by maximum likelihood.
The model is often depicted using a latent variable model where the likelihood of a severe injury or fatality occurring as a result from an individual crash, yi*, is associated with a collection of variables and parameters that are compared with a threshold value Ψ such that:
• Yi = 0 if yi*<Ψ, the crash is not severe
Or
• Yi=1 if yi*>Ψ, the crash is severe
where Ψ=(XTβ).
The maximum likelihood estimation is developed using the equation:
(1)
where the estimator of β maximizes this function.
The implementation of the model is implemented using IMB SPSS Statistics 24.

3. Data Collection

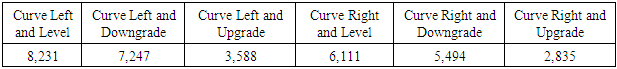
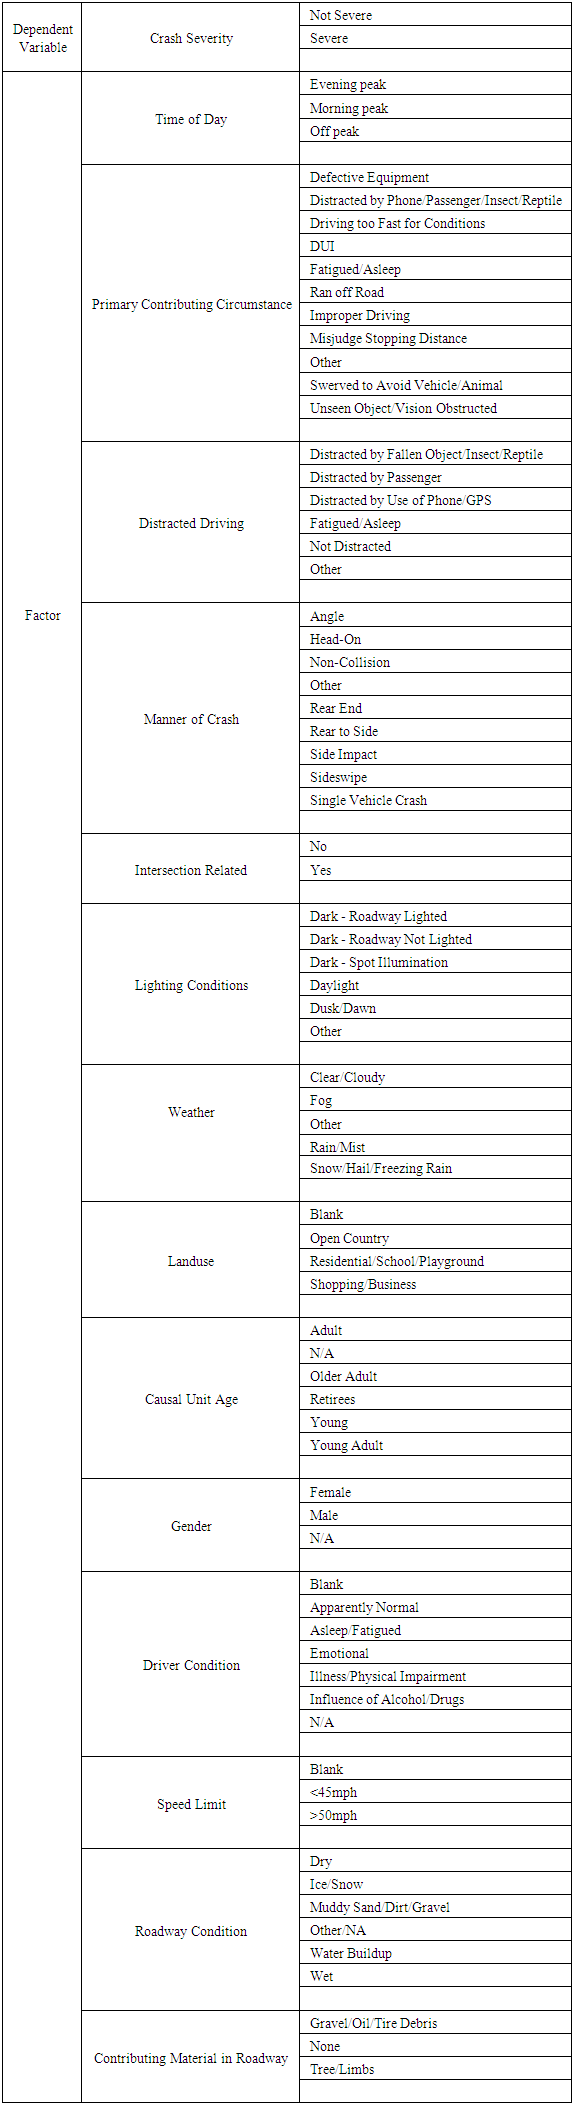
The data used in this analysis were extracted from the Critical Analysis Reporting Environment (CARE) maintained by the Center for Advance Public Safety at the University of Alabama (1a). Data were separated by horizontal curvature movement (left or right) and vertical alignment (level, upgrade or downgrade). There were six unique datasets developed for which the crash models were developed. The number of data variables that are available for each of the six categories is shown in Table 2.
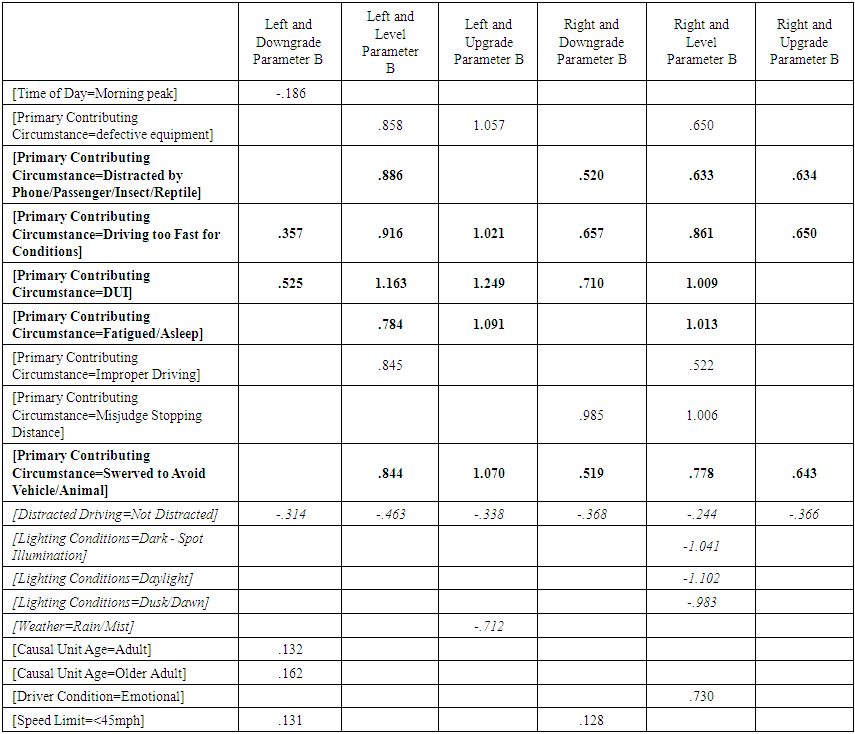
Table 2. Number of Crashes from Each Category
     
The variables and possible values of the variables that were used in the analysis are presented in Table 3.
Table 3. Variables Used in the Analysis
     

4. Model Results

The model generates parameter estimates for the variables to best match the actual number of severe and non-severe crashes at the different curve and grades. The parameters can be used to determine the direction of the variable as to the respect of the increase or decrease in the severity of crashes. The parameters indicated the probability executed increase with a one unit increase in the dependent variable [27, 28]. Table 4 presents the parameter estimates for the six categories; note that only the significant variables are displayed in the table.
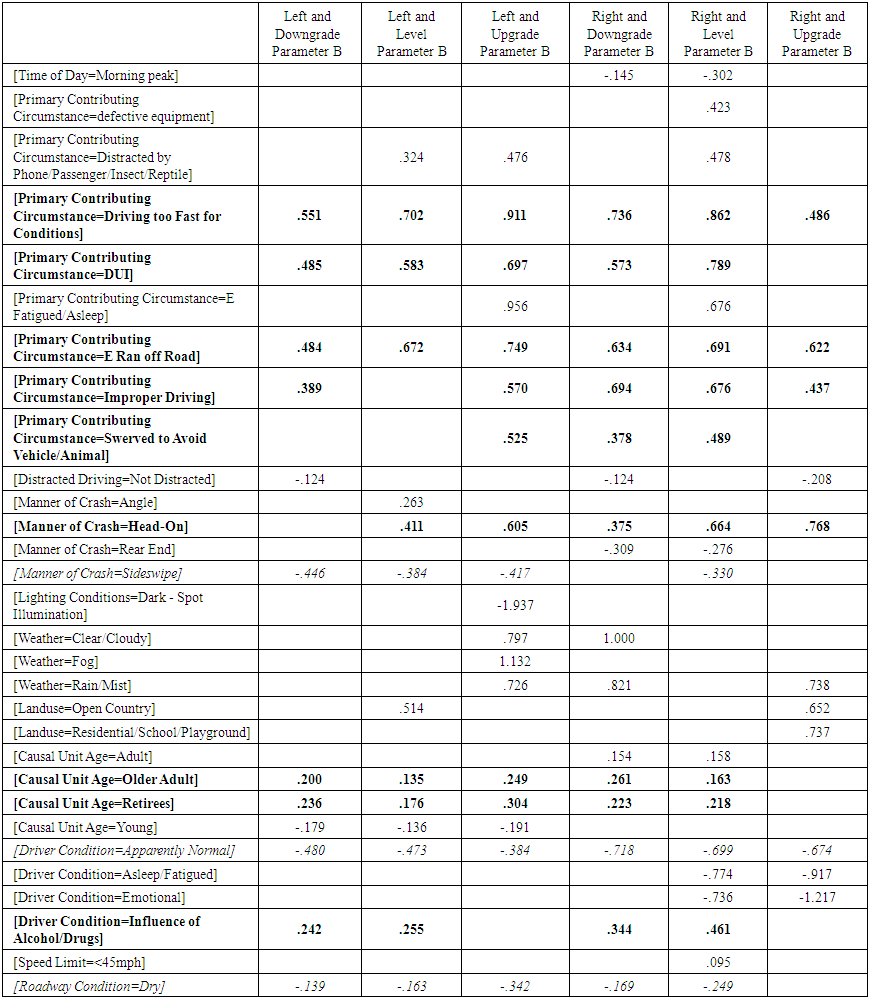
Table 4. Parameters Estimates for the Models
From Table 4, some elements that tended to reduce the likelihood of a severe crash on different grades and curvatures were driving when not distracted, having a sideswipe crash, driving under normal operating condition (no apparent distress to the driver), being a younger driver and driving in dry conditions. Driving while not distracted and under norm al operating condition tended to reduce the severity, presumably due to awareness and driving in a manner that the operation was more in control of the vehicle, and although a crash occurred, the crash could be minimized and the severity lessened as a result. This also makes sense for sideswipe crashes as these crashes tend to be less severe than other types of crashes. Finally, driving under dry pavement conditions helped the driver be aware and control the vehicle to lessen the severity of the crash. Interestingly, drivers who were turning right on both level and upgrade segments, drivers who were fatigued and emotional tended to have less severe crashes as did drivers during the morning peak who were turning to the right and on level of downgrade segments.
Some key elements that increase severity on all the roadways geometrics and grades from the primary contributing circumstances include driving too fast for conditions, driving under the influence, running off the road, improper driving and swerving to avoid vehicle or animal. In all these situations, the driver actions indicate a lack of focus or panic maneuver, which tend to lead to higher severity crashes due to the nature of the suddenness and lack of plan to minimize the crash impacts. Similarly, driving under the influence of drugs or alcohol also tended to increase the severity of crashes for most segments, with the exception of driving on an upgrade, which might have led to a lower speed from the operator at the time of the crash. Not surprisingly, head-on crashes tended to have higher severity. For the particular driver, older drivers and retirees tended to have higher severity crashes. This could be a result of the age of the driver more than the geometric characteristics.
In reviewing the data, the specific contributing circumstance of running off the road was nearly the highest factor that led to increased crash severity for each of the curve and grade classifications. This type of crash will be further analyzed to determine factors that tended to increase this particular type of crash to determine if these crashes can be reduced, which would provide an overall improvement in crash severity levels.

5. Run off the Road Model

The paper continues to analyze the crashes associated with roadway grade and curvature specifically examining run off the road crashes. The importance of these crashes is evident from the statistic that 59 percent of all motor vehicle fatalities are run off the road crashes [29, 30]. The analysis of run off the road crashes has been studied recently by Gong who developed mixed logit models using driver age to test the crash severity [31, 32]. Additionally, the review of counter-measures for run off the road crashes has been modeled [33-38].
A binary probit model was developed for each roadway curvature and grade condition with the response variable being a run off the road crash or another type of crash and the independent variable previous defined, with the inclusion of a severity variable defined as severe and not severe. The significant parameters for each of the variables in each of the categories are shown in Table 5.
Table 5. Parameters Estimates for the Run Off the Road Models
Examining Table 5, the results from the analysis indicate that run off the road crashes are almost always caused by driver error, with limited impact of the environment or traffic control conditions. The most common method to limit a run off the road crash was determined to be to not drive distracted. For drivers turning right on level conditions, the addition of roadway lighting or driving during daylight hours significantly reduced the likelihood of a run off the road crashes. Interestingly, the presence of rain and mist actually lead to a decrease in run off the road crashes for drivers turning left and going uphill.
The increases in run off the road crashes, as mentioned, were often related to driver actions and aggressive operating. Driving while distracted or in a fatigued state or under the influence of drugs or alcohol significantly increased the number of run off the road crashes. With the high severity rate for this crash type, educational campaigns directed at reducing poor driving as well increased enforcement are recommended to reduce these crashes. An aggressive driving action, driving too fast for conditions, significantly leads to a greater number of run off the road crashes. Again, this crash can be reduced through increase education and enforcement.

6. Conclusions

This paper examined the crashes that occurred at multiple levels of curvature and grade conditions. The severity of crashes for all roadway grade and curve conditions was reduced by driving in dry condition and staying alert. The statistics also show that younger driver tend to have fewer severe crashes, while this might be attributed to younger drivers being less likely to admit to injuries more than younger drivers being more cautious while driving. Driving too fast, under the influence and distracted were key elements that tended to lead to increases in severity of crashes. Also, drivers who were older were shown to have increased severity on crashes occurring on all turning movement conditions, regardless of whether the roadway was level, traveling uphill or downhill. Specifically for run off the road crashes, the presence of an alert driver with lighting in specific situations can greatly reduce the number of these crashes. Other actions that can possibly reduce the number of run off the road crashes include education and enforcement with respect to aggressive, distracted and impaired driving.
The contribution of the paper is the use of the binary probit modeling procedure to determine the statistical impact of categorical data on severity and for run off the road crashes. This methodology of crash analysis has not been observed in the literature; therefore this paper is a first attempt to demonstrate the ability of the model. The benefit of this modeling process is the ability to determine the contribution of a large number of categorical data. The parameter estimates are shown to provide a straight-forward means to determine which variables have an increase in the number of crashes or in the severity of crashes. While the parameters represent probability of increases, the sign of the parameters provides a quick methodology to determine the increase or decrease and the magnitude of the parameter provides an easy reference point to determine which factors have the greatest impact.

References

[1]  CARE Data from the Center for Advanced Public Safety. University of Alabama.
[2]  Al-Deek, H. M., S. S. Ishak, and A. A. Khan. “Impact of freeway geometric and incident characteristics on incident detection”. Journal of Transportation Engineering, Vol. 122, No. 6, 996, pp. 440-446.
[3]  Garber, N, and A. Ehrhart. “Effect of speed, flow, and geometric characteristics on crash frequency for two-lane highways”. Transportation Research Record: Journal of the Transportation Research Board, No. 1717, 2000, pp. 76-83.
[4]  Shankar, V, F. Mannering, and W. Barfield. “Effect of roadway geometrics and environmental factors on rural freeway accident frequencies”. Accident Analysis & Prevention, Vol. 27, No. 3, 995, pp. 371-389.
[5]  Lao, Y., G. Zhang, Y. Wang, and J. Milton. “Generalized nonlinear models for rear-end crash risk analysis”. Accident Analysis & Prevention, Vol. 62, 2014, pp. 9-16.
[6]  Li, Zhibin, et al. “Evaluating the Correlation between Vertical Curve Features and Crash Rates on Highways”. No. 17-06725. Transportation Research Board Annual Meeting. 2017.
[7]  Zador, Paul, et al. "Relationships between vertical and horizontal roadway alignments and the incidence of fatal rollover crashes in New Mexico and Georgia." Transportation Research Record 1111 (1987).
[8]  Daniel, Janice, Chuck Tsai, and Steven Chien. "Factors in truck crashes on roadways with intersections." Transportation Research Record: Journal of the Transportation Research Board 1818 (2002): 54-59.
[9]  Misener, James, et al. "Emergence of a cognitive car-following driver model: application to rear-end crashes with a stopped lead vehicle." Transportation Research Record: Journal of the Transportation Research Board 1724 (2000): 29-38.
[10]  Torbic, D. J., D. W. Harwood, D. K. Gilmore, R. Pfefer, T. R. Neuman, K. L. Slack, and K. K. Hardy. “A Guide for Reducing Collisions on Horizontal Curves”, Transportation Research Board, 2004.
[11]  FHWA. Traffic Safety Facts 2014 Data. https://crashstats.nhtsa.dot.gov/Api/Public/ViewPublication/812261. Accessed October 31, 2016.
[12]  Harwood, D., F. M. Council, E. Hauer, W. E. Hughes, and A. Vogt. “Prediction of the Expected Safety Performance of Rural Two-Lane Highways”, Midwest Research Institute, McLean, Virginia, 2000.
[13]  Zegeer, C. V., J. R. Stewart, F. M. Council, and D. W. Reinfurt. “Safety Effects of Geometric Improvements on Horizontal Curves”. Report UNC-HSRC-91, University of North Carolina, Chapel Hill, NC, 1991.
[14]  Hauer, E. Cause, Effect and Regression in Road Safety: A Case Study. Accident Analysis & Prevention, Vol. 42, No. 4, 2010, pp. 1128-1135.
[15]  Wu, Lingtao, Dominique Lord, and S. Geedipally. "Developing Crash Modification Factors for Horizontal Curves on Rural Two-Lane Undivided Highways using a Cross-Sectional Study." No. 17-0498. Transportation Research Board Annual Meeting. 2016.
[16]  Bauer, Karin, and Douglas Harwood. "Safety effects of horizontal curve and grade combinations on rural two-lane highways." Transportation Research Record: Journal of the Transportation Research Board 2398 (2013): 37-49.
[17]  McGwin Jr, Gerald, and David B. Brown. "Characteristics of traffic crashes among young, middle-aged, and older drivers." Accident Analysis & Prevention 31.3 (1999): 181-198.
[18]  Dissanayake, Sunanda, and Jian John Lu. "Factors influential in making an injury severity difference to older drivers involved in fixed object–passenger car crashes." Accident Analysis & Prevention 34.5 (2002): 609-618.
[19]  Duncan, Chandler, Asad Khattak, and Forrest Council. "Applying the ordered probit model to injury severity in truck-passenger car rear-end collisions." Transportation Research Record: Journal of the Transportation Research Board 1635 (1998): 63-71.
[20]  Ye, Fan, and Dominique Lord. "Investigation of effects of underreporting crash data on three commonly used traffic crash severity models: Multinomial logit, ordered probit, and mixed logit." Transportation Research Record: Journal of the Transportation Research Board 2241 (2011): 51-58.
[21]  Ghasemzadeh, Ali, and Mohamed M. Ahmed. “A Tree-Based Ordered Probit Approach to Identify Factors Affecting Work Zone Weather-Related Crashes Severity in North Carolina Using the Highway Safety Information System Dataset”. Transportation Research Board Annual Meeting. No. 17-06764. 2017.
[22]  Li, Yanyan, Toshiyuki Yamamoto, and Guangnan Zhang. “The Relationship between Fatigue Driving and Injury Severity: An Endogenous Binary-Ordered Probit Model Framework Analysis”. Transportation Research Board Annual Meeting. No. 17-00962. 2017.
[23]  Yu, Rongjie, and Mohamed Abdel-Aty. "Using hierarchical Bayesian binary probit models to analyze crash injury severity on high speed facilities with real-time traffic data." Accident Analysis & Prevention 62 (2014): 161-167.
[24]  Khattak, Asad J., Robert J. Schneider, and Felipe Targa. "Risk Factors in Large Truck Rollovers and Injury Severity: Analysis of Single Vehicle Collisions." TRB 2003 Annual Meeting CD-ROM, Transportation Research Board, National Research Council, Washington DC. 2003.
[25]  Chib, Siddhartha, and Edward Greenberg. "Analysis of multivariate probit models." Biometrika 85.2 (1998): 347-361.
[26]  Holmes, Chris C., and Leonhard Held. "Bayesian auxiliary variable models for binary and multinomial regression." Bayesian analysis 1.1 (2006): 145-168.
[27]  https://stats.idre.ucla.edu/spss/output/probit-regression/.
[28]  https://stats.idre.ucla.edu/spss/dae/probit-regression/.
[29]  Jalayer, Mohammad, and Huaguo Zhou. “Exploratory Analysis of Run-off-Road Crash Patterns”. Transportation Research Board Annual Meeting. No. 17-05100. 2017.
[30]  Liu, Cejun, and Tony Jianqiang Ye. “Run-off-road crashes: an on-scene perspective”. No. HS-811 500. 2011.
[31]  Gong, Linfeng, and Wei David Fan. “Modeling Single-Vehicle Run-Off-Road Crash Severity in Rural Areas: A Mixed Logit Model Approach”. Transportation Research Board Annual Meeting. No. 17-03864. 2017.
[32]  Gong, Linfeng, and Wei David Fan. "Modeling single-vehicle run-off-road crash severity in rural areas: accounting for unobserved heterogeneity and age difference." Accident Analysis & Prevention 101 (2017): 124-134.
[33]  Carrigan, Christine E., and Malcolm H. Ray. “A New Approach to Run-off-Road Crash Prediction”. Transportation Research Board Annual Meeting. No. 17-01578. 2017.
[34]  McGinnis, Richard G., et al. "Estimating the influences of driver, highway, and environmental factors on run-off-road crashes using logistic regression." 78th Annual Meeting of the Transportation Research Board, Washington, DC. 1999.
[35]  Liu, Cejun, and Rajesh Subramanian. “Factors related to fatal single-vehicle run-off-road crashes”. No. HS-811 232. 2009.
[36]  Spainhour, Lisa, and Abhishek Mishra. "Analysis of fatal run-off-the-road crashes involving overcorrection." Transportation Research Record: Journal of the Transportation Research Board 2069 (2008): 1-8.
[37]  Delanne, Yves, Daniel Lechner, and Gilles Schaefer. "Analysis of influence of road factors on single vehicle run-off-the-road accidents: use of a Vehicle/Road model." Road Safety in Europe, 1998, Bergisch Gladbach, Germany. No. 10A, Part 7. 1998.
[38]  Davis, GARY A., S. U. J. A. Y. Davuluri, and Jianping Pei. "Speed as a risk factor in serious run-off-road crashes: Bayesian Case-Control Analysis with Case Speed Uncertainty." Journal of Transportation and Statistics 9.1 (2006): 17.