Yusuf Olushola Kareem, Oyindamola Bidemi Yusuf
Department of Epidemiology and Medical Statistics, Faculty of Public Health, College of Medicine, University of Ibadan, Ibadan, Nigeria
Correspondence to: Yusuf Olushola Kareem, Department of Epidemiology and Medical Statistics, Faculty of Public Health, College of Medicine, University of Ibadan, Ibadan, Nigeria.
| Email: |  |
Copyright © 2018 Scientific & Academic Publishing. All Rights Reserved.
This work is licensed under the Creative Commons Attribution International License (CC BY).
http://creativecommons.org/licenses/by/4.0/

Abstract
Fertility experience in Nigeria has been modeled using children ever born and analyzed with one part models. The distribution of children ever born in Nigeria is rightly skewed and with large preponderance of zeros. This suggests that models which can accommodate both over-dispersion and excess zeros are imperative to investigate the factors influencing the Nigerian fertility. Therefore, this study reviewed statistical count models and investigated a robust model that can be used to model fertility experience in Nigeria. This study utilized the 2013 National Demography and Health Survey (NDHS) dataset. Information on 38948 women of childbearing age (14-49 years) were extracted which include socio-economic, demographic and proximate characteristics. A stratified three-stage cluster sampling was adopted. The different statistical count models explored include Poisson/Quasi-Poisson, Negative Binomial, Discrete Weibull, Zero-Inflated Poisson, Zero-Inflated Negative Binomial, Hurdle Poisson and Hurdle Negative Binomial. The likelihood ratio test for Nested Models, Vuong test for Non-Nested Models and more generally the Akaike Information Criterion (AIC) were used to adjudge for the best model. The likelihood ratio test for nested models revealed that the models which account for overdispersion were of better fit. The Vuong test for Non-Nested model indicated that the two part models were of better fit than the one part models. To examine the nature of the excess zero observations, Zero-Inflated Poisson versus the Hurdle Poisson and also the Zero-Inflated Negative Binomial versus Hurdle Binomial were compared. The Vuong test showed that the Hurdle models fit better than their Zero-Inflated counterpart. More generally, the AIC for the different models were compared; the values were: 113504.4 (Poisson), 112975.2 (negative binomial), 111402.5 (discrete weibull), 1103663 (zero-inflated Poisson), 110353.3 (zero-inflated negative binomial), 109050.7 (hurdle Poisson), and 108970 (hurdle negative binomial). The Hurdle negative binomial gave the smallest AIC and identified contraceptive use, residing with partner, having more than one wife, age at marriage, women work status, currently breastfeeding, partners’ age, level of education (secondary and higher), wealth quintile, religion (other religion), ethnicity and region (North-East, North-West, South-East and South-South) to be statistically significantly associated with fertility level at p-value < 0.05. The Hurdle Negative Binomial provided more robust estimates and captured better the fertility experience in the Nigerian setting. The Hurdle Negative Binomial is therefore recommended and appropriate for modeling the fertility experience in Nigeria.
Keywords:
Hurdle models, Zero-Inflated models, Discrete Weibull, Generalized linear models, Fertility experience
Cite this paper: Yusuf Olushola Kareem, Oyindamola Bidemi Yusuf, Statistical Modeling of Fertility Experience among Women of Reproductive Age in Nigeria, International Journal of Statistics and Applications, Vol. 8 No. 1, 2018, pp. 23-33. doi: 10.5923/j.statistics.20180801.04.
1. Introduction
Count data appear in many application areas, from social science, natural science to medical sciences. In Epidemiology and Public Health, examples of discrete responses includes length of stay in hospital, commonly used as an indicator of the quality of care and planning capacity within a hospital [1], and the number of visits to a doctor [2-4], often taken as a measure of demand in healthcare and the number of children as an indicator of fertility [5-7].Count data which refer to number of times an event occurs in a specified or fixed period of time takes non-negative integers, 0, 1, 2, etc. In modeling such count data in diverse disciplines, the model often used is the Poisson regression, which models the conditional mean of the count as a linear regression on a set of covariates through the log link function. However, the Poisson model imposes parametric assumption of equality of mean and variance, which is too stringent for most count datasets. For many empirical applications, the variance of observed count data usually exceeds the mean, namely overdispersion and some cases underdispersion when the mean exceeds the variance. Also situation arises where occurrence dependence is unreasonable. The assumption of the Poisson model is gravely invalid and the standard errors will underestimate the true variability in the estimator and thus lead to overly small confidence intervals and inflated t-statistics [7].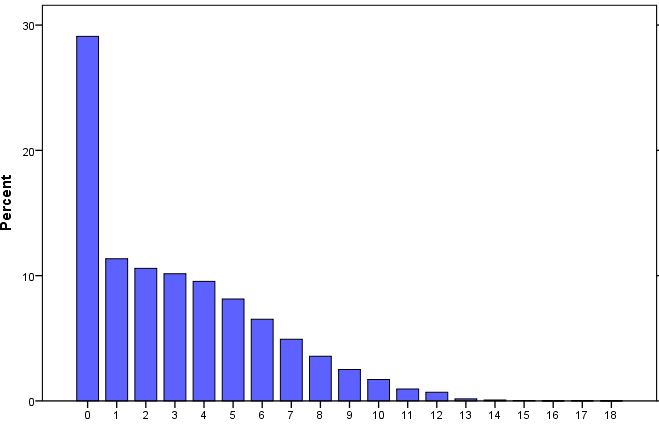 | Figure 1. Percentage Distribution of Children Ever Born (NDHS 2013) |
As a consequence of the limitations of the Poisson model which fails to account for over/under-dispersion in data and occurrence dependence; while the problem of occurrence dependence is not easily resolved, the problem of overdispersion usually caused by unobserved heterogeneity and/or excess zeros has been addressed in the literature with the use of negative binomial model [8]. The negative-binomial distribution is a viable and more flexible alternative distribution which allows the variance term to vary with each independent observation and removes the restriction of equality of the mean and variance and provides a better fit for count data in the presence of overdispersion [9].However, negative binomial regression cannot deal with excess zero problems. Several extensions of Poisson regression based models have been proposed to account for overdispersion and excess zeros. These include the zero-Inflated and hurdle models [10, 11] and the discrete weibull model [12].Fertility experience of a woman, usually measured by number of children ever born (CEB) [13, 14], is an example of count data. The distribution of CEB are usually rightly skewed and with large preponderance of zeros [15]. For instance, in the 2008 and 2013 Nigeria Demographic and Health Survey (NDHS) datasets, about 29% of the women of reproductive age (14 to 49 years) had no child and the number of children ever born ranges from 0 to 18.Over the last decade, Nigeria accounts for approximately one sixth of African population with about 3% annual growth rate and her population is projected to reach 440 million by 2050 and by 2100 will be ranked as the 3rd most populous country in the world after China and India [16]. If measures continue to grow unchecked, scholars have argued that this is an indicator of population explosion and economic instability which may cause water scarcity, hunger, chronic poverty, environmental degradation and conflict due to over utilization of the existing resources [5, 17]. Scholars have attempted to identify factors driving high level of fertility in Nigeria, nearly all reported studies on modeling fertility using children ever born in Nigeria have used statistical models like the Logistic and Poisson regression model [5, 6] and few have considered using negative binomial to account for the observed over-dispersion [8]. Nevertheless, the large number of zero responses gives concern for the suitability of these methods. This suggests that models which can accommodate both overdispersion and excess zeros are imperative to model the fertility experience of Nigeria. Therefore, this study reviewed statistical count models and investigate a more robust model that can be used to explain fertility experience in Nigeria.
2. Methods
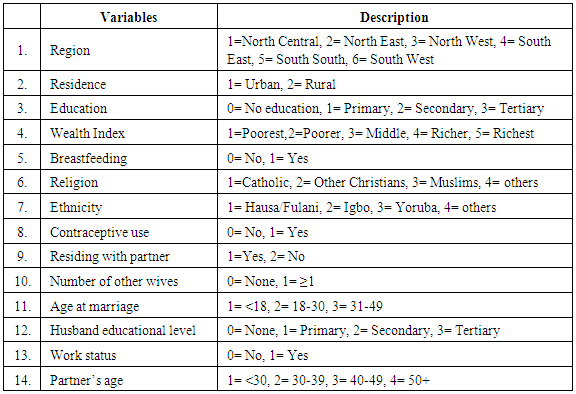
Study designThis study utilized the 2013 National Demography and Health Survey (NDHS) dataset which is a cross sectional design conducted by ICF Macro Calverton, Maryland USA, in conjunction with the National Population Commission (NPC). Nigeria is divided into States, each State is subdivided into Local Government Areas (LGAs), and each LGA is divided into localities, each locality was subdivided into Census Enumeration Areas (EAs). The 2013 NDHS sample was selected using a stratified, three stage cluster design consisting of 904 clusters, 372 in urban areas and 532 in rural areas. A representative sample of 40,680 households was selected for the survey, with a minimum target of 943 completed interviews per state [18]. The study focused on all women of reproductive age 14 to 49 years (n=38948) who have duly completed individual women questionnaires at the time of the survey. This study used a secondary analysis and hence there are no serious ethical issues. All the personal identifiers have been removed from the data; as a result, the confidentiality and anonymity of respondents were ensured. Also, permission to download and utilize the 2013 NDHS data was obtained from the ICF International before the utilization of this data through gpsrequests@dhsprogram.com.Variable Description and CodingThe outcome variable of interest (dependent variable) is fertility which was measured by the number of children ever born. The number of children ever born is an index of recent fertility and it is a count variable; while the independent variables include proximate, demographic and socio-economic variables: region, residence, women educational level, religion, ethnicity, wealth index, contraceptive use, currently breastfeeding, marital status, residing with partner, number of other wives, age at marriage, husband educational level, women working status and husband/partners’ age. Children ever born in the context of this study refers to the number of children a woman previously born alive as at the time of the study. All women of reproductive age were included because; it was aimed at predicting fertility of women irrespective of their background characteristics. The variables were coded as presented in Table 1.Table 1. Description of Variables
 |
| |
|
Statistical AnalysisThe IBM SPSS (version 23.0) was used to clean the data; the data was weighted using variable created from v005 (sample weight) before use. The sampling design effect; clustering was adjusted for using variables v021 (Primary sampling unit) and v022 (Sample strata for sampling error) respectively. Frequency tables were used to present socio-economic, demographic and proximate characteristics of respondents. Means and standard deviation (SD) were used to summarize quantitative variables, while categorical variables were summarized with percentages. Multicollinearity test of variables and dispersion test for the model were carried out. A variance inflation factor (VIF) greater than 4 was used as cut-off to indicate collinearity in a variable. Similarly, a value greater than 1.0 indicates overdispersion and a value less than 1.0 suggests underdispersion. The Statistical count regression models were fitted to children ever born using the backward selection procedure for variable selection; covariates significant at p value < 0.1 were selected for the full model. The count models fitted include:Generalized Linear Models (GLM)/one-part model• Poisson/Quasi-Poisson, • Negative binomial Modified Count/Two-part models• Zero-inflated Poisson • Zero-inflated negative binomial• Hurdle Poisson • Hurdle negative binomial regression models and the discrete Weibull regression model. Test of Model fitThe Vuong test was used to compare non-nested models; the likelihood ratio test was used to assess the nested models. The loglikelihood, Akaike Information Criterion (AIC) were then compared for all models to evaluate and select the most suitable model. These Statistical tests were analyzed using Statistical Software programming R. The larger the loglikelihood, the better a model and a more appropriate model gives the smallest AIC.Criteria for Model EvaluationThis study used the following test: loglikelihood, likelihood ratio, Vuong test and AIC for model evaluation and to assess the best model. We compare the loglikelihood from each model. To investigate the presence of overdispersion, we compare goodness of fit between pairs of nested models such as Poisson vs. negative binomial (NB); zero-inflated Poisson (ZIP) vs. zero-inflated negative binomial (ZINB) and hurdle Poisson (HP) vs. hurdle negative binomial (HNB) using the likelihood ratio test. To test whether excess zero exist in the data we compared these models: Poisson vs. ZIP (or HP); NB vs. ZINB (or HNB) using the Vuong test; since the models are non-nested. Similarly, we compared ZINB vs. HNB; ZIP vs. HP to ascertain the nature of the presence of any observed excess zeros using the Vuong test. A statistically significant large positive Vuong z-statistic provides an evidence of a better fit of model 1 over model 2, while a large, negative test statistic indicate that model 2 is of better fit. More generally, the models were compared using the Akaike Information Criterion (AIC) as the criteria for assessing the best fit. The AIC is a measure of goodnesss of fit of an estimated statistical model; it is used when comparing models fitted by maximum likelihood method to the same data, the model with the smaller AIC gives a better fit. The AIC is estimated as: where npar is the number of parameters in the fitted model.
3. Results
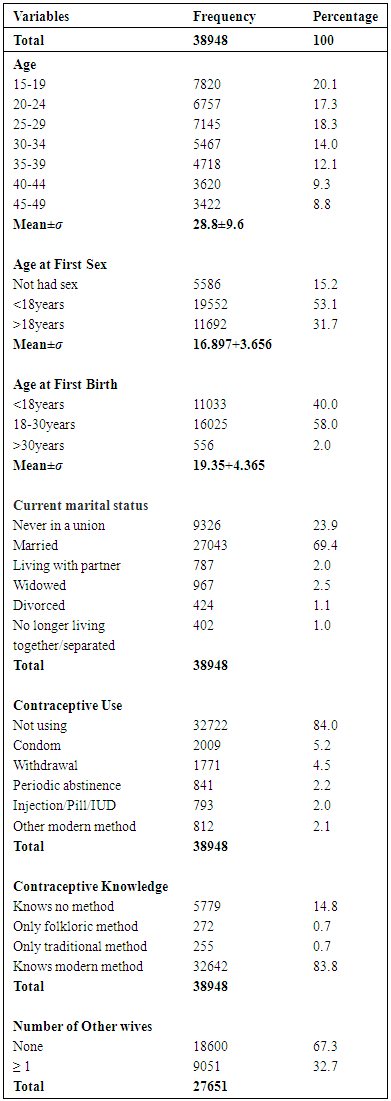
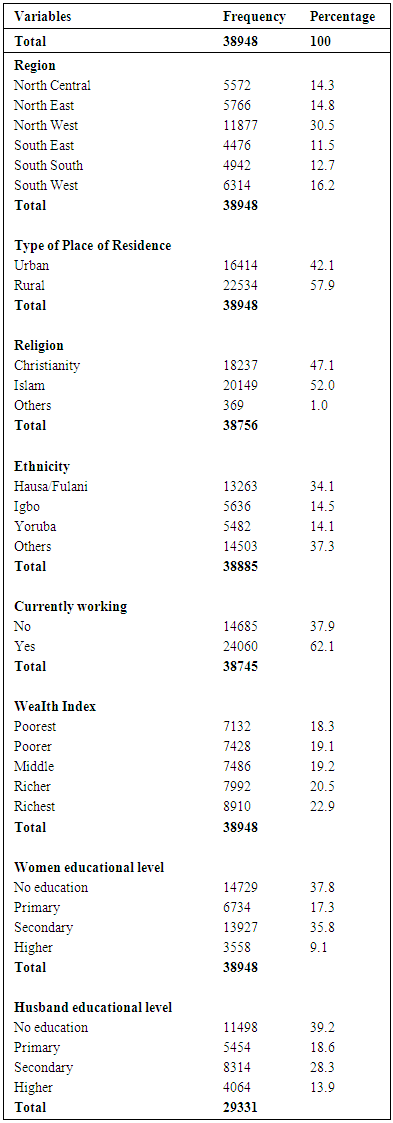
Proximate, Socio-economic and Demographic Characteristics of RespondentsPreliminary summary statistics of Proximate, socio-economic and demographic characteristics of respondents are presented in table 2 and table 3. A total of 38,948 records of women within child bearing age (14-49 years) were extracted. The mean of total CEB = 3.06, standard deviation (SD) = 3.02, skewness = 0.18 and kurtosis = 0.13. The weighted mean age of respondents was 28.8 years (SD = 9.6 years). About 5% of the population had not been exposed to sexual intercourse and the mean age at first sexual intercourse was 16.9 years (SD= 3.7 years). About two-fifth of the population had their first birth before 18yrs with a mean age of 19.4years (SD= 4.4 years), 69.4% were married while 23.9% are not in a union. About 84% of the population does not use any contraceptive; however these women knew either a modern method of contraception or folkoric/traditional method. Three out of five of the respondents recruited were from the Northern part of the country, 57.9% of all respondents lived in rural communities, 47.1% were of the Christian faith, 52% were Muslims and others are either traditionalist or do not practice any faith. About 18% and 23% belong to the poorest and richest wealth quintile respectively. Multicollinearity test of 20 independent variables was conducted, the omitted predictors: age at first birth, last birth a caesarian section, currently amenorrheic and cohabitation duration were removed due to problem of inconsistency, multicollinearity and singularity in statistical analysis. Similarly, overdispersion test using the 14 predictor variables produced a value of 1.16, and indicated that there exists overdispersion in the CEB model which is statistically significant at 0.001.Table 2. Frequency Distribution of Respondents by Proximate Characteristics
 |
| |
|
Table 3. Frequency Distribution of Respondents by Socio-economic and Demographic Characteristics
 |
| |
|
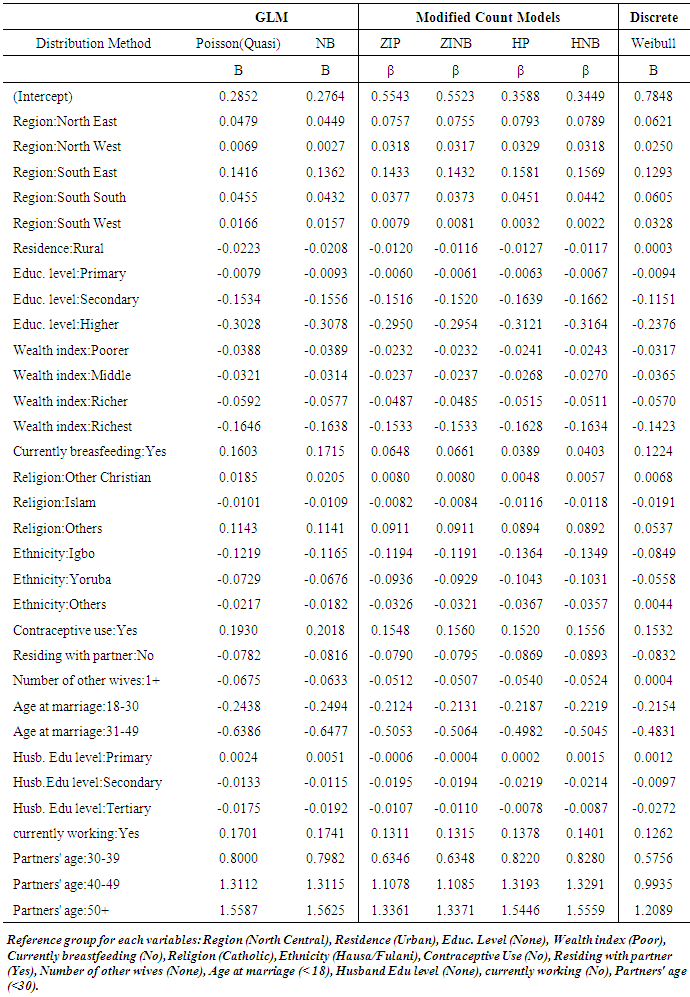
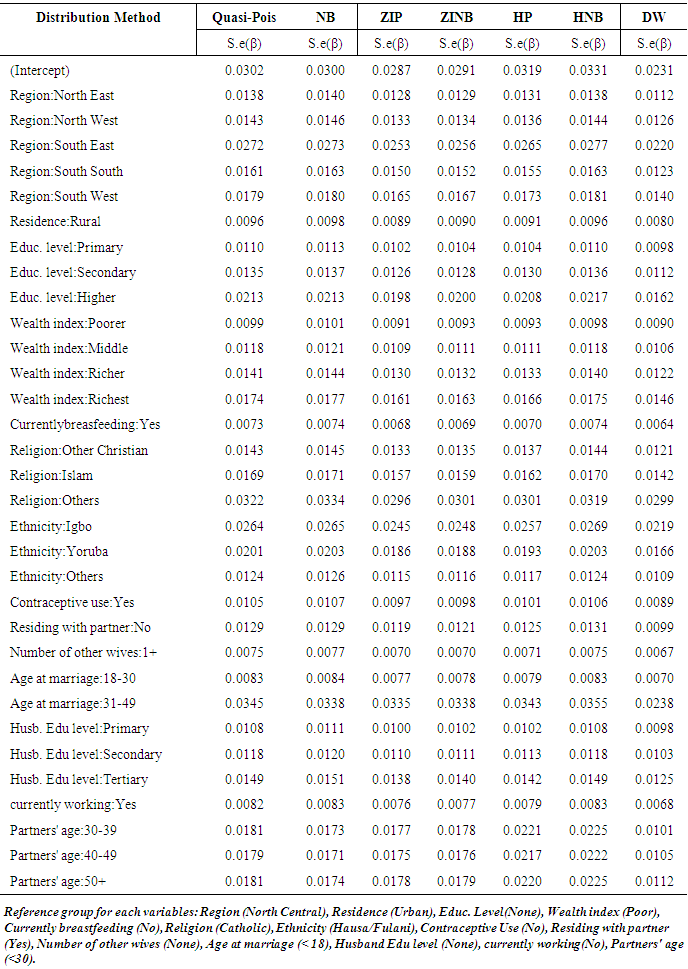
Model fittingThe model fitted for the CEB model compare the parameters from the Poisson/Quasi-Poisson, Negative Binomial, Zero-Inflated and Hurdle Poisson and Negative Binomial variants and the Discrete Weibull. As shown in Table 4 and 5, the estimate and standard errors of the models were compared. Statistical parameters for model fit were also assessed. It should be noted that the estimates from the Poisson and quasi-Poisson are always the same, but we compared the standard errors from the quasi-Poisson with other models reviewed, since the quasi-Poisson model provide robust standard error for overdispersed data. The various models gave similar (positive or negative) coefficients for all the covariates, except for the discrete weibull which retained positive coefficient for variables: rural residence (0.0003), other ethnicity (0.0044) and having more than one wife (0.0004) as oppose to other models. The standard errors were similar for all the models, although the discrete weibull provided the minimum standard error for all the variables. Table 4. Model Estimates of Poisson, Negative Binomial, Zero-Inflated Poisson, Zero-Inflated Negative Binomial and the Discrete Weibull Regression Coefficients
 |
| |
|
Table 5. Model Estimates of Poisson, Negative Binomial, Zero-Inflated Poisson, Zero-Inflated Negative Binomial and the Discrete Weibull Regression Standard Errors
 |
| |
|
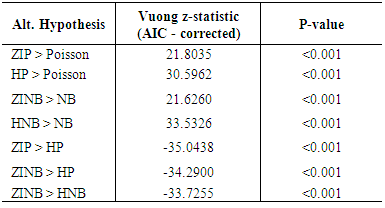
For all the models, contraceptive use, residing with partner, age at marriage, women work status, currently breastfeeding, partner’s age, women educational level (higher), wealth index, region (North East, South East and South South) and ethnic group (Yoruba and Igbo) retained statistical significance with number of children ever born at p value < 0.05.Model Assessment and EvaluationThe number of parameters estimated by the maximum likelihood (ML) method, the number of zeros captured  and the loglikelihood of various models were computed. The ML parameters were 33, for Poisson model; 34 for negative binomial and 66 for both zero-inflated Poisson and hurdle Poisson model, 67 for both zero-inflated negative binomial and hurdle negative binomial and 34 for the discrete weibull model. The Poisson model captures the least number of zeros (1723) while the zero-inflated models capture more number of zeros than the hurdle models. The zero-inflated negative binomial captures the highest number of zeros (2831), followed by the zero-inflated Poisson (2821) and their hurdle variants. Both hurdle Poisson and hurdle negative binomial capture the same number of zeros (2265). Furthermore, the hurdle negative binomial model gave the maximum loglikelihood of -54418.01, -56453.62 for hurdle Poisson, -55109.64 for zero-inflated negative binomial, -55117.16 for zero-inflated Poisson, -55666.25 for discrete weibull, -56453.62 for negative binomial and Poisson model produced the least loglikelihood of -56719.19. The likelihood ratio chi-square test was used to investigate the nested models: negative binomial vs. Poisson, zero-inflated negative binomial vs. zero-inflated Poisson, hurdle negative binomial vs. hurdle Poisson model. The likelihood ratio test indicated that the negative binomial models fit better than the Poisson model (χ2 = 531.14; p<0.001), zero-inflated negative binomial fit well than their zero-inflated Poisson (χ2 = 531.14; p<0.001) and similarly the hurdle negative binomial fit better than their hurdle Poisson (χ2 = 82.72; p<0.001). It is evident that the likelihood ratio test also provided evidence that the models which account for overdispersion were better, and therefore suggests that overdispersion is present in the data.The Vuong statistic test for non-nested models in table 6 revealed that the zero and hurdle variants are better than their one part model counterpart. Although, the hurdle Poisson vs. Poisson (AIC= 30.596; p<0.001) and hurdle negative binomial vs. negative binomial (AIC= 33.533; p<0.001) have a larger test statistic compared to their zero inflated models counterpart. Also, the zero-inflated negative binomial vs. hurdle negative binomial (AIC= -33.726; p<0.001) were also compared; the negative sign of the Vuong statistic implies that the hurdle models are better model fit than the zero-inflated models.
Table 6. Vuong Test Statistic for Non-Nested Models
 |
| |
|
More generally, all the models were compared using the Akaike Information Criterion (AIC) as presented in figure 2. The order of AIC values was consistent with the Vuong test statistic and in agreement with the likelihood ratio test and the loglikelihood values. The Poisson model gave the highest AIC (113504.4) and the hurdle negative binomial model gave the smallest AIC (108970.0) and is of best fit.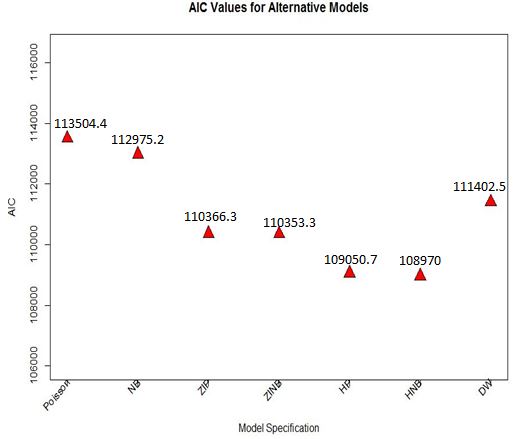 | Figure 2. AIC values for Poisson, negative binomial, zero-inflated Poisson, zero-inflated binomial, hurdle Poissonl, hurdle negative binomial and the discrete weibull regression model |
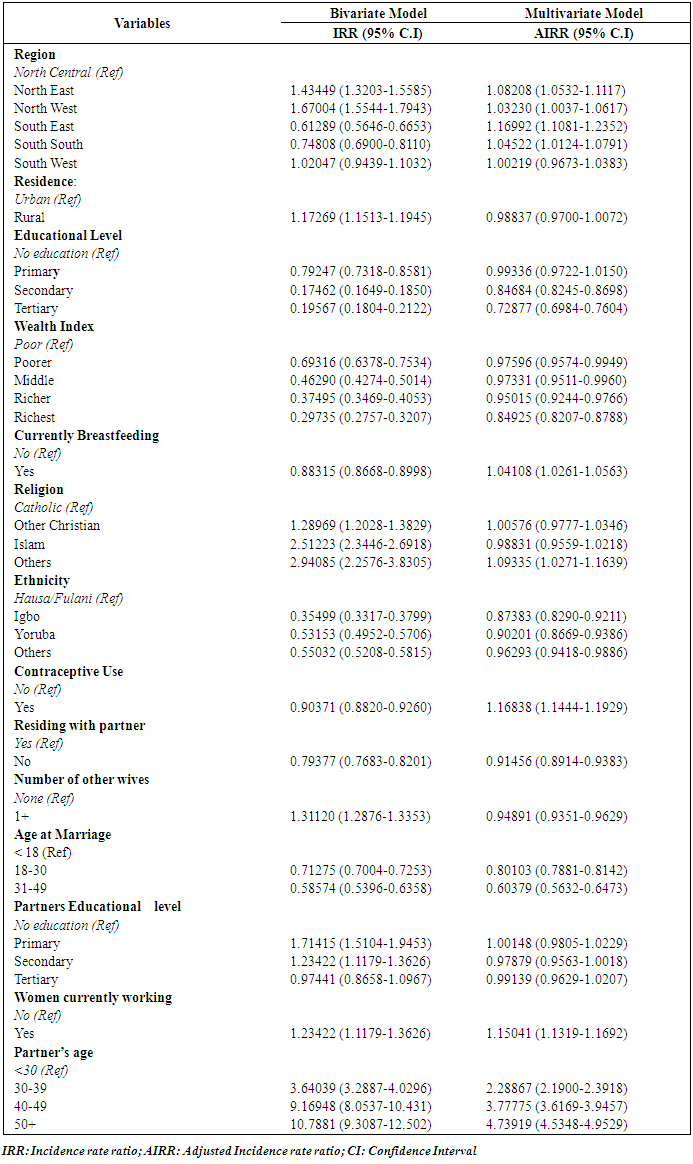
Incidence Rate Ratios (IRR) of Hurdle Negative Binomial RegressionThe results of bivariate and multiple regression of the best model, that is, the hurdle negative binomial regression model is presented in table 7. The table shows the Incidence Rate Ratios (IRR) for the bivariate model; Adjusted Incidence Rate Ratios (AIRR) and their 95% confidence interval (CI). Table 7. Incidence Rate Ratio (IRR) of the Best Model (HNB) for Factors Influencing Children Ever born
 |
| |
|
The bivariate analysis indicated a significant high risk of childbearing among women in the North East (IRR= 1.435, 95% CI: 1.32-1.56) and North West (IRR= 1.670, 95% CI: 1.56-1.79) compared to women in the North Central region. Women who reside in rural areas more likely to bear more children and women higher in educational level and wealth quintile were found to have less desire for children. Currently breastfeeding women (IRR= 0.883, 95% CI: 0.87-0.90) and using any form of contraception (IRR=0.90, 95% CI: 0.88-0.93) were found to be associated with lower risk of childbearing. Similar results also revealed that women from the Igbo, Yoruba and other ethnic group have lower risk to bear more children compared to the Hausa/Fulani tribe. Early age at marriage and polygamous marriage (IRR=1.31, 95% CI: 1.29-1.34) were found to be associated with high risk of childbearing. The Multivariate analysis showed that women in North East (AIRR=1.08, 95% CI: 1.05-1.11) and North West (AIRR=1.03, 95% CI: 1.004-1.06) had higher risk of children. Also women in South East (AIRR=1.17, 95% CI: 1.11-1.24) and South South (AIRR=1.05, 95% CI: 1.01-1.08) have high risk of child bearing compared with women in the North Central region after adjustment with other characteristics. Igbos are about 12% less likely (AIRR=0.88, 95% CI: 0.83-0.92), Yorubas are about 10% less likely (AIRR=0.90, 95% CI: 0.87-0.94) and other ethnic group are about 3% less likely (AIRR=0.97, 95% CI: 0.94-0.99) to have as many children compared with women from Hausa/Fulani tribe. The results also revealed that increase in women educational level and wealth quintile were found to be significantly associated with desire for fewer children. Secondary and tertiary education were significantly associated with lower risk of childbearing. Women who had tertiary education were about 27% less likely (AIRR=0.73, 95% CI: 0.70-0.76) to bear children compared with women who had no education. Similarly, women in the richest wealth quintile were about 15% less likely (AIRR=0.85, 95% CI: 0.82-0.88) to have as many children as women in the poorest quintile when all characteristics were adjusted for. Age at entry into marriage were significantly associated with children ever born, women who got married after 30 years (AIRR=0.60, 95% CI: 0.79-0.82) showed about 40% lower risk of childbearing compared to women who got married before 18 years. Women who do not reside with their partner’s are less likely to be at risk of high fertility compared to women who do not reside with their partner’s. Women in polygamous unions are 0.95 times less likely to have high fertility than women in monogamous unions. Women who are working (AIRR= 1.15, 95% CI: 1.13-1.17) were more likely to bear more children than women who are not working.
4. Discussion
This study investigated statistical count models for modeling dataset that are overdispersed with large number of zeros. Findings indicated that the generalized linear model tends to give similar estimates and the zero-inflated model and hurdle model also provide similar coefficients. Although, the standard errors from the quasi-Poisson were compared because they gave robust standard errors. Several studies have shown that the quasi-Poisson gives robust standard error estimates than the Poisson model when data are over/under- dispersed [11, 19].Nevertheless, the hurdle, zero-inflated models extracted more information than the generalized linear models and are of better fit. This suggests that the overdispersion in the dataset is due to excess zeros which corroborate the arguments of Guinnane and Moehling (2002). Due to this fact, many studies have adopted the use of modified or zero-augmented model in count data analysis but only few studies have utilized modified models in fertility studies. Studies by Melkersson and Rooth (2000) proposed zero-inflated count data model to deal with excess zero in Swedish fertility data. Similarly in another study, Silva and Covas (2000) modeled completed fertility of Portuguese women using modified hurdle model. Poston and Mckibben (2003) have also used the zero-inflated Poisson to predict the average number of children ever born to U.S. white and Mexican women and proposed that the zero-inflated negative binomial should be used for similar studies in the future. Poston and Mckibben concluded that the zero-inflated models are statistically more appropriate than the Poisson and negative binomial models in a low-fertility population like that of the U.S. However, in the Nigerian context, where birth is seen as a gift from God; this norm tends to increase the level of fertility and couples do not intend or make decisions to be childless or bear a child, contrary to the situation in advanced and low-fertility country [20]. This study revealed that the hurdle models are more statistically appropriate than the zero-Inflated models in the Nigerian context; with a high level of total fertility rate of 5.5 [18]. The hurdle negative binomial regression model showed that women educational level and wealth quintile were found to be significantly associated with fertility level. Women who had atleast secondary education were less likely to have high fertility compared to women who had no education. Similarly, women in the richest wealth quintile were less likely to have as many children as women in the poorest quintile when all characteristics are adjusted for. These results are consistent with past studies conducted in Nigeria and other parts of the globe [5, 6, 8, 21, 22].The level of fertility in Nigeria were found to be associated with ethnic groups than the region of the respondents, since respondents from different ethnic groups may reside in another region not dominated by their ethnic group. Women in North East and North West have high risk of childbearing compared with women in the North Central region. Similarly, women in South East and South South are likely to have a higher level of fertility when adjusted for other characteristics. Igbos, Yorubas and other ethnic group are less likely to have as many children compared with women from Hausa/Fulani tribe. These findings have also been reported in previous studies [5, 6].Our results also revealed that age at entry into marriage were significantly associated with fertility, which is related to the length of a woman reproductive life span. Women who got married within 18 to 30years and after 30 years revealed a decrease in fertility compared to women who got married before 18 years. Women who do not reside with their partners’ were less likely to be at risk of high fertility compared to women who reside with their partners’. These results are in consonance with previous findings [5, 8], since women might be exposed to lower coital frequency. Married to older partners was associated with high risk of fertility; which may be due to marital or cohabitation duration. Although, in this study, attention was not given to the husband’s age at marriage. Surprisingly, women who are working were more likely to bear more children than women who are not working, this is in accordance with similar studies conducted in Nigeria [5, 6, 8].
5. Conclusions
This study investigated statistical count models that can be used for count data, which are overdispersed with large number of zero using fertility data. The hurdle negative binomial provided the best robust estimates of fertility among women of reproductive age and captures better the fertility experience in the Nigerian setting. The hurdle negative binomial is therefore recommended and appropriate for modeling the fertility experience in Nigeria and appropriate for count data that are overdispersed with large number of zeros.
Limitation of Study
Nigeria Demographic and Health Survey (NDHS) data are reported retrospectively. Cultural beliefs and norms often affects the reports and data that involves birth, especially of dead children, since CEB according to NDHS is the total number of children dead or living bear by women in their reproductive age.
ACKNOWLEDGEMENTS
The Authors acknowledge the kind permission of Measure Demographic and Health Survey to use the data for this study.
References
| [1] | M. Vass, C. Hendriksen, J. L. Thomsen, E. T. Parner, and K. Avlund, “Preventive home visits to home-dwelling older people and hospital admissions: a municipality-randomised intervention trial.,” Eur. J. Ageing, vol. 5, pp. 67–76, 2008. |
| [2] | C. F. Baum, “Models for Count Data and Categorical Response Data,” 2010. |
| [3] | J. Gonçalves and F. Weaver, “Home Care , Hospitalizations , and Doctor Visits,” Geneva, Switzerland, 2014. |
| [4] | A. E. Stuck et al., “A randomized trial of in-home visits for disability prevention in community-dwelling older people at low and high risk for nursing home admission.,” Arch. Intern. Med., vol. 160, pp. 977–986, 2000. |
| [5] | O. M. Akpa and O. Ikpotokin, “Modeling the Determinants of Fertility among Women of Childbearing Age in Nigeria: Analysis Using Generalized Linear Modeling Approach,” Int. J. Humanit. Soc. Sci., vol. 2, no. 18, pp. 7–11, 2012. |
| [6] | A. F. Fagbamigbe and A. S. Adebowale, “Current and predicted fertility using Poisson regression model: evidence from 2008 Nigerian Demographic Health Survey.,” Afr. J. Reprod. Health, vol. 18, no. 1, pp. 71–83, 2014. |
| [7] | R. Winkelmann, “Counting on Count Data Models,” IZA World Labor, no. 148, pp. 1–10, 2015. |
| [8] | O. O. Alaba, O. E. Olubusoye, and J. O. Olaomi, “Spatial patterns and determinants of fertility levels among women of childbearing age in Nigeria,” South African Fam. Pract., vol. 59, no. 4, pp. 143–147, 2017. |
| [9] | Ismail N. and Zamani H., “Estimation of claim count data using negative binomial, generalized Poisson, zero-inflated negative binomial and zero- inflated generalized Poisson regression models.,” Casualty Actuar Soc E-Forum, pp. 1–28, 2013. |
| [10] | R. Winkelmann and K. F. Zimmermann, “Recent Developments in Count Data Modelling: Theory and Application,” Journal of Economic Surveys, vol. 9, no. 1. pp. 1–24, 1995. |
| [11] | A. Zeileis, C. Kleiber, and S. Jackman, “Regression Models for Count Data in R,” 2008. |
| [12] | H. S. Kalktawi, K. YU, and V. Vinciotti, “A Simple and Adaptive Dispersion Regression Model for Count Data,” pp. 1– 24, 2016. |
| [13] | D. L. J. Poston and S. L. McKibben, “Using Zero-inflated Count Regression Models To Estimate The Fertility Of U. S. Women," Journal of Modern Applied Statistical Methods.,” J. Mod. Appl. Stat. Methods, vol. 2, no. 2, 2003. |
| [14] | T. W. Guinnane and C. M. Moehling, “The fertility of the Irish in America in 1910,” Economic Growth Centre, Yale University, 2002. |
| [15] | P. Ranjita and K. Charanjit, “Modelling fertility: an application of count regression models,” Chinese J. Popul. Resour. Environ., 2015. |
| [16] | United Nations, “United Nations,” World Popul. Prospect. 2012 Revis. Popul. Div. Dep. Econ. Soc. Aff. New York; United Nations 2013., 2013. |
| [17] | B. U. Mberu and H. E. Reed, “Understanding Subgroup Fertility Differentials in Nigeria.,” Popul. Rev., vol. 53, no. 2, pp. 23–46, 2014. |
| [18] | National Population Commission (NPC) [Nigeria] and ICF International, “Nigeria demographic and health survey 2013,” Abuja NPC ICF Int., 2014. |
| [19] | A. C. Cameron and P. K. Trivedi, “Essentials of Count Data Regression,” A Companion to Theor. Econom., pp. 331–348, 1999. |
| [20] | J. M. C. S. Silva and F. Covas, “A modified hurdle model for completed fertility,” J. Popul. Econ., vol. 13, pp. 173–188, 2000. |
| [21] | R. Pandey and C. Kaur, “Modelling fertility: an application of count regression models,” Chinese J. Popul. Resour. Environ., no. November, 2015. |
| [22] | S. Mahsa, “Factors affecting children ever born for 15-49 year -old women in semnan using poisson regression,” Heal. Syst. Res., vol. 11, no. 3, pp. 627–637, 2015. |

 Abstract
 Reference
 Full-Text PDF
 Full-text HTML