-
Paper Information
- Paper Submission
-
Journal Information
- About This Journal
- Editorial Board
- Current Issue
- Archive
- Author Guidelines
- Contact Us
International Journal of Statistics and Applications
p-ISSN: 2168-5193 e-ISSN: 2168-5215
2017; 7(6): 316-319
doi:10.5923/j.statistics.20170706.07

Factor Analysis of Behaviour Change among Pupils in Public Primary Schools in Kisii County, Kenya
 Abstract
 Reference
 Full-Text PDF
 Full-text HTML
Lameck Ondieki Agasa1, Zachary Kebati Oigara2, Anakalo Shitandi3
1Statistician, Research and Extension Office, Kisii University, Kisii, Kenya
2Guidance and Counselling Officer, Dean of Student Office, Kisii University, Kisii, Kenya
3Registrar Research and Extension, Kisii University, Kisii, Kenya
Correspondence to: Lameck Ondieki Agasa, Statistician, Research and Extension Office, Kisii University, Kisii, Kenya.
| Email: |  |
Copyright © 2017 Scientific & Academic Publishing. All Rights Reserved.
This work is licensed under the Creative Commons Attribution International License (CC BY).
http://creativecommons.org/licenses/by/4.0/

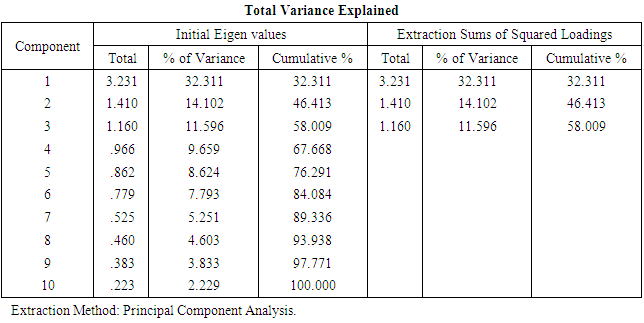
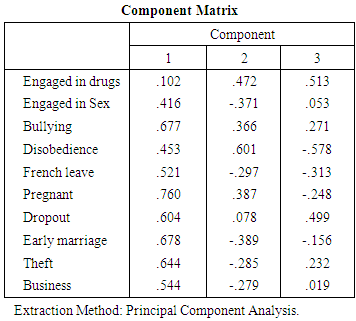
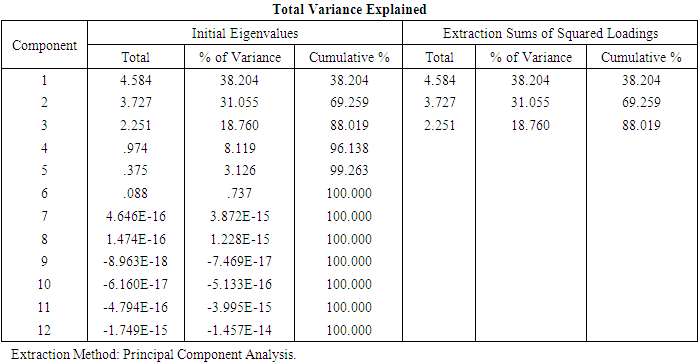
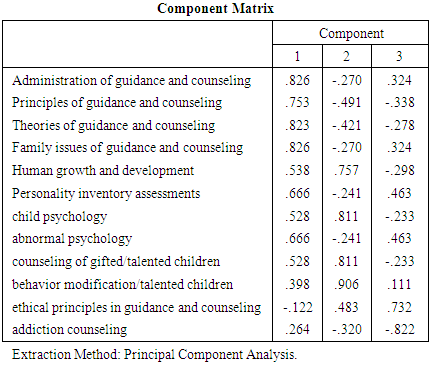
Education is the foundation in which the community is built, pupils need to be mentored and nurtured in such a way that they behave as the society norms dictates. This study was conducted to examine and identify the pupil’s behaviour changes and the remedy by teachers through the trainings they receive in guidance and counselling. The study was conducted in Kisii County using questionnaire and face to face interview where 345 pupils and 69 teachers participated. Data was collected and analyzed using SPSS. Factor analysis was used. The study realized that 58.09% of total variance of the behaviour changes was explained by pupils engaging in drugs, pupils being disobedient and pupils engaging in early marital sex. In the same case 88.001% of the total variance was explained by three teacher training factors: family issues in guidance and counselling and administration of guidance and counselling, behavioral modification of talented children and ethical principles of guidance and counselling. Thus, the result indicates unpleasant behaviour changes that need to be addressed by all stakeholders in public primary schools.
Keywords: Factor Analysis, Behaviour Change, Teacher Training, Factor Analysis, Variance
Cite this paper: Lameck Ondieki Agasa, Zachary Kebati Oigara, Anakalo Shitandi, Factor Analysis of Behaviour Change among Pupils in Public Primary Schools in Kisii County, Kenya, International Journal of Statistics and Applications, Vol. 7 No. 6, 2017, pp. 316-319. doi: 10.5923/j.statistics.20170706.07.
1. Introduction
- There is an increase in the number of primary schools involved in all kinds of misbehavior in Kisii County. [1, 2] pointed out that there were incidences of substance and alcohol abuse, absenteeism, early pregnancies, premarital sex, lack of respect for the authority resulting into many school dropouts, and poor performance in National examinations. It is very common nowadays that; parents, teachers, the public administrators and church leaders blame each other for failing to teach young people to be well behaved. The Ministry of Education has ensured that each primary school appoints one teacher counselor to cater for psychosocial problems of pupils yet misbehavior has not been curbed. Schools boards of management and parents-teachers association have addressed pupil’s misbehavior in their meetings, yet indiscipline persists. The information collected from the office of Quality assurance and standards office from Gucha South (one of the sub-county) of Kisii County, indicated that there were still incidences of absenteeism, late coming to school, premarital sex, unplanned pregnancy and pupils moving out of school to engage in Boda Boda business during class hours [1]. A similar incidence was reported by [3] who indicated that police in Kisii County arrested 18 primary school pupils between the age of 13-14 years drinking in a bar.It’s believed that this may be partly caused by poor parenting skills, indiscipline in schools, society moral breakdown and poor implementation process of guidance and counseling programmes which promote positive behavior among pupils. If this issue of misbehavior among pupils is not treated and curbed with the seriousness it deserves, opportunities that could have otherwise been available for primary school pupils to advance academically and have adjusted life will become foreclosed due to misbehavior complications. This will pose a serious threat to the social economic, and security of Kisii County. There is therefore a need to strengthen guidance and counseling programmes which influence positive behavior among the pupils.
2. Methods
- The study used an exploratory factor analysis design. Exploratory factor analysis was used to uncover underling complex patterns by exploring the data sets to testing predictions [4]. Extraction method based on principal component analysis and rotation method on varimax with Kaiser Normalization was used.The study was carried out in Kisii County. Kisii County has nine sub-counties originally called districts namely, Kisii Central, Masaba South, Kenyenya, Marani, Kisii South, Nyamache, Sameta, Gucha and Gucha South. Kisii county is located in western Kenya, on latitude: 0° 41' 0 S and longitude: 34° 46' 0 E. The town is a driving distance of 309 km (192 mi) from the capital city of Nairobi, located east-southeast, on Class B3 all-weather road. Other major urban center's distances from Kisii town are Kisumu City which is 114 km (71 mi) to the northwest; Nyamira at 23 km (14 mi) to the immediate north; Keroka at 25 km (16 mi) to the east; Kericho at 101 km (63 mi) to the northeast; Kilgoris at 46 km (29 mi) to the southeast; Narok at 165 km (103 mi) to the east; and Migori to the south-west 67 km (42 mi) which otherwise connects the town to the Kenya/Tanzania border at Isebania town a further 31 km (19 mi) south.The study had a target population consisting of 696 teacher counselors and 696 head teachers of 696 schools and 2445 pupils from all primary schools in the 9 sub counties. Simple random sampling and Purposive sampling were used to collect samples [5] was used to calculate sample size. A sample size of 68 teachers and 345 pupils was used.
3. Results and Discussions
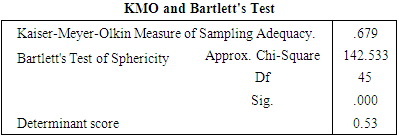
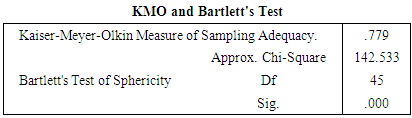
- Behavioral changesTable 1 shows Kaiser- Meyer-Olik test which was done to measure the adequacy of behavioral change variables for factor analysis. The KMO statistic is equal to 0.679>0.6 which clearly indicates that factor analysis is appropriate for the data set. This is supported by the study done by [6] which indicated the Kaiser-Meyer-Olkin (KMO) measure of 0.886 which was above the threshold of 0.6 and was acceptable for factor analysis. The Bartlett’s test is statistically significant p<0.001 this indicates there is a relationship between the variables. The determinant score is 0.53>0.01 which shows absence of multicollinearity.
|
|
|
|
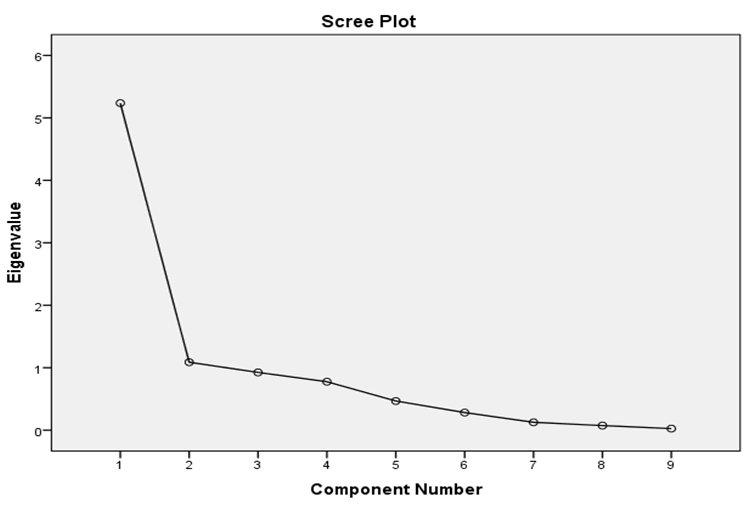 | Figure 1. Scree plot |
|
|
4. Conclusions
- The result of this study indicates that behaviour changes in Kisii county has deteriorated. The pupils engage in different misconduct in the schools including drug abuse, early marriages, sneaking out of school and indiscipline cases are on the rise. On the other hand the teacher counselors’ training to handle guidance and counselling is of great importance in capping the misbehavior. The result of factor analysis found that three behaviour changes factors; pupils engaging in drugs, pupils being disobedient and pupils engaging in early marital sex explained 58.09% variance of the behaviour changes. In the same case factors for teacher training in family issues in guidance and counselling and administration of guidance and counselling, behavioral modification of talented children and ethical principles of guidance and counselling explained by 88.001% variance of teacher training. Guidance and counselling teachers should step up their initiatives in dealing with behavior decay in most public primary schools. The headteacher should make it mandatory for the pupils to participate in weekly guidance and counselling programs by putting them in the timetable.