-
Paper Information
- Paper Submission
-
Journal Information
- About This Journal
- Editorial Board
- Current Issue
- Archive
- Author Guidelines
- Contact Us
International Journal of Statistics and Applications
p-ISSN: 2168-5193 e-ISSN: 2168-5215
2017; 7(6): 304-310
doi:10.5923/j.statistics.20170706.05

The Robustness of Binary Logistic Regression and Linear Discriminant Analysis for the Classification and Differentiation between Dairy Cows and Buffaloes
 Abstract
 Reference
 Full-Text PDF
 Full-text HTML
Sherif A. Moawed1, Mohamed M. Osman2
1Department of Animal Wealth Development, Biostatistics Division, Faculty of Veterinary Medicine, Suez Canal University, Ismailia, Egypt
2Department of Animal Wealth Development, Faculty of Veterinary Medicine, Suez Canal University, Ismailia, Egypt
Correspondence to: Sherif A. Moawed, Department of Animal Wealth Development, Biostatistics Division, Faculty of Veterinary Medicine, Suez Canal University, Ismailia, Egypt.
| Email: |  |
Copyright © 2017 Scientific & Academic Publishing. All Rights Reserved.
This work is licensed under the Creative Commons Attribution International License (CC BY).
http://creativecommons.org/licenses/by/4.0/

This study was planned to evaluate the performance of linear discriminant analysis (LDA) and binary logistic regression (BLR) for differentiation between Friesian cows and buffaloes on the basis of days in milk (DIM), milk yield per year (kg), days open (DO), calving interval (CI), and age at first calving (AFC, month). Considering the assumptions behind each method, LDA and BLR were compared according to sample size impact and lack of multivariate normality of predictors. A random sample of 1070 cases was selected from the animals being represented by all predictors. The comparison between LDA and BLR was based on the significance of coefficients, classification rate, and area under ROC curve (AUC). Results showed that both methods selected DIM, DO and AFC as the significant (P < 0.01) contributors for data classification. The percentages of correct classification were 67.4% and 67.5%, for LDA and BLR, respectively. Besides, The AUCs were 0.660 and 0.664, for LDA and LR, respectively. Overall, sample size has the same impact on both analyses. However, BLR showed slight superiority for animals being correctly classified. In conclusion, LDA and BLR can be used effectively for classification of dairy cattle breeds, even with violation of normality assumption.
Keywords: Dairy cattle, Linear Discriminant Analysis, Binary Logistic Regression, ROC Curve
Cite this paper: Sherif A. Moawed, Mohamed M. Osman, The Robustness of Binary Logistic Regression and Linear Discriminant Analysis for the Classification and Differentiation between Dairy Cows and Buffaloes, International Journal of Statistics and Applications, Vol. 7 No. 6, 2017, pp. 304-310. doi: 10.5923/j.statistics.20170706.05.
Article Outline
1. Introduction
- Choosing the exact statistical method for data fitting is a frequent question for researchers. Among the most paramount criteria for the differentiation between statistical methods are, the type of response variable as well as the purpose of the research design. If we have categorical and dichotomous dependent variable, both binary logistic regression (BLR) and linear discriminant analysis (LDA) were suggested as the two multivariate models that have been used for classification of cases into their original groups. To date, there has been an increasing interest in choosing between BLR and LDA for analysis of biological data. Although, the theory behind each method has been extensively published, the comparison between the two methods still represents a problem for researchers who aimed to distinguish between two or more categorical outcomes in practice. Summarizing the findings of previous studies, none of these methods was perfectly superior over the other in term of data classification. Different criteria have been used for evaluating the performance of BLR and LDA in previous investigations. Hair et al. [1] revealed that BLR was better than LDA for analysing categorical binary outcomes, particularly, if the predictor variables were continuous. Moreover, they concluded that the preference of BLR was attributed to its flexibility regarding the assumptions concerning independent variables. Contrary, Kolari et al. [2] suggested that BLR was similar to LDA when the assumptions of discriminant analysis have been met. Several attempts have been undertaken to address the convergences and the divergences between BLR and LDA [3-8], however, debate still present with regard of the choice between the two analytical methods.The majority of previous studies revealed that, when the assumptions of discriminant analysis have been verified, particularly, the multivariate normality of explanatory variables and homogeneity of covariance matrices, LDA can perform better than BLR. In contrast, still others recommend BLR for data classification because they fail to practically verify the assumptions of LDA. What is not clear is the effect of sample size variation on the performance of the two methods because most of researches have been directed toward the comparison between BLR and LDA on the basis of assumptions of each method, type of predictors, prior probabilities, presence or absence of multicolinearity among independent variables, and the number of categories of dependent variable. Although, a number of studied [6, 9, 10, 11] have been carried out to examine the impact of sample size on both methods, the majority of these studies have been conducted using simulation data. This led us to plan for this study along with the incorporation of real datasets. Therefore, the present study was aimed to examine the robustness of BLR and LDA for classification of dairy animals belonging to two breeds, Friesian cows and buffaloes, using a set of predictor variables. More specified, the performance of each method was evaluated using nonnormal explanatory variables along with studying the effect of sample size variation. The comparison between the two approaches was relied on the coefficients of each model, the area under ROC curve (AUC), and the percentage of correct classification of animals.
2. Materials and Methods
2.1. Linear Discriminant Analysis
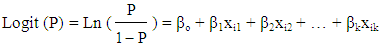
- Linear discriminant analysis (LDA) is a statistical method used to examine the association between a categorical outcome and multiple independent variables in the form of discriminant function. This multivariate technique can be used to find out which explanatory variable best discriminate between two or more groups along with classification of cases into their proper group [12, 13]. The number of canonical discriminant functions is mainly determined by the number of categories minus one, or the number of discriminators variables, which is smaller. If we have only two groups or categories, then one discriminant function will be derived, giving the simplest form of LDA. The linear discriminant equation (LDE) is given as follows:
 | (1) |
2.2. Binary Logistic Regression Analysis
- Binary logistic regression (BLR) is used to study the association between a categorical dependent variable and a given set of one or more explanatory variables. Unlike, ordinary regression analysis, BLR can predict the binary categorical outcome, denoting a probability of success or failure. Hence, the predicted probabilities are ranged from 0 to 1. This feature makes BLR another suitable method for classification of cases into one of the two groups. To derive the BLR model, let p is the probability of success (case classified into group 1), and (1-p) as the probability of failure (case classified into group 0). Therefore, the BLR model will be:
 | (2) |
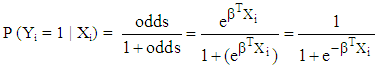 | (3) |
 is the odds ratio for the independent variable Xi.The choice between LDA and BLR is to greater extent depends on the assumptions beyond each method. Theoretically, BLR is more flexible regarding the assumptions, particularly those of independent variables. However, both methods require some assumptions in common [15] such as, independency of observations, absence of multicolinearity between predictors, and absence of outliers in datasets.Specifically, LDA requires more assumptions around the distribution of predictors, which may or may not be available for all data. The most important assumptions for LDA are, (i) the predictor variables have to be multivariate normally distributed, hence, categorical ones are not available for LDA. (ii) LDA assumes the homogeneity of covariance matrices for all the examined explanatory variables.
2.3. Data Source and Applications
- In this study, veterinary data were used to evaluate the performance of LDA and BLR for classifying animals being Friesian cows or buffaloes. Also, both methods were incorporated to determine the explanatory variables being discriminate well between the two breeds. Milk yield records were collected from a large commercial dairy farm located in Dakahliya governorate, Egypt. Because the number of randomly selected animals for the two breeds was different, 418 for cows, and 652 for buffaloes, prior probabilities were set out based on the sample size [1]. The predictor variables were, days in milk (days), milk yield per year (kg), days open (days), calving interval (days), age at first calving (month). Therefore, the dependent variable in this study was the species of dairy cattle either cows or buffaloes. Data were handled before analysis for missing values, detection of outliers, checking of assumptions. No signs of collinearity were found among predictors. Box's M test was used to check the assumption of homogeneity of covariance matrices. Results of this test revealed the violation of this assumption, even with log transformation of data. Because, BLR is of no need to that assumption, hence, our research question was: how well LDA perform under the violation of this assumption. Besides, we have analyzed the datasets of different sizes to explore the impact of sample size on the performance of LDA and BLR.Estimates of the two methods were compared in term of lack of multivariate normality of predictors, along with the influence of sample size variation. The main criteria used for comparing LDA and BLR were, the coefficients of each model, the percentage of correct classification of animals, and the area under the ROC curve (AUC) using ROC curve analysis. Specifically, ROC analysis was carried out using the predicted probabilities saved from the two statistical methods. The larger the AUC, the better the model used in data classification and prediction. Results were considered significant at a probability level less than 0.05. All statistical analyses were conducted by SAS, SPSS, and MedCalc statistical commercially available softwares.
3. Results
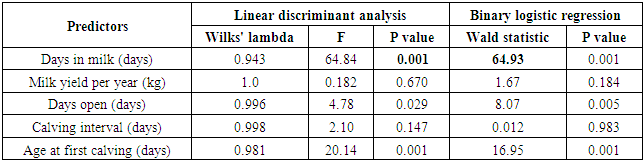
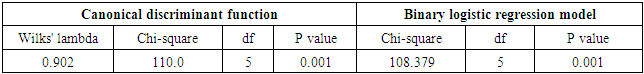
- The first set of analyses in this study was carried out to examine the assumptions required by linear discriminant analysis. Box's M statistic which has been used to test the homogeneity of covariance matrices revealed the violation of that assumption (Box's M = 421.15, F = 27.93, and p < 0.001) in all analyses. The log transformation of independent variables denoted also non-normal data. Hence, the multivariate normality of explanatory variables has not been provided for the preset dataset. However, the values of log determinants were nearly equal between the classes of two breeds (35.13 and 33.49). The results obtained from the preliminary analysis showed no signs of collinearity between the explanatory variables. The highest correlation (0.65) was observed between days open and calving interval. In term of determining the best set of predictors which significantly differentiate between the Friesian cows and buffaloes, results of LDA and BLR revealed that days in milk, days open, and age at first calving have significant (p < 0.05) contribution in data classification (Table 1), using the total sample of this study (n = 1070). From the data in Table 2, it can be seen that LDA used F- distribution and Wilkes' lambda statistic, while as BLR relied on chi-square distribution and Wald statistic for testing the contribution of explanatory variables in discrimination of animals of the two breeds. Thus, both LDA and BLR showed no significant differences (p > 0.05) between the two breeds on the basis of milk yield per year and calving interval.
|
|
|
|
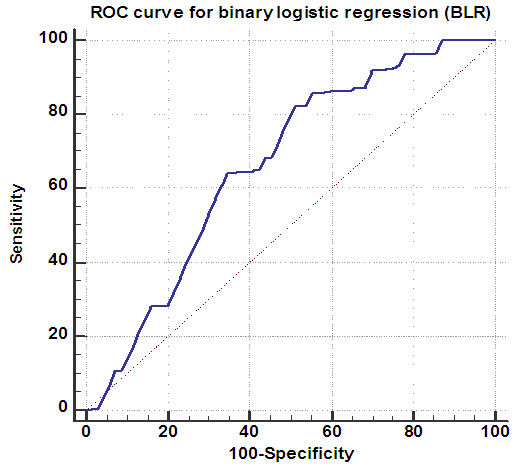 | Figure 1. ROC curve for logistic regression model using the total sample size (n = 1070) |
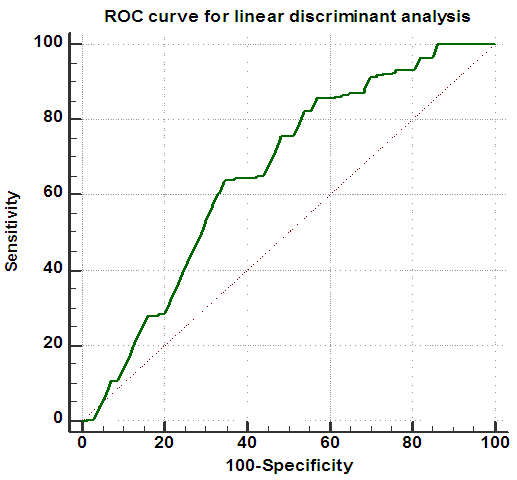 | Figure 2. ROC curve for linear discriminant analysis using the total sample size (n = 1070) |
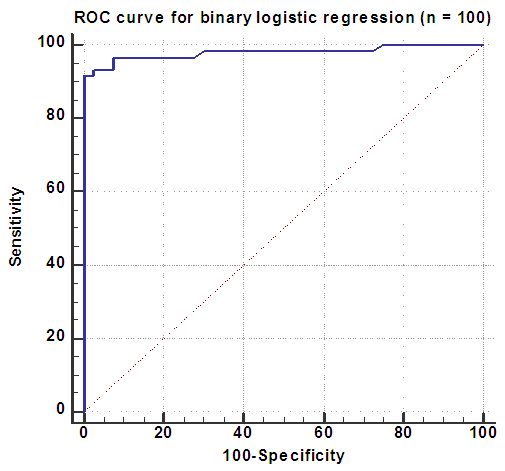 | Figure 3. ROC curve for binary logistic regression model using small sample size (n = 100) |
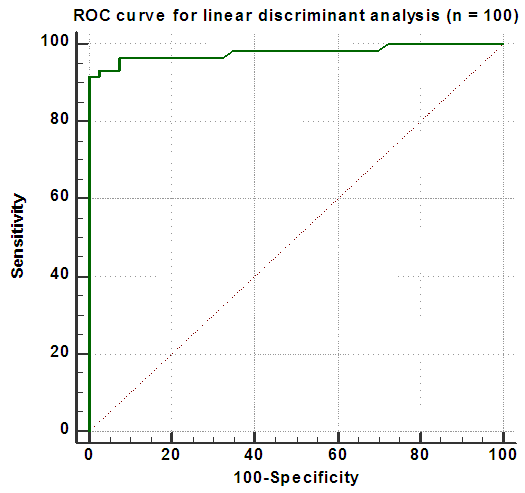 | Figure 4. ROC curve for linear discriminant analysis using small sample size (n = 100) |
4. Discussion
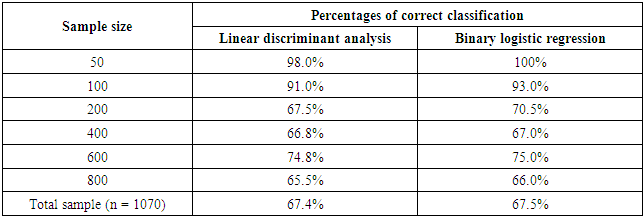
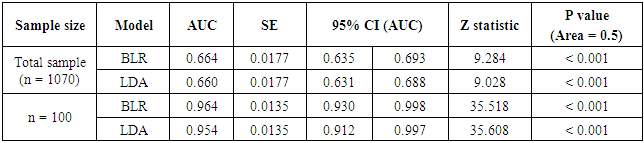
- The present study was designed to evaluate the robustness of linear discriminant analysis and binary logistic regression when handling nonnormal data, with special consideration for the outcomes potentially attributed to sample size variation. A real veterinary dataset have been used to compare between the two statistical methods. Classification of animals being dairy Friesian cows or buffaloes was carried out on different sample sizes, with violation of multivariate normality of the explanatory variables. Results of this study revealed that both LDA and BLR have selected the same variables to discriminate between the two breeds. Among the significant predictors, as denoted by LDA and BLR, days in milk was the most important contributor in differentiation between Friesian cows and buffaloes, followed by age at first calving, then days open. On the other side, milk yield per year and calving interval were proved to be non-significant discriminators between the two breeds, as showed by the two models. Therefore, it can be concluded that the significant independent variables denote the substantial mean differences between the breeds. Hence, this finding suggests that the least square estimators of LDA are consistent with the maximum likelihood estimators of BLR. In term of using real non-normal datasets, there is a similarity between the finding in this study and those earlier described in the literature [16-18]. They found that LDA and BLR performed equally in determining the practical differences between groups.Contrary to expectations, the highest percentages of correct classifications of animals were observed for smaller sample sizes (≤ 100), using both LDA and BLR. However, in general, the present results showed that BLR was slightly superior and able to classify animals correctly than did LDA, particularly for smaller samples. As the results revealed, with the increase of sample size, the classification rate of the two methods become closer and the differences between the two models may be neglected. It is difficult to explain why smaller samples gave the greatest percentage of correct classification, but it may be due to the presence of outliers in the original dataset, and dealing with distribution-free explanatory variables. Inconsistent findings have been published about the performance of LDA and BLR with regard to sample size. For example, Wilson and Hargrave [19] reported that LDA was better than BLR when analyzing small size datasets. Moreover, Antonogeorgos et al. [10] concluded that the differences between LDA and BLR may be neglected if we have large sample sizes. They expected that small samples may lead to unstable and invalid estimates. The present findings are in accordance with the results of El-habil and El-Kazzar [6] who reported that the percent of correct classification was higher in LR than did LDA. They also, indicated that the variation in sample size has the same effect on the two analytical models.The present results seem to be consistent with other research findings. For example, a study was carried out by Zandkarimi et al. [20] for differentiation of normal and diabetic patients using both LDA and BLR. They demonstrated that the classification power was higher for BLR than LDA. Also, Liong and Foo [11] used real datasets to compare LDA and BLR on the basis of normality assumption, number of predictors, and sample size. They mentioned that in general, BLR denoted better results regardless the distribution of explanatory variables. However, they showed that the two methods perform equally with larger samples. On the other hand, Panagiotakos [21] and Antonogeorgos et al. [10] concluded that both LDA and BLR denoted the same predictive and classification model in the studies that have been conducted on outcomes from health problems. Dealing with veterinary data, one earlier study was performed by Montgomery et al. [22] to evaluate the two methods. The interesting finding of their study was the preference of BLR than LDA especially when the normality assumption and homogeneity of covariance matrices were not verified.The results of ROC curve and the area under the curve (AUC) can also be considered as another evidence for evaluating the performance and quality of the LDA and BLR. Taking sample size into account, it has been recommended that the clinical conclusions from ROC curves can be regarded if the sample size was 100 and more [23]. The findings of ROC curves of this study revealed that the impact of sample size was similar for LDA and BLR. Although, the AUC was something larger for BLR than LDA, the significant statistics for testing the AUC for both methods indicate that all AUC were significantly different from half. Therefore, it can be concluded that both LDA and BLR were strongly able to differentiate between Friesian cows and buffaloes, with regard to the nonnormal explanatory variables. Moreover, the results of Wilks' lambda and LRT for testing the overall performance of LDA and BLR confirm the conclusion that both methods are robust when using nonnormal data. Comparing the results of two methods according to AUC, the present findings agree with those has been reported by previous studies [6, 7, 24]. A recent study has been conducted by Ahmadi and Bahrampour [25] for examining the differences between LDA and BLR in predicting diabetes using real datasets. Their results showed that AUC for LDA and BLR were similar (0.801 and 0.803, for LDA and BLR, respectively). Similarly, Antonogeorgos et al. (10) reported AUC as 0.744 and 0.746, for LDA and BLR, respectively. In general, this study showed that changing the sample sizes lead to nearly similar results, for both LDA and BLR.
5. Conclusions
- In summary, the first finding that can be drawn from this study was that both methods have selected the same predictors for significant differentiation between studied breeds, using non-normally distributed data. The second major outcome was that the sample size has the same impact on LDA and BLR, regarding the percentages of animals being correctly classified and the area under the roc curve (AUC). Although, the percentages of correct classification were satisfactory throughout all sample sizes, BLR showed slight superiority and somewhat advantageous than did LDA. Taken together, these findings suggest that both LDA and BLR are helpful statistical methods in classifying dairy cows and buffaloes. In conclusion, this investigation provides additional evidence that LDA is robust technique for violation of normality assumption. Besides, researchers can ignore the differences between the two methods, if they have used large samples.