-
Paper Information
- Previous Paper
- Paper Submission
-
Journal Information
- About This Journal
- Editorial Board
- Current Issue
- Archive
- Author Guidelines
- Contact Us
International Journal of Statistics and Applications
p-ISSN: 2168-5193 e-ISSN: 2168-5215
2017; 7(5): 250-257
doi:10.5923/j.statistics.20170705.02

Using Factor Analysis for Residents’ Attitudes towards Economic Impact of Tourism in Nepal
 Abstract
 Reference
 Full-Text PDF
 Full-text HTML
Basanta Dhakal
Research Scholar, Central Department of Statistics, Tribhuvan University, Nepal
Correspondence to: Basanta Dhakal, Research Scholar, Central Department of Statistics, Tribhuvan University, Nepal.
| Email: |  |
Copyright © 2017 Scientific & Academic Publishing. All Rights Reserved.
This work is licensed under the Creative Commons Attribution International License (CC BY).
http://creativecommons.org/licenses/by/4.0/

Tourism is one of the fast growing industries and valuable sectors of Nepalese economy, which plays an important role in the development of communities in the Nepalese context. Keeping this point into consideration, this study attempts to examine residents’ attitudes towards economic impact of tourism in Nepal by conducting face to face field survey of 601 respondents from certain tourist destinations with response rate 91.76%. A questionnaire was designed to collect the data and the respondents’ level of agreement has been measured by five point Likert scale. In this study, factor analysis has been used to analyze the impact of tourism in economic development of Nepal. This study finds that the respondents have undergone with both positive and negative economic impacts of tourism. The results of this study also reflect that the development of tourism has helped most of the informants to improve their economic opportunities, sanitation, and livestock production along with the opportunities to utilize alternative energy. It has also caused for the significant rise in price of goods, land and housing. The factor analysis found that 67.84% total variance of perception of residents has been explained by positive impact of tourism and 59.39% total variance has been explained by negative impact of tourism.
Keywords: Economic benefits, Migrant’s dominance, Positive impact
Cite this paper: Basanta Dhakal, Using Factor Analysis for Residents’ Attitudes towards Economic Impact of Tourism in Nepal, International Journal of Statistics and Applications, Vol. 7 No. 5, 2017, pp. 250-257. doi: 10.5923/j.statistics.20170705.02.
Article Outline
1. Introduction
- The economic impact of tourism is generally perceived positively by the residents. First of all, tourism acts as an export industry by generating new revenues from external sources. A host nation will gain foreign exchange, which will contribute to improve the nation’s balance of payments [1, 2]. It decreases unemployment by creating new job opportunities [3]. Increasing demand for tourism encourages new infrastructure investment [4] and communication and transportation possibilities [5]. The amount of taxes collected by government will also increase with the higher level of economic activity. The local residents of a tourist hub might have a better standard of living and higher level of income by tourism activities.However, if not well planned and controlled, tourism may lead to negative impact or reduce the effectiveness of positive ones. The prices of goods and services might go up with the increased demand from foreign customers [6]. Increasing demand for accommodation, especially in tourism seasons, might push up the rents as well as the land prices for building new houses and hotels [7]. New revenues from tourism usually flow to the owners and businessmen while the residents suffer from increasing cost of living. This might cause a disparity in people’s income and employment opportunities thereby motivating people to migrate to the tourism areas. Numerous academic studies have been performed to identify residents’ attitude towards impact of tourism. Some of significant analysis on residents’ perceptions are Ross [8] for Australia; Mason and Cheyne [9] for Nezeland; Ritchie and Inkari [10] for England; Sanchez, Bueno and Plaza-Mejia [11] for Spain; Duran and Ozkul [12] for Turkey; Stylidis and Terrzidou [13] for Greece; Liu and Var [14] and, Wang and Chen [15] for USA; Xue, Kerstetter and Buzinde [16] and, Zuo, Gursoy and Wall [17] for China. The several studies illustrated that the respondents are facing both positive and negative impact of tourism. Tourism is one of the fast growing industries and valuable sectors of Nepalese economy. Moreover, it significantly plays an important role in the economic development of communities in the Nepalese context. Keeping this point into consideration, this study has made an attempt to examine the residents’ attitudes towards economic impact of tourism in Nepal using factor analysis. This study expects that the findings of this paper may facilitate the planners and decision makers to formulate the policies and programs for the local communities, who are involving in the Nepalese tourism business.
2. Methods
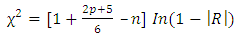
- Jinwoo Park and Misook Jung [18] have provided a method for determining a sample size under certain assumptions when the quantity of interest is measured by Likert scale.
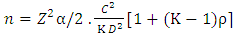 | (1) |
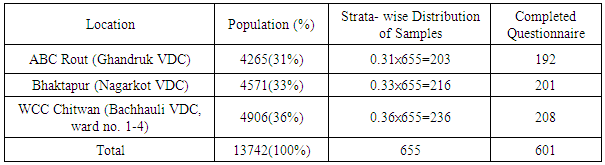
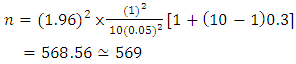 During data collection, stratified random sampling approach has been used to select the respondents that represent the whole group of population that lives in three tourist destinations: Annapurna Base Camp Rout (Ghandruk VDC), Bhaktapur (Nagarkot VDC), Wildlife Conservation Center Chitwan (Bachhauli VDC, ward number 1-4). Nepal is divided into three ecological zones: Mountain, Hill and Teari/Inner Terai. So, Ghandruk is taken as Mountain, Nagarkot is taken as Hill and Bachhauli is taken as Terai/Inner Terai. Assuming that 15% non-response rate, a sample of 655 residents has been randomly drawn from electoral rolls based on Constitution Assembly Election II, 2013 provided by ECN [19] using randomization technique. All adult members of the household were approached. The questionnaire was distributed door to door and this method was chosen because of its higher response rate than other methods [20]. If an individual refused to participate or could not present in his/her resident, the next member of same or neighboring household was intercepted and asked to participate [21]. The sampling frame has been designed to obtain a greater degree of representativeness from local residents to achieve a broad range of representation from the whole population. The actual population number in every location has been based on National Population and Housing Census of Nepal 2011, CBS [22]. The strata wise distribution of population and samples; and completed questionnaire are shown in the Table 1.
|
 | (2) |
 | (3) |
 | (4) |
 | (5) |
 | (6) |
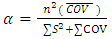
 is average covariance between the items. All the statistical analysis has been performed by using IBM*SPSS*statistics version 20.
3. Results and Discussions
3.1. Socio-demographic Profiles of Respondents
- In this study, the socio-demographic profiles of local respondents has been based on gender, marital status, education status, entrepreneur types, religion, cast/ethnicity, age in year, income level and family size. According to socio-demographic profiles of respondents, there was distribution of men and women with 54.4% and 45.6% respectively. Most of the respondents were married with 77.9%, while 19.3% were still unmarried and 2.8% were widow/widower. With regard to education background, 9.5% were still illiterate, 17.1% were literate without school, 18.8% were completed with primary education, 26.5% were completed with secondary education, 18.5% were completed with higher secondary education and 9.7% respondents had university degree. Similarly, 7.5% respondents were involved in home stay, 22.5% respondents were traders, 25.5% respondents were involved in hotel/guest house, 7.5% respondents were involved in restaurant, 25% respondents were involved in agriculture and animal farming, 6.2% respondents were involved in travel and tour agency, 6% respondents were not involved in tourism business. Most of the respondents were Hindus with 71.5% while Buddhists were 22.6% and Christian were 5.8%. With regard to caste and ethnicity, 24.9% respondents were in Brahmin /Chhetry /Dashanami group, 70.2% respondents were in Madhesi/Janjati/ Adibashi group and only 4.9% were in Dalit group. The age group of 38.3% respondents was in 21- 29 years old, 28.8% respondents was in 30-39 years old, 21.9% respondents was in 40-49 years old and 10.9% respondents was in 50 years and over. The income level of 44.6% respondents was less than 20(000NRS), 39.8% of respondents earned 20-40(000NRS), 8.9% of respondents earned 40-60 (000NRS) and 6.7% of respondent earned more than 60(000NRS). Similarly, 36.1% respondents had less than or equal 4 family members, 40.4% respondents had 5 to 6 family members and 23.5% respondents had more than 7 family members.
3.2. Positive Economic Impact of Tourism
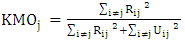
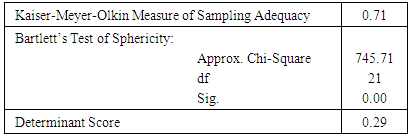
- The most important positive economic impact of tourism is economic benefits such as job opportunity, investment opportunity and increasing income level of people. Similarly, it positively impacts on standard living such as awareness of hygiene and construction of private toilet as well as development of livestock product and alternative energy. To analyze the positive economic impact of tourism, KMO measure of sampling adequacy, Bartlett’s test of Sphericity, and determinant score have been calculated to identify the suitability of the data set for operating the factor analysis.Table 2 shows the value of KMO statistic is equal to 0.71>0.6 which indicates that factor analysis is appropriate for the data. The Bartlett’s test is highly significant (p<0.001), and therefore there are some relationships between the variables. The determinant score is 0.29>0.00001 which indicates that there is an absence of multicollinearity. The Eigen values associated with each factor represent the variance explained by those particular linear components.
|
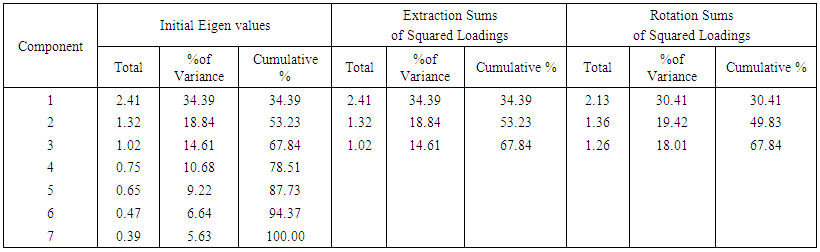 | Table 3. Initial Solution for Positive Impact of Tourism |
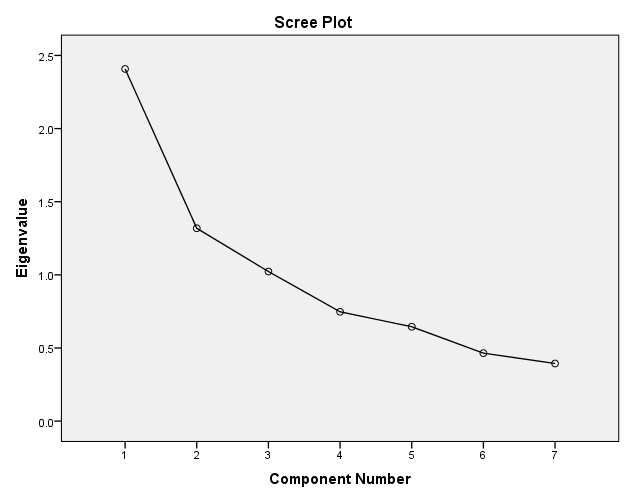 | Figure 1 |
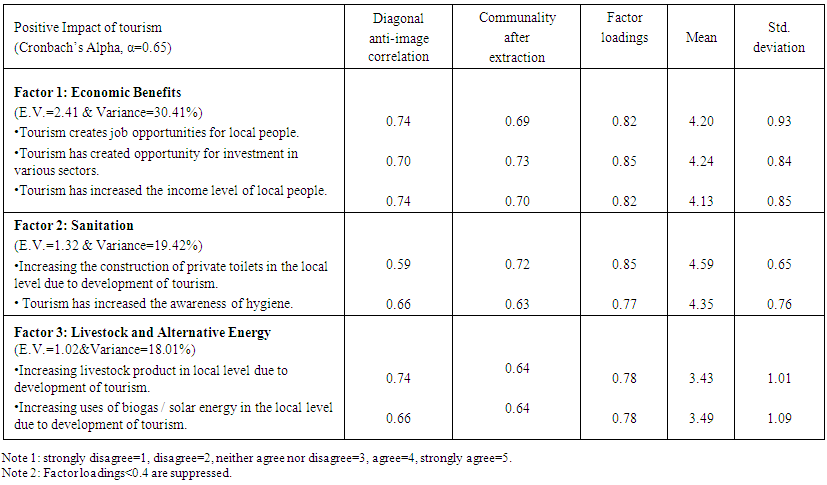 | Table 4. Summary for Positive Impact of Tourism |
3.3. Negative Economic Impact of Tourism
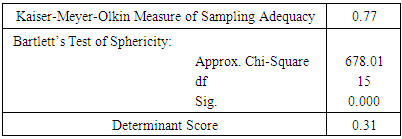
- However, if tourism is not well planned and controlled, it may lead to negative impact such as economic disparity and migrant’s dominance or reduce the effectiveness of positive ones. Due to tourism there is rising price of land, housing and goods as well as loss of arable land and disparity of people income. To analyze the negative economic impact of tourism, KMO measure of sampling adequacy, Bartlett’s test of Sphericity, and determinant score have been calculated to identify the suitability of the data set for operating the factor analysis. Table 5 shows the value of KMO statistic is equal to 0.77>0.6 which indicates that factor analysis is appropriate for the data. The Bartlett’s test is highly significant (p<0.001), and therefore there are some relationship between the variables. The determinant score is 0.31>0.00001 which indicates that there is an absence of multicollinearity. The Eigen values associated with each factor represent the variance explained by those particular linear components.
|
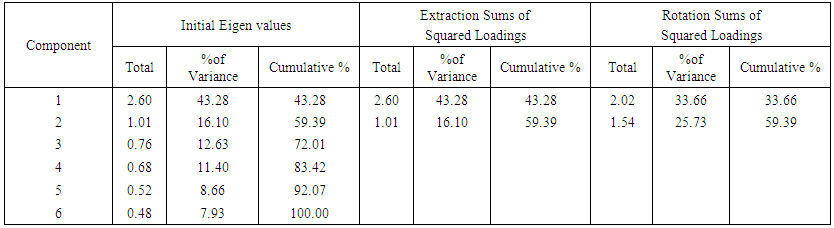 | Table 6. Initial Solution for Negative Impact of Tourism |
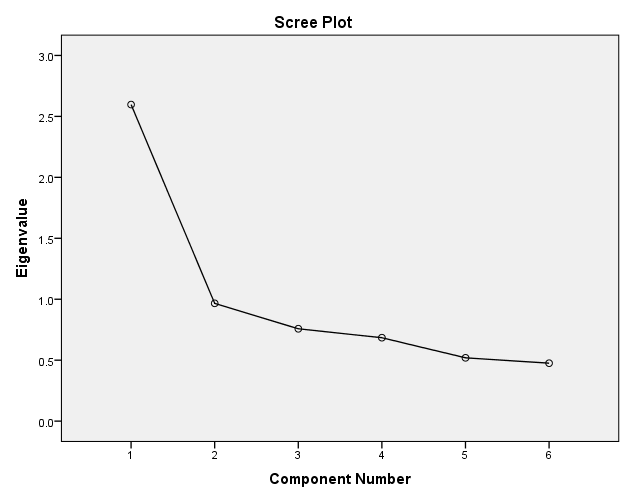 | Figure 2 |
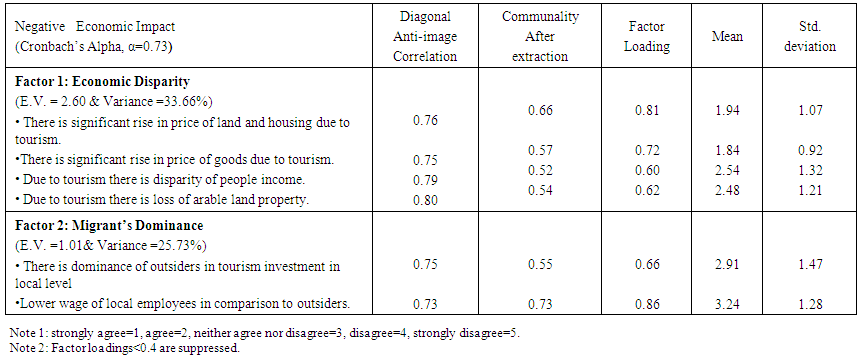 | Table 7. Summary for Negative Impact of Tourism |
4. Conclusions
- This study was initiated to investigate the residents’ attitudes towards the economic impact of tourism and assess their influences of tourism on the future tourism development in Nepal. The results of this study demonstrated that at a community level there is a strong support for tourism development. The study illustrated that the respondents are facing with both positive and negative impacts of tourism. The results of factor analysis found that three positive factors named as economic benefits, sanitation, and livestock product and alternative energy explained 67.84% variance of perception of residents. Similarly, two negative factors named as economic disparity and migrants’ dominance explained 59.39% variance of perception of residents. The results also indicated that the host community perceived that tourism development helps to improve their economic opportunities, sanitation, and livestock production along with the opportunities to utilize alternative energy. Similarly, they perceived that tourism development negatively impacts on the price of land and housing as well as price of goods. The local residents have neutral perceptions about disparity of people’s income, loss of arable land and dominance of outsiders’ in tourism development. It shows that tourism industries of Nepal are still not well planed and controlled but it has great potentiality for further development. So, effort should be made to promote the tourism industry as one of the most important industries which may play major economic role for sustainable development of local community.
ACKNOWLEDGEMENTS
- I would like to thank Prof. Dr. Azaya B. Sthapit and Prof, Dr. Shankar Pd. Khanal for their constructive supervisions of this study.