O. Ufuk Ekiz, Meltem Ekiz
Department of Statistics, Gazi University, Ankara, Turkey
Correspondence to: Meltem Ekiz, Department of Statistics, Gazi University, Ankara, Turkey.
| Email: |  |
Copyright © 2017 Scientific & Academic Publishing. All Rights Reserved.
This work is licensed under the Creative Commons Attribution International License (CC BY).
http://creativecommons.org/licenses/by/4.0/

Abstract
Fertility rate, the most important indicator of a population growth in a region or a country is defined as the ratio of actual births to number of women in reproductive age group. The purpose of this study is to create growth curve models (GCM) for fertility rates and then make predictions from these models for various age groups in cities of Turkey. To achieve this, we have used the data published online by Turkish Statistical Institute (TUIK). These city-based data consist of number of women with different ages and their healthy births in 2009-2015. However, multiple outliers in the data will negatively impact the estimators and predictions. To overcome these problems outliers should be purified from the data. By using GCM in the analysis of outliers we observed that outlying cities differ from other cities not only in fertility rates but also in socio-economic status. It is also observed that making future predictions with models containing all the cities (some of which are possible outliers) can be misleading in interpreting results.
Keywords:
Growth curve model, Outlier, Fertility rate
Cite this paper: O. Ufuk Ekiz, Meltem Ekiz, The Role of Outliers in Growth Curve Models: A Case Study of City-based Fertility Rates in Turkey, International Journal of Statistics and Applications, Vol. 7 No. 3, 2017, pp. 178-185. doi: 10.5923/j.statistics.20170703.03.
1. Introduction
Fertility rate for a country or any region is introduced as the ratio of number of actual births to number of women childbearing age during a year. Angeles pointed out that the issue of fertility rate and problems addressed within it has been discussing in the past few decades [1]. A high fertility rate is one of the indicators for high population growth which could have adverse effect on the economy of many countries. High fertility poses health risks for children and their mothers detracts from human capital investment, slows economic growth, and exacerbates environmental threats [1]. Moreover, the fertility rate depends on various demographic, social, and economic variables, such as age at marriage, level of educational attainment, socio-economic status, mode of living, active participation in the work force, exposure to contraceptive information and effect of conservative religious practices [2].In this paper we focused on considering the changes in fertility rates based on time, by fitting a model for various age groups in cities of Turkey. This allows us to make predictions about the future. A way to put this in practice is using growth curve models (GCM). However, existing outliers in the data would impact the model parameter estimates obtained from GCM and employing such a wrong defined model would negatively affect the future predictions. Hence, first outliers should be purified from the data which leads to better parameter estimates as well as more accurate predictions. Cities detected as outliers by an outlier detection method differ by many factors as mentioned above. Thus, in order to avoid problems, it is essential to take into account these factors for cities that causes to contradictions on fertility rates.The structure of the paper is as follows. In Section 2, we introduced the GCM used to model the changes in fertility rates for various age groups in terms of years. The method to detect the outliers, which are known that have a great impact on parameter estimates and predictions, is given in Section 3. Finally, in Section 4, by considering all cities we estimate the model parameters and make predictions for the future. Next, to emphasize the possible impact of outliers on the parameter estimates and predictions they are removed from the model and both the parameter estimations and predictions are repeated. The results obtained without outliers are given in Section 4.
2. Growth Curve Models (GCM)
The GCM, [3], is defined as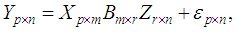 | (1) |
where X and Z are known design matrices of rank m < p and r < n, respectively, and the regression coefficient B is unknown. Furthermore, the columns of the error matrix are independent p-variate normal with mean 0 and common unknown covariance matrix  that is Y is a matrix- variate normal distribution. Hence,

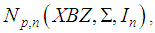 where XBZ is the expected value,
  and
and  are the covariance matrices of
  (i fixed and
  ) and
) and 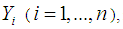 respectively, [3]. Usually, p is the number of time points observed on each of n cases. (m-1) is the degree of polynomial in time, and r is the number of treatment groups. Many real life examples of growth application for the GCM were investigated in literature (see, [3], [4], [5], [6]).Generalized least square estimator of parameter B in the model given in Equation 1 is
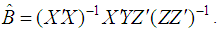 | (2) |
Furthermore, estimation of  parameter,
  based on
  is defined as
 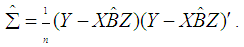 | (3) |
Suppose the covariance matrix  is of Rao’s simple covariance structure (SCR), i.e.,
 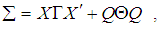 where both
  and
and  are unknown positive definite matrices, and
  in which
  is the orthogonal matrix space of X defined by
 | (4) |
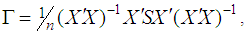
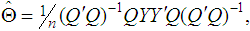
[7]. In this case maximum likelihood estimators of parameters  are
are 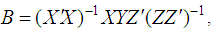 | (5) |
 | (6) |
 | (7) |
respectively. Here, 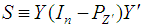 and
and  [5, 6].
3. Detect outliers in GCM
For detecting outliers in GCM with Rao's SCS, it is stated in [8] that the mean shift regression model (MSRM) can be used as one of the most common outlier-generating models. MSRM, [5, 6], | (8) |
where  is a mean shift parameter,
  is number of outliers, and
  is a matrix of indicator variables, depends on Rao’s SCS
  where
where  The ith column of
  which is denoted by
  is an n-variate vector with ith component equal to one and others zero,
  In [9] and [10] it is pointed out that the problem of outlier detection can be reduced to testing whether or not the mean of the population is actually shifted. For the GCM with Rao's SCS, this problem becomes testing if the mean shift parameter in the MSRM is zero. In other words, it is sufficient to test the hypothesis
  versus
  If the null hypothesis is rejected at size
  then the spurious observation set
  can be declared as k outliers at level
  (see [9], p. 28-30 and [10], p. 187-190).Theorem 1. [5, 6] For the MSRM with Rao’s SCS, the likelihood ratio test of level
  of
of  versus
  is equivalent to rejecting
  if
if | (9) |
where the constant  denotes the lower
  percent critical point of Wilk’s distribution
  and
and  Without loss of generality the index set can be assumed to be
  , therefore the response matrix Y can be partitioned into
  where
where  . Correspondently, the matrices Z and E are partitioned into
  and
and  , respectively. In this theorem
 and
and  [5, 6].Pan and Fang used
  and
and  in Theorem 1, and considered whether or not the ith observation (case) is an outlier [5]. According to one of Wilk’s distributional properties (e.g. [11]], the null hypothesis
  implies that
  | (10) |
under the null hypothesis  Therefore, the ith individual is declared an outlier if
  where
where  is the upper
  percent critical point of
  distribution, [5].
4. Estimation of GCM, Future Predictions and Outliers for City-based Fertility Rates in Reproductive Age-groups in Turkey
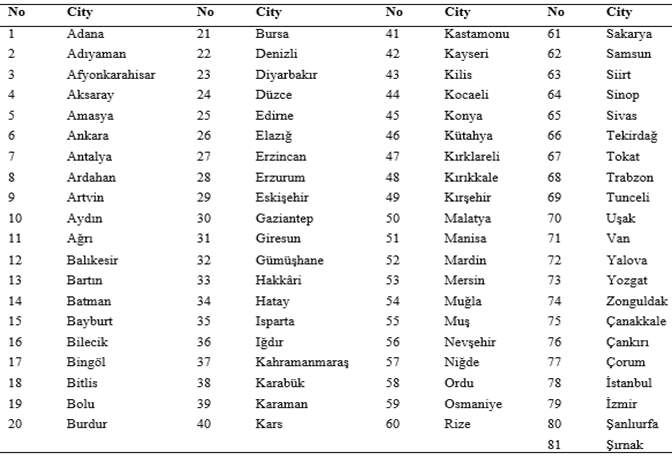
Here, we focused on constructing GCM and make future predictions by using them for fertility rates that have a great impact on population growth rate based on cities in Turkey. For this purpose, data which is published online by Turkish Statistical Institute (TUIK) is collected. This data consists of female population and the number of live births for different age groups in 2009-2015. The names and the corresponding numbers of the cities are given in Table 1.Table 1. Cities and numbers attained for them
 |
| |
|
In each city i the value of the dependent variable for jth year of a certain age group is denoted as  where
where  and
and 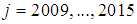 . Its value is obtained by ratio of live births to female population for the corresponding age group and city. The X matrix in GCM introduced in Equation 1 for years 2009-2016 and 2016-2020, 2025 are identified as
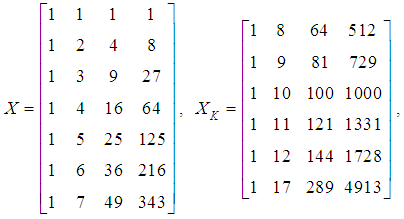 respectively. This is due to the fact that a third degree growth curve fits the data more accurately. Furthermore, Z is an n-variant vector with components of one,
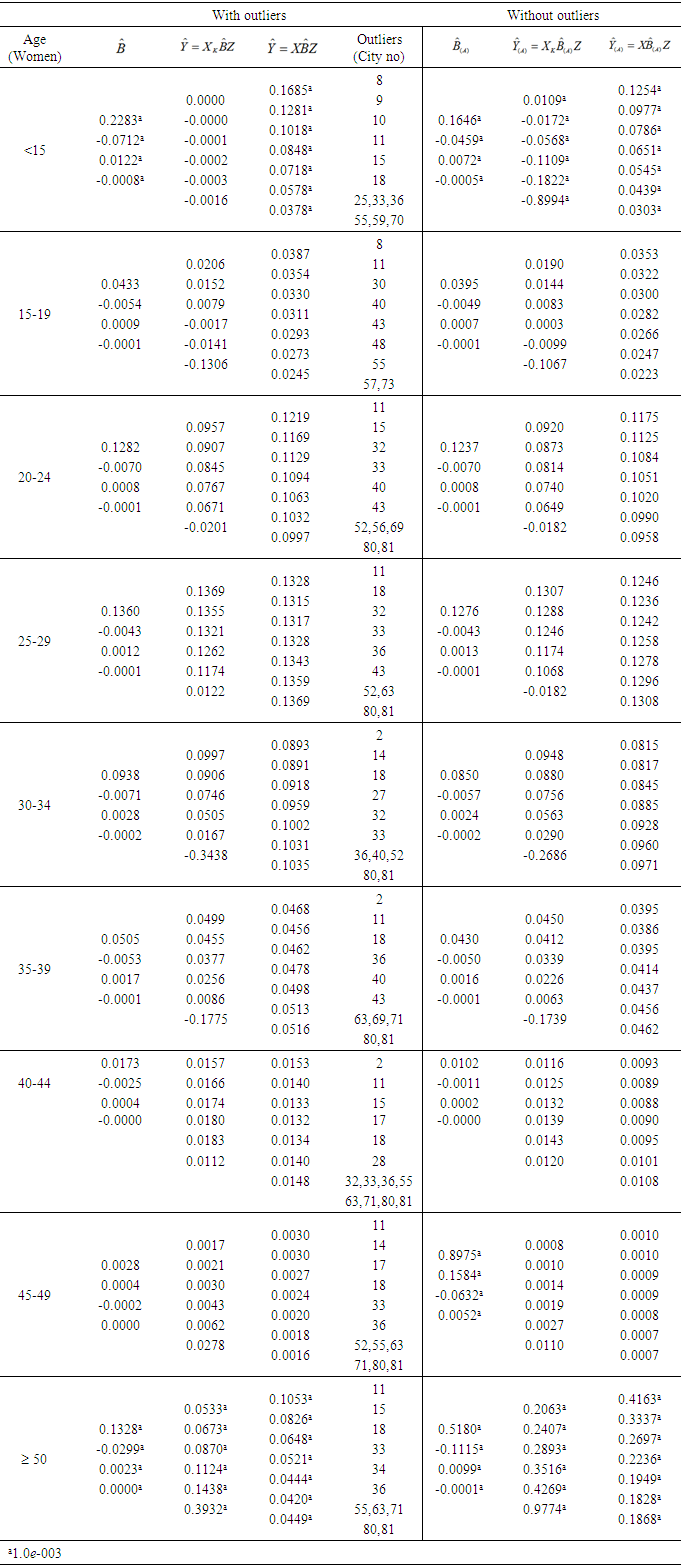
  Cities in Turkey differ with respect to fertility rates because of their various socio-economic developments. Hence, cities that differ on socio-economic properties with a great extent than the others may have an adverse impact on model parameter estimates. These observations are noted as outliers in statistics literature [8]. If these outliers are omitted from the data, the model fits the remaining data more accurately. The remaining data set which is not including outliers have similar socio-economic features. For this, determining outliers in each age group is more appropriate.Let A (outliers) denote a cluster including the order numbers of cities that are detected as outliers for every age group. To see the importance of outliers in future predictions of fertility rates in various age groups first we have estimated
  and then predicted
  and
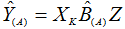
and  for years 2016-2020, 2025 and 2009-2015, respectively. Additionally, same steps are repeated for same years but without outliers in set A. These estimators are denoted as
  ,
,  , and
, and  . The results given in Table 2 show that
  ,
,  and
and  differ from
  ,
,  , and
, and  , respectively, thus outlying points have an impact on future predictions. Building a model that includes cities with high fertility rates (due to socio economic reasons) can be misleading. This makes clear that we have to build models for cities with similar socio-economic features. In this study, the outlying points of each age group are determined as cities with high or low socio-economic indicators. The impact of detected cities (outliers) on growth curves is our interest rather than building models by clustering cities with respect to their socio-economic developments. An evidence of the outliers effect on the estimates of the model parameter
  could be seen by considering the differences between
  and
and  (see Table 2).
Table 2. Estimations and future predictions
 |
| |
|
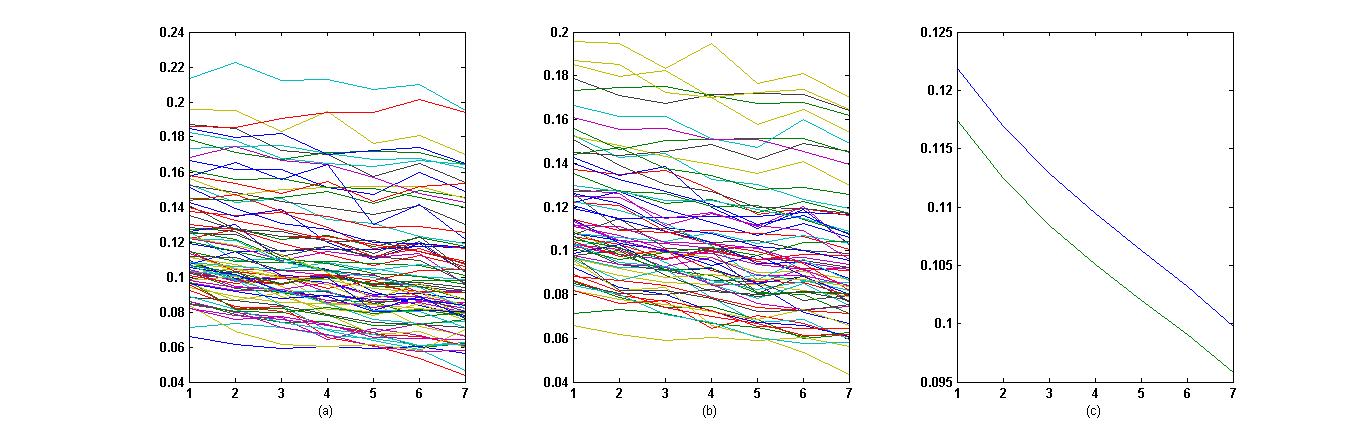
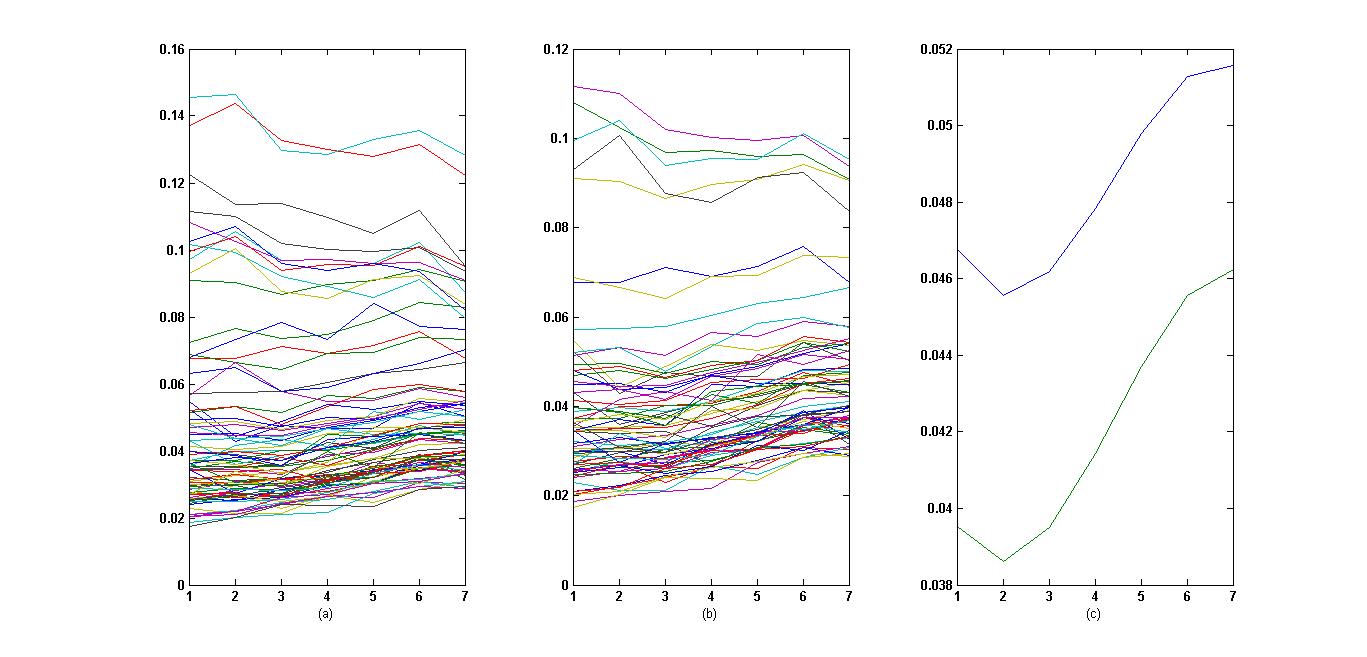
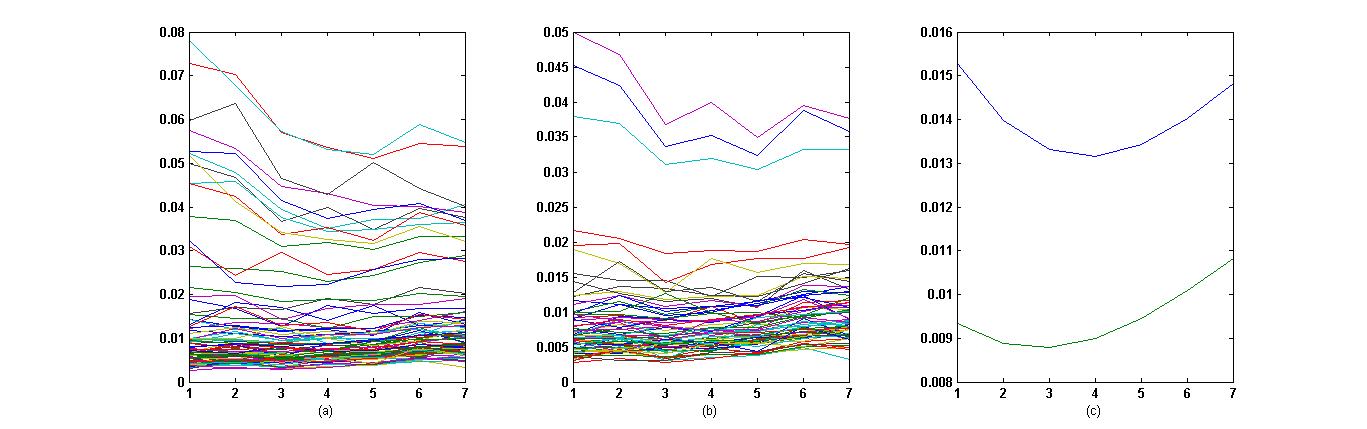
We next demonstrate figures (Figure 1-9) for each age group to show graphically the variations of fertility rates in years 2009-2015. In the x-axis, numbers 1-7 represents years 2009 to 2015, respectively. y axis represents the fertility rates. Also, in all of the graphical illustrations (a), (b), and (c) are plotted figures for fertility rates of all the 81 cities in Turkey, cities without outliers, and the means of fertility rates of cities with and without outliers, respectively. Growth curve for each city is plotted by a different colour as can be seen in figures (a) and (b). The figures in (c) are the estimates of the means of GCM with respect to with and without outliers and plotted as blue and green curves, respectively. By considering Figure 1c it’s observed that means of fertility rates decreases to women grouped as under 15 years. Furthermore, these rates decreases both for 81 cities and for cities with and without outliers numbered as 8-11, 15, and 18. By considering the data it’s observed that decreasing is much faster in high socio-economic developed cities. Means of fertility rates for women aged 25-29 seem to be increasing by 2010 (see Figure 4). In this age group cities numbered as 11, 18, 32, 33, 36, 43, 52, 63, 80, and 81 do have a great impact on the means. Though, this increasing structures are visible in Figures 5-7, it’s not observed for other ages groups (Figures 2, 3, 8, 9). Furthermore, we obtained that fertility ages in Turkey is generally between ages 25-44. In addition, rate of fertility under age 25 is also decreasing expect for outlying points (cities).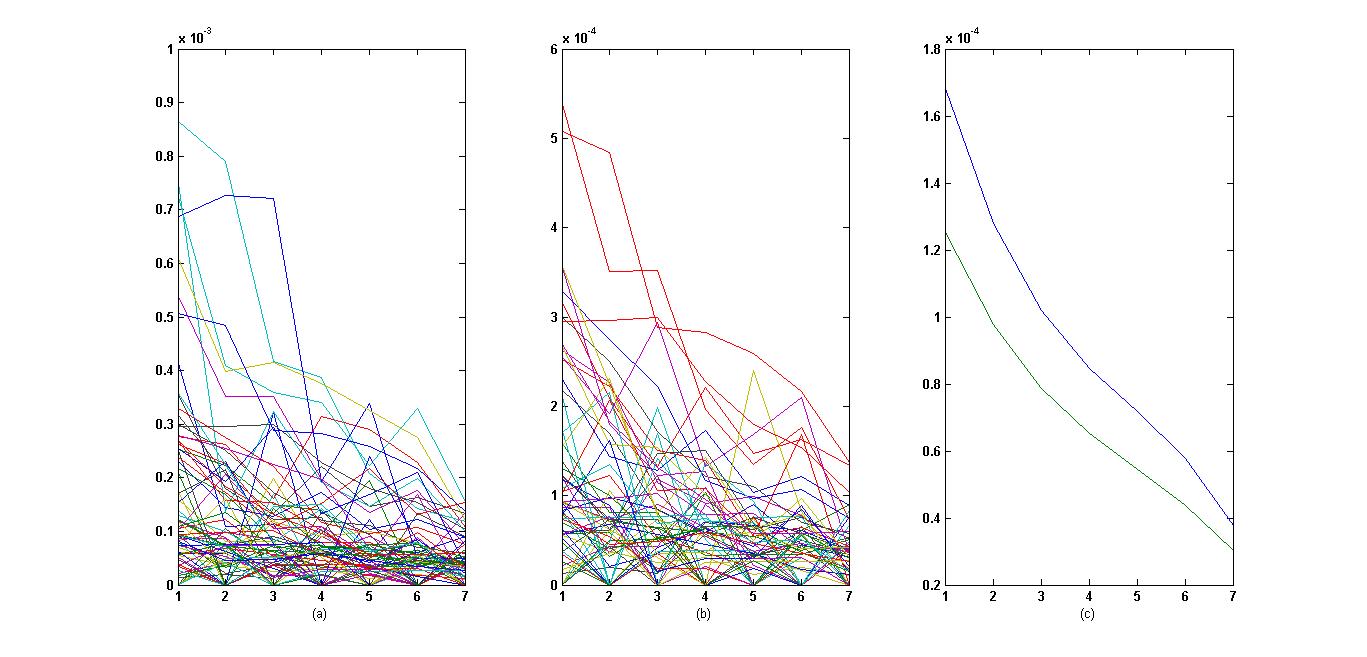 | Figure 1. City-based plots on; (a) fertility rates, (b) fertility rates without outliers, and (c) means of growth curves with respect to "with" and "without" outliers, to women aged under 15 in 2009-2015 |
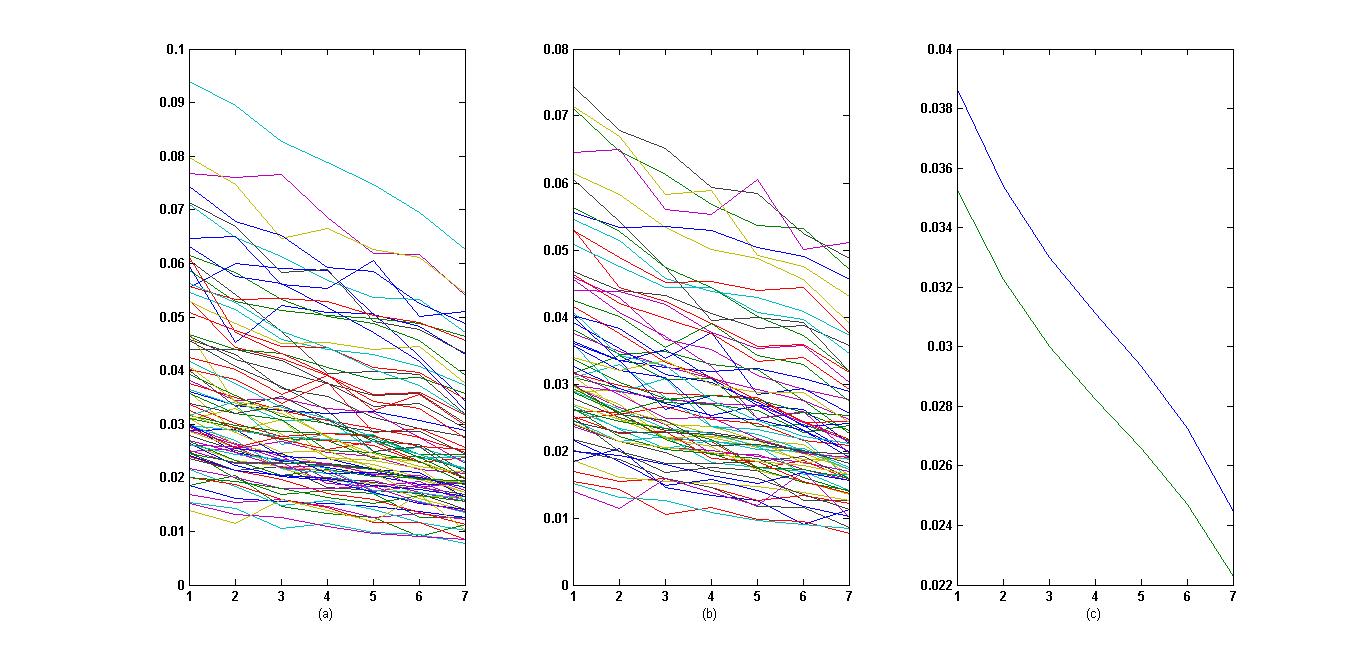 | Figure 2. City-based plots on; (a) fertility rates, (b) fertility rates without outliers, and (c) means of growth curves with respect to "with" and "without" outliers, to women aged 15-19 in 2009-2015 |
 | Figure 3. City-based plots on; (a) Fertility rates, (b) fertility rates without outliers, and (c) means of growth curves with respect to "with" and "without" outliers, to women aged 20-24 in 2009-2015 |
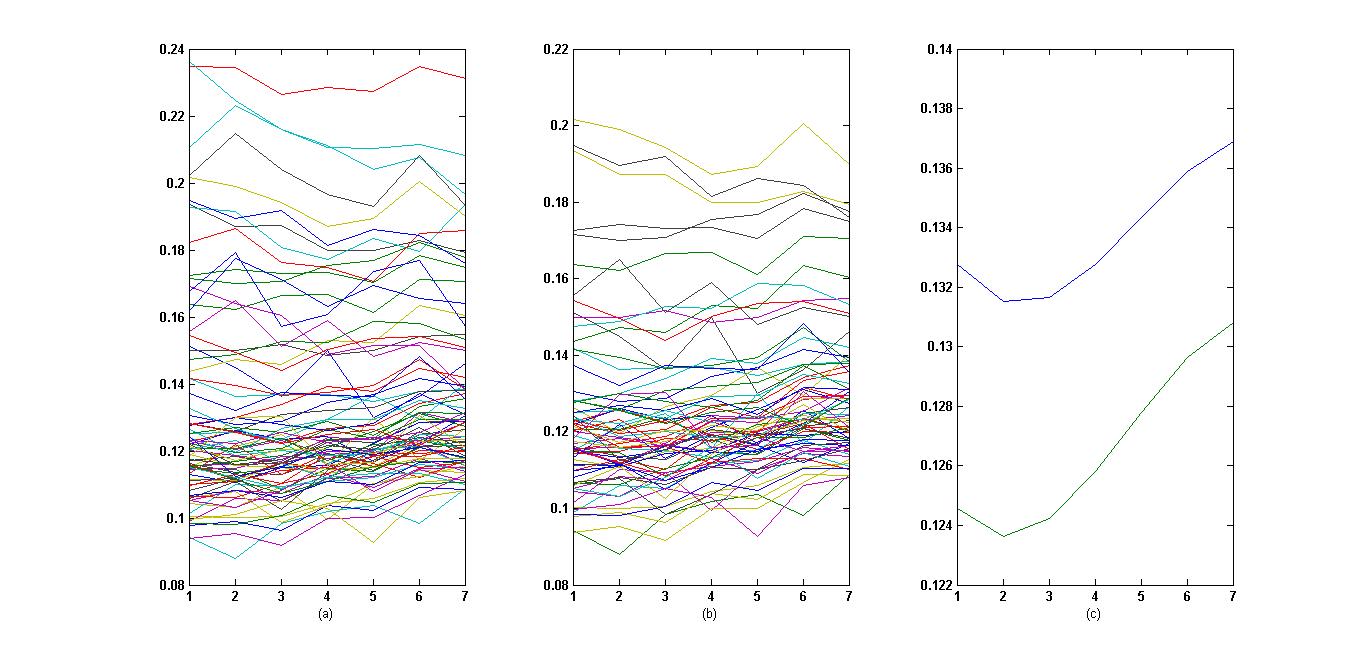 | Figure 4. City-based plots on; (a) Fertility rates, (b) fertility rates without outliers, and (c) means of growth curves with respect to "with" and "without" outliers, to women aged 25-29 in 2009-2015 |
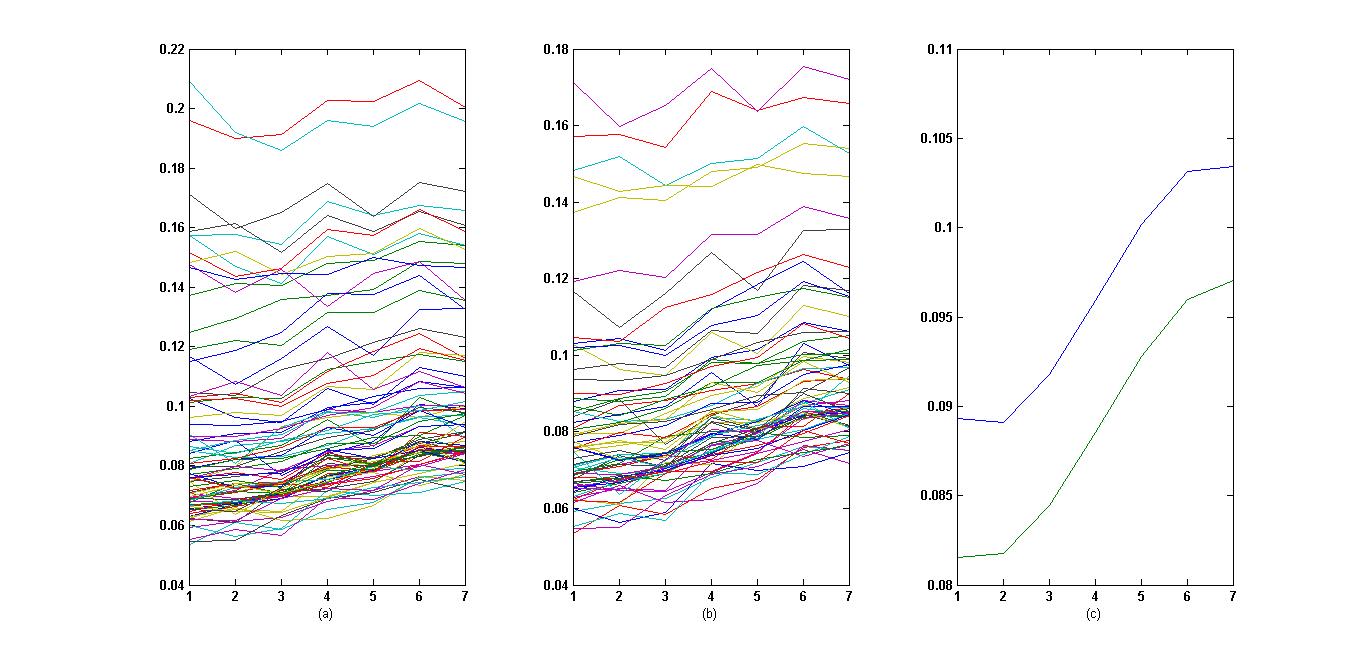 | Figure 5. City-based plots on; (a) Fertility rates, (b) fertility rates without outliers, and (c) means of growth curves with respect to "with" and "without" outliers, to women aged 30-34 in 2009-2015 |
 | Figure 6. City-based plots on; (a) Fertility rates, (b) fertility rates without outliers, and (c) means of growth curves with respect to "with" and "without" outliers, to women aged 35-39 in 2009-2015 |
 | Figure 7. City-based plots on; (a) Fertility rates, (b) fertility rates without outliers, and (c) means of growth curves with respect to "with" and "without" outliers, to women aged 40-44 in 2009-2015 |
 | Figure 8. City-based plots on; (a) Fertility rates, (b) fertility rates without outliers, and (c) means of growth curves with respect to "with" and "without" outliers, to women aged 45-49 in 2009-2015 |
 | Figure 9. City-based plots on; (a) Fertility rates, (b) fertility rates without outliers, and (c) means of growth curves with respect to "with" and "without" outliers, to women aged in 2009-2015 |
5. Conclusions and Discussion
In this study we focused on prediction of future fertility rates by GCM for various age groups in cities of Turkey. Unfortunately, outliers have a great impact on the model parameter estimates and also on future predictions. The effectiveness of these outliers is clearly observed when they are not used in future predictions of fertility rates that are known as the most using indicators of a population growth. Outlying points are found as cities that are weak with respect to socio-economic developments but, have high population rates in contrast to other cities. For this reason, build a GCM that is sensitive to the presence of outliers will be result as estimate the mean of the fertility rates much higher than they are in real.
References
| [1] | L. Angeles, “Children and life satisfaction,” J. Happiness Stud., vol. 11, pp. 523-538, 2010. |
| [2] | M. Atif, I. M. Janjua, A. Riasat, Dr. S. Akhtar, and G. Riasat, “The effect of socio-economic and demographic factors on fertility behaviour in Faisalabad (Pakistan),” GJHSSSociology, Economics & Political Science, vol. 12, pp. 7-11, 2012. |
| [3] | R. F. Potthoff and S. N. Roy, “A generalized multivariate analysis of variance model useful especially for growth curve problems,” Biometrika, vol. 51, pp. 313-326, 1964. |
| [4] | E. M. Keramidas and J. C. Lee, “Forecasting technological substitutions with concurrent short time series,” Journal of the American Statistical Association, vol. 85, pp. 625-632, 1990. |
| [5] | J. X. Pan and K. T. Fang, Growth Curve Models and Statistical Diagnostics, Springer Science & Business Media, Springer-Verlag New York, 2002. |
| [6] | J. X. Pan, “Discordant outlier detection in the growth curve model with Rao's simple covariance structure,” Statistics & Probability Letters, vol. 69, pp. 135-142, 2004. |
| [7] | C. R. Rao, “Least squares theory using an estimated dispersion matrix and its application to measurement of signals,” In: Proceedings of the Fifth Berkeley Symposium on Mathematical Statistics and Probability, Berkeley, Univ. of California Press, pp. 355-372, 1967. |
| [8] | V. Barnett and T. Lewis, Outliers in Statistical Data, New York, Wiley & Sons, 1984. |
| [9] | R. D. Cook and S. Weisberg, Residuals and Influence in Regression, New York, Chapman and Hall, 1982. |
| [10] | S. Chatterjee and A. S. Hadi, Sensitivity Analysis in Linear Regression, Canada, John Wiley & Sons, 2009. |
| [11] | G. A. F. Seber, Multivariate Observations, New York, John Wiley & Sons, 1984. |

 Abstract
 Reference
 Full-Text PDF
 Full-text HTML