Okonta C., Elem-Uche O., Madu C.
Department of Maths / Statistics, Akanu Ibiam Federal Polytechnic Unwana, Afikpo, Nigeria
Correspondence to: Elem-Uche O., Department of Maths / Statistics, Akanu Ibiam Federal Polytechnic Unwana, Afikpo, Nigeria.
| Email: |  |
Copyright © 2017 Scientific & Academic Publishing. All Rights Reserved.
This work is licensed under the Creative Commons Attribution International License (CC BY).
http://creativecommons.org/licenses/by/4.0/

Abstract
This paper is focused primarily on the application of Markovian analysis on Nigerian stock market weekly returns with the aim of describing the distribution of the market returns, investigating its trend, cross-checking if a current market return depends on its preceding market return and the time independence of the transition probabilities, investigating the probability of an investor earning return and the expected time a market return remains in a state before moving to another state. The data used in this study is a secondary data sourced from the official websites and bulletins of Nigerian Stock Market. The results of this study revealed that the distribution of the return is a leptokurtic Non - Guassian distribution. The returns of the NSE index exhibited on trend. The return follows a first order Markov chain where its current weeks return depends on its immediate weeks return. Also, the transition probabilities are independent of time. The returns of the Nigerian Stock Market index will go into steady-state at week eight. The study also showed that an investor can earn above the overall average weekly return on a short run but cannot earn above in the long run. In order words, when the very short time is considered, information in the past data is not fully reflected in present prices.
Keywords:
Markovian analysis, Stock market, Trend, Transition probability, Leptokurtic, Markov chain, Steady-state
Cite this paper: Okonta C., Elem-Uche O., Madu C., A Markovian Analysis of the Nigerian Stock Market Weekly Index, International Journal of Statistics and Applications, Vol. 7 No. 2, 2017, pp. 152-157. doi: 10.5923/j.statistics.20170702.11.
1. Introduction
When stock market is mentioned, the first thing that comes into our mind is that it is an important element of an economy. This is because stock market plays a vital role in the growth of key sectors of the economy and it ultimately affects the economy of the country. The stock market plays a primary role of supporting the growth of the industry and economy of the country, and it is also the measurement tool that gives the idea about the industrial growth as well as the stability of the economy with their performance (the rising index or consistent growth in the index is the sign of growing economy and the falling or high fluctuations in the index gives the impression of instability in the economy). Stock market also plays a significant role for the investor who wants to invest in the stock market to gain maximum return on his savings. Whenever any company wants to raise funds they float their shares into the market and raise funds from the investors who are keen to invest in the company. If the company is already listed in the stock market and wants to raise funds by floating their shares, they have two options available; either they offer their shares to the public or they offer the right shares to the existing shareholders. There are two types of investors that exist in the market; a bullish investor who invests with the expectation that stock price will rise, and a bearish investor who believes that financial market conditions are not conducive for gains and hence trades stock accordingly. Both types of investors want to take advantage of the movement of stock prices and to maximize their profits accordingly. The movement in stock prices is directly related to some fundamentals like performance of the company, movement in key macroeconomic variables and government actions.A number of studies showed that these stock market indices are affected by macroeconomic variables of the economy with respect to their intensity in different markets. Consequently, an investor wants to keep himself aware about the behaviour of the stock market with the result which is generated after the fluctuation of these key variables; an investor wants to know about the actions which he needs to take and the time when that decision gives him the maximum advantage; and an investor really needs to know about the right time to take the right action whenever these fundamentals produce something different.The stock market in recent time has been a landmine for investors. This is as a result of their inability to work with information available about the stock market, and this has resulted to loss of personal resources in the part of investors. It is for this reason that this paper gears towards applying the methodology of understanding the behaviour of the stock market returns with the aim of maximizing profit.Hence, this study aims at investigating:i. The distribution of the returns of Nigerian stock market ii. The trend of the returns of Nigerian stock marketiii. Whether the current stock market return depends on its immediate return and also whether its transition probabilities are independent of time.iv. The possibility of an investor earning above the overall average market return in the long-run.In the light of this study investors will gain insight on the behaviour of the stock market returns.
2. Literature Review
Rey et al., (2014) studied the detection of abnormal states in stock market returns. They considered seven indices over 21 years period; the Dow Jones, S & P 500, Nasdaq, Nikkei225, FTSE100, DAX and CAC45. They found that three states were possible, namely a state of high rate of return, a state of low rate of rate returns, both with high rate volatility and an intermediate state with low volatility. To determine the state of the market at each period, the returns were studied using Markov Chain Monte Carlo method, and using a Crammer’s coefficient, the association or correction was deduced among the different states of the major stock exchange market around the world. Firstly, the associations were globally stronger during the subprime crisis than during the dot.com bubble period. Secondly, among European markets Crammer’s V was higher regardless of the period, and thirdly, the associations between the Nikkei and the other market indices were systematically low indicating the relative disconnection of the Japanese market.Bialkowski (2004) modelled returns on stock indices for western and central European stock exchanges. A market switching mixture of normal distribution was applied to the monthly returns (the main stock indices) for emerging financial markets in central Europe. Additionally, the results were compared to those obtained for Western Europe. The result of model comparison suggests that the market switching mixture of normal distribution has substantially more descriptive validity than a single normal distribution. Nevertheless, there was no clear indication that in modelling monthly returns, the Markov – switching mixture of three normal distributions is superior to the mixture of two. The ability of the models, to describe returns during international financial crisis was evaluated.Bilgin (2005) used Markov chain methodology to treat whether or not the daily returns of the Istanbul stock exchange (ISE) 100 Indices followed a Martingale (random walk) process. The result for study holds the weak that at any given time, stock prices fully reflect all the available historical information.Chu et al., (2004) used Markov switching model to perform a robust test of the January effect in stock markets. An equally weighted (EWR) monthly New York Stock Exchange (NYSE) Index return covering the sample period January 1962 to December 1992 was used. It was discovered that there were five regions as it was been documented in the traditional January effect literature, though the inferential probabilities on these five regime classification, no evidence of the January effect was found for low capitalization stock portfolios.Sagaran (2011) provides evidence on the efficiency of the Kauala Lumpur stock exchange beyond the financial crisis of 1997 on Shariah and non Shariah complaint companies. A two state Markov chain model, a new approach in analysing stock efficiency performance in the local context, is used to analyse the efficiency of the stock returns. Nevertheless when the companion was made between Shariah and non Shariah base companies’ efficiency is very much superior to that of Shariah complaint companies. One possible reason to this observation is that the expanding Shariah complaint has taken into its fold more of efficiently performing companies. As a result, the Shariah base companies became more inefficient relative to the non Shariah. These findings suggest that this behaviour in Malaysia stock market only benefited the non-Shariah based companies’ efficiency in the long run.Jordanor (1998) tested the size effect in the London stock Exchange, using data for all nonfinancial listed forms from January 1985 to December 1995. The initial test indicates that average stock returns are negatively related to form size and that small from portfolios earn returns in excess of the market risk. Furthermore, the study tests whether the size effect is a proxy for variables such as the book-to-market value and the borrowing ratio, as well as the impact of the divided and the Bid- Ask spread on the return of the extreme size portfolios. The originality of the study is on the application of the Markov chain model to testify the random walk and Bubbles hypothesis and the vector Auto-regressive (VAR) frame work for testing the relationship of macroeconomic variables with size portfolio returns.Chang (2009) applied various regime switching GJR-ARCH Models to analyse the effects of macroeconomic variables (interest rate, dividend, yield, and default premium on stock return movement (including conditional mean, conditional variable and transition probabilities) in the US stock market, so as to clearly compare the productive validity of stable and volatile states, as well as compare the in-sample and out-of-empirical results shows that macro factors can affect the stock return dynamics through two different channels, and that he magnitude of their influences and returns and volatility is not constant. The effects of these three economic variables in returns are not time-variant, but are closely relate to stock market fluctuations, and the strength of predictability in a volatile regime is far greater than in a stable regime.
3. Methodology
3.1. Data Source
The data of the daily stock market index was obtained from the official websites and bulletins of Stock Exchanges. These daily market indexes were transformed to weekly index by obtaining the average market index per week. The weekly returns  were computed as a fraction or percentage change of the market index as:
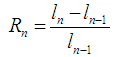 | (3.1) |
Where, In and In-1 are the market index value in week n and n – 1 (n = 1, 2, ..., 122) respectively.
3.2. Data Presentation
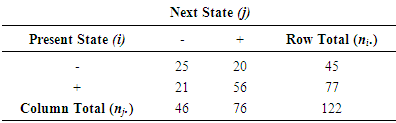
The weekly returns of the NSE Index can be classified and presented into two discrete state spaces namely; the negative return state which involves returns that are less than zero and positive return state which involves returns that are greater than zero.The various labelling are counted and their frequencies are presented in the table below.a. The period from January 03, 2014 to May 02, 2016Table 1. Frequency of transition from state one to another for the entire period
 |
| |
|
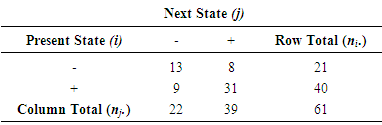
b. The period from January 03, 2014 to March 01, 2015 (First 61 weeks)Table 2. Frequency of transition from one state to another for the first 61 weeks
 |
| |
|
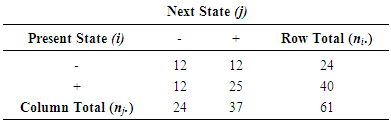
c. The period from March 04, 2014 to May 02, 2015 (Second 61 weeks)Table 3. Frequency of transition from one state to another for the second 61 weeks
 |
| |
|
3.3. Method of Data Analysis
The weekly returns of Nigerian stock market index data were analysed using Markovian analysis technique.
3.3.1. Markov Chain
A Markov chain is a class of a stochastic process in which the outcome of the experiment depends on the outcome of its past experiment. The Markov chain involves classifying a random variable into distinct discrete states Si. The process or random variable moves from one state to another state at different times. The Markov chain is based on some fundamental assumptions with unique properties. According to Heyman and Sobel (1982), the assumptions of a Markov chain are Countable Number of States, Markov Property and Stationarity, and the properties are irreducibility, periodicity, recurrence, ergodicity, and invariant distribution (Feller, 1950).According to Feller (1950), a sequence of trails with possible outcomes  is called Markov chain if the probabilities of the sample sequences are defined by
3.3.2. Descriptive Statistics
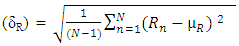
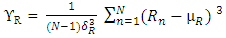
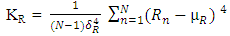
The descriptive statistics such as expected return (µR), standard deviation (δR), skewness (ϒR) and kurtosis (KR) were estimated for the purpose of describing the distribution. 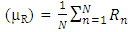 | (3.2) |
 | (3.3) |
 | (3.4) |
 | (3.5) |
 | (3.6) |
3.3.3. Estimation of Transition Probabilities from States i to j
The transition probability from state i to j according to Ross (1993) is defined mathematically as: | (3.7) |
Where  is the probability of transition from state i to j,
  is the frequency of occurrence of the transition from state i to j and
  is the total frequency of occurrence from state i to j. Its matrix is given as
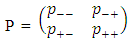 | (3.8) |
3.3.4. Test of Hypothesis
In these tests, the maximum likelihood ratio criterion prescribed by Anderson and Goodman (1957) was employed.a. Test of Markov property:This is to check if the current week’s return depends on its preceding week’s return.Ho: Pjj = Pj, the Markov chain is of a zero-order.H1: Pjj ≠ Pj, the Markov chain is of a first-order.Test statistic: 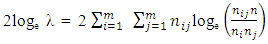 | (3.9) |
With degree of freedom = (m – 1)2, where m is the number of states.Decision rule: Reject Ho if -2loge 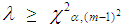 , otherwise accept.b. Test of Stationarity:This is to check if the transition probabilities are independent of time.Ho: Pij(t) = Pij for all t = 1, 2, ...,T. The transition probabilities are stationary.H1: Pij(t) ≠ Pij for all t = 1, 2, ...,T. The transition probabilities are not stationary.Test statistic:
 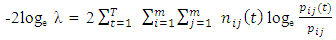 | (3.10) |
With degree of freedom = (T-1)(m)(m-1), where m is the number of states, T is the number of sub-intervals and nij(t) is the number of transitions from state i to j in the t-th sub –interval.Decision rule: reject Ho if 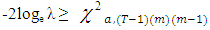 , otherwise accept.
3.3.5. Estimation of Limiting Probabilities
According to Ross (1993) the limiting probability is estimated as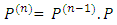 | (3.11) |
3.3.6. Estimations of Expected Long and Short-run Returns
Bilgin (2013) gave the determination of expected long-run returns as | (3.12) |
While that of short run as | (3.13) |
Where µR and µi are the expected long and short-run returns respectively, πj is the steady-state probability, Pn is the limiting probability and µi is the mean returns of state i.
4. Results and Discussion
4.1. Results of Data Analysis
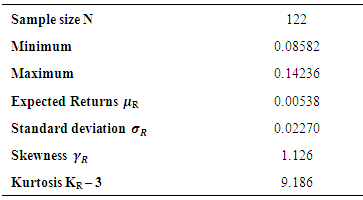
4.1.1. Descriptive Statistics of the Weekly Returns over the Entire Period
In describing the weekly returns for the period under investigation, the graph of the weekly returns Rn are plotted against the trading weeks as shown below.The results of the descriptive statistics of the weekly returns are estimated as shown below.Table 1. Descriptive Statistics for the weekly Returns
 |
| |
|
Also, the frequencies of the weekly Returns were plotted in a histogram to describe the distribution.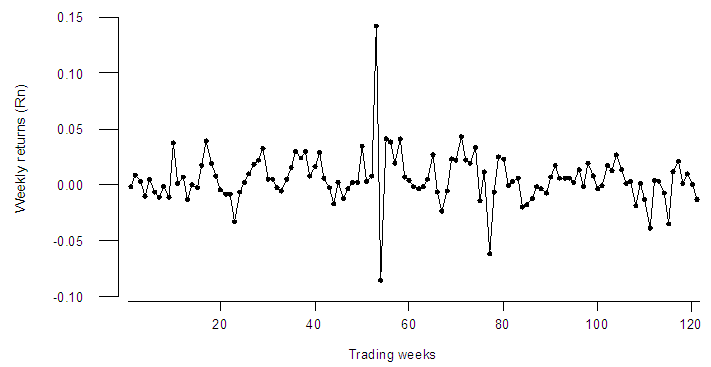 | Figure 1. Plot of Weekly returns against trading weeks |
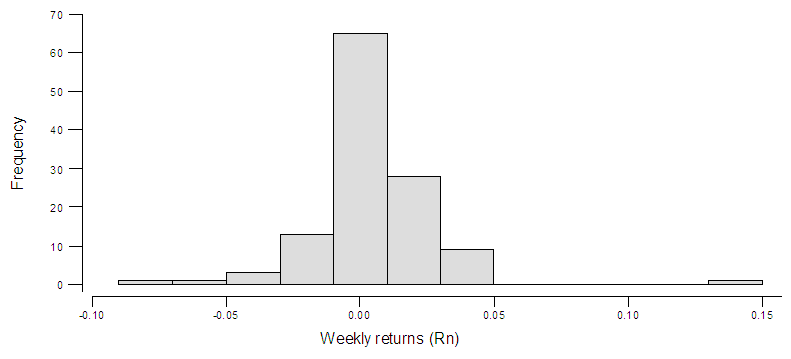 | Figure 2. Histogram of weekly returns |
4.1.2. Transition Probability Matrix of the Returns
The transition probability matrix of the weekly returns of the Nigeria Stock market index for the entire period P, first 61 weeks P1 and second 61 weeks P2 were obtained respectively as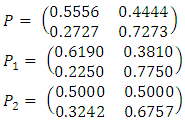
4.1.3. Tests for Markov Chain
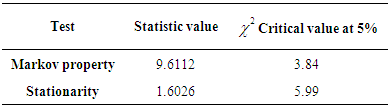 From the Markov property test performed, the maximum likelihood criterion statistic 9.6112 is greater than the critical
 value 3.84, thus, the alternative hypothesis that the Markov chain is of a first-order is accepted.Also, from the stationarity test performed, the maximum likelihood criterion statistic 1.6026 is less than the critical
  value 5.99, thus, the null hypothesis that there is stationarity (i.e. equal probabilities) is accepted.
4.1.4. Estimate of the Limiting Probabilities and Steady – State Probabilities
The limiting probabilities of the weekly returns were obtained as below 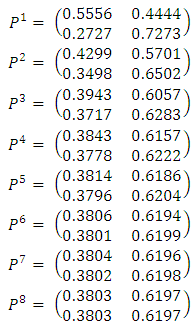 From the above probability matrices, the values of
  becomes fixed at the 8th transition (n = 8). These results indicates that there is a limiting probability that the return states will be in a steady state condition after 8 weeks and this probability is independent of the initial state of i.The steady – state probabilities of the returns of the Nigerian Stock market was estimated as (π- π+) = (0.3803 0.6197).
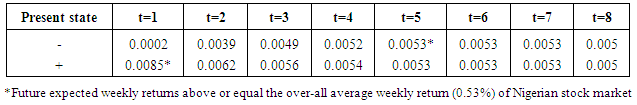
4.1.5. Estimate of the Future Expected Weekly Returns
The future expected return was estimated and the overall average return in long-run was found to be 0.53%. Thus, the future expected return at different weeks are shown below:Table 3. Calculated expected return after the t weeks given the present state
 |
| |
|
4.2. Discussion
The study focused on the application of Markov chain to the weekly returns of the Nigerian Stock Market. From the study, the analysis showed that the mean of the weekly returns is 0.00538, which is approximately equal to zero. This indicates no presence of trend (see Figure 1) and implies that the weekly returns of Nigerian stock market for the period were stable. With a skewedness value of 1.126, the weekly returns data seemed to be skewed to the right, and the excess kurtosis of 9.186 shows that the distribution of the weekly returns data has heavy tails. This implies that the distribution of the weekly returns of the Nigerian stock market is a leptokurtic Non – Guassian distribution. The Markov property tests carried out revealed that the returns follow a first – order Markov chain which implies that a week’s return depends only on its preceding week’s return. While, the stationary tests revealed that the transition probabilities of the return are independent of time which implies that at any point in time, the transition probabilities are equal. These two tests satisfy the assumptions underlying the application of Markov chain.The result showed that if the present state is a negative return, it is expected that the return will be equal to the overall average weekly return after five weeks and if the present state is a positive return, it is expected that the return will be above the overall average weekly return in the very short run – one week. This means that if an investor buys the Nigerian Stock Market index and it is in a negative state, he or she has to wait for five weeks without selling in order to realize return which is above the overall average weekly return. Similarly, if the state is positive, he or she will wait for one week only. Also, the result showed that the Nigerian Stock market index returns will go to a steady – state condition after eight weeks. For this reason investor’s expected return will be equal to the long – run average of the Nigerian stock market index regardless of the present state.
5. Conclusions and Recommendations
5.1. Conclusions
In this study, the Markovian analysis methodology was utilized. From the results of analysis obtained, we conclude that Nigerian stock market index (weekly returns) exhibits no trend, the distribution of the weekly return index is leptokurtic non – Guassian distribution, and that if the present state is a negative return, it is expected that the return will be equal to the overall average weekly return after five weeks and if the present state is a positive return, it is expected that the return will be above the overall average weekly return in the very short run – one week, and also that the Nigerian Stock market index returns go into a steady – state condition after eight weeks.
5.2. Recommendations
Following the conclusion of this study, we recommended that more research should be conducted on Nigerian Stock Market returns of individual common stocks and other investment instruments such as gold and foreign exchange returns, and that investors of the stock market should lay more emphasis on information concerning the stock market for good use of profitable opportunities.
References
| [1] | Anderson T. W., and Goodman L.A. (1957), Statistical Inference about Markov chains, Annals of Mathematics. |
| [2] | Bialkowki J. (2004), Modelling Returns on Stock indces for Western and Central European Stock Exchanges – A Markov Switching Model, South Eastern Journal of Economics (2): 81-100. |
| [3] | Chu J., Liu T. and Rathinasamy R., (2004), Robust Test of the January Effect in Stock Markets using Markov – Switching Model, Journal of Financial Management and Analysis 17(1): 22-33. |
| [4] | Feller W. (1950), AN Introduction to probability theory and its applications, John Wiley and sons inc., New York. |
| [5] | Heymanm, D. and Sobel M. (1982), Stochastic models in Operations Research. Vol.1, McGraw-Hill Inc., New York. |
| [6] | Jones P. W., and Smith P. (2009), Stochastic Process, Oxford University Press Inc. New York. |
| [7] | Jordanov J. (1998), The Size Anomalty in the London Stock Exchange: An Empirical Investigation, www.dspace.iboro.ac.uk/2134/7067. |
| [8] | Lawler G. F. (1995), Introduction to Stochastic Process, Chapman and Hall Publishers, New York. |
| [9] | Rey C., Rey S., and Viala J. (2014), Detgection of High and Low States in Stock Market Returns with MCMC method in a Markov Switching Model, Economic Modeling 41 (2014) 145-155. |

 Abstract
 Reference
 Full-Text PDF
 Full-text HTML