Hanaa Elgohari
Applied Statistics Department, Faculty of Commerce, Mansoura University, Egypt
Correspondence to: Hanaa Elgohari, Applied Statistics Department, Faculty of Commerce, Mansoura University, Egypt.
| Email: |  |
Copyright © 2017 Scientific & Academic Publishing. All Rights Reserved.
This work is licensed under the Creative Commons Attribution International License (CC BY).
http://creativecommons.org/licenses/by/4.0/

Abstract
As a matter of fact, both Multivariate Logistic regression (MLR) and linear discriminant analysis (LDA) are two major statistical models used for predicting group membership. Both models are used appropriately to predict a dichotomous dependent variable. Also, several applications have been done in this area. In this study, the missing data were treated by using fully conditional specification (FCS) and then, they were compared with efficient of (LDA) and (MLR) for the detection of anemic children with chronic kidney diseases. The comparison depended mainly on statistical criteria; apparent error rate AER and apparent correct classification rate ACCR. Also, a simultaneous method was used in case of discriminant analysis model to estimate the relation between dependent and independent variables (predictors) and for logistic function, the binary logistic function was employed for the detection of the relation and determining the best predictors for anemia. The study results showed that LDA is significantly more efficient than MLR in the accuracy of the prediction.
Keywords:
Fully conditional specification, Multivariate logistic regression, Linear discriminant analysis, Apparent error rate, Apparent correct classification rate, Anemia in children with chronic kidney diseases
Cite this paper: Hanaa Elgohari, Efficiency of Discriminant Analysis and Multivariate Logistic Regression for the Detection of Anemic Children with Chronic Kidney Disease, International Journal of Statistics and Applications, Vol. 7 No. 2, 2017, pp. 131-136. doi: 10.5923/j.statistics.20170702.09.
1. Introduction
The classification technique is crucial part of classifying different groups based upon defined characteristics, especially in the medical field. Multivariate data analysis is widely employed to classify this type of data. There are two well-known models (Multivariate Logistic regression (MLR) and linear discriminant analysis (LDA)) to predict relations between two or more groups, using a set of predictors. Alkarkhi et al. [1] and Krieng [6]. Both techniques were used and analyzed in many previous articles, books and papers. For example, compared DA and the LRA model in predicting method of surrender of an expectant mother, natural birth and caesarian section Montgomery. Balogun et al. [5]. Various real data sets that are different in terms of normality, the performance of both methods were studied by a number of independent variables and sample size. The two used methods are compare between the percentage of correct classification and B index. conclusively, LR is distinguished with better results, a way from the data distribution type. The aim of the study is investigating predictive group discriminant using (LRA) and (DA) to predict probability of patients with cancer who already had a medical check to determine the probability of having a breast cancer or not breast cancer. Krieng [6]. Undoubtedly, incomplete data can cause a real problem for most applied researchers. Many mechanisms were and still under developing up till now will continue to be developed to reach conclusions from data sets with missing values Balogun et al. [5]. Handling data requires a real and precise data resources to analyze it and to make deductions. Using regular pattern to collect with no outliers or missing values, which is not feasible all the time. Accordingly, it is important to assess the used information to achieve an dependent data analysis. The present investigation compares between MLR and LDA for classification of objects to groups after handling missing data. The accuracy of the prediction is mainly decided by apparent error rate (AER) and apparent correct classification rate (ACCR), and will be applied to real data of children patients who suffer from Chronic kidney disease.
2. Objectives of Study
The objectives of the present study may be summarized in the following four points:1- Handling missing data using (Fully conditional specification).2- Investigating differences between groups of the anemia, patient and to identify important discriminating variables of the anemia, on perform hypothesis testing once both those significance of the model and the significance of the independent variables Also to classify new observations under pre-existing groups.3- Estimating the relation between dependent and independent (predictors) variables and for the logistic function binary logistic function was used to detect the relation and determine the best predictors for anemia.4- Judging the accuracy of classification.
3. Data and Variables
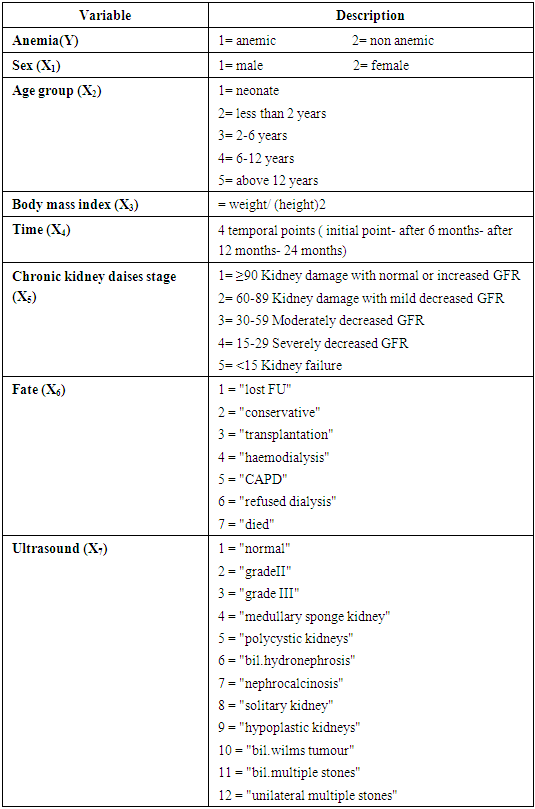
The 344 subjects selected for the conduction of this study were patients in the chronic kidney disease department of Mansoura University Hospital. All subjects who participated in this research were selected as they started to be admitted to hospital at the same time. The patients had incomplete data that will be treated using the method of (FSC). The independent variables were (sex, age group, Body Mass Index(BMI), CKD stage, time, fate, ultrasound) and the presence of anemia (dependent variable data was coded as 1 for anemic and 2 for non anemic). Data analysis was done using two approaches LDA and LR from SPSS software (Statistical Package for the Social Sciences), version 16, and for handled missing data was done using (FCS) from SPSS, version 20.Variables are explained in table (1). Glomerular filtrations rate (GFR) ml/min per 1.73m2 is used to determine (CKD stage).Table (1). Explanations of variables
 |
| |
|
4. Methodology
4.1. Fully Conditional Specification
The most popular method to multiply impute multivariate data having an arbitrary pattern of incomplete data is the chained equation method also known as fully conditional specification (FCS) that evenly imputes one variable at a time. The FCS approach is to impute the data on a variable-by-variable based on specifying an imputation model per variable. Elhabil et al [9]. In fact, there are three main episodes to treat the missing data:1) setting initial values for missing values in all variables  2) At iteration t, for j=1 to k: Given
  that is, most recently impute values of all other variables,
 and
and  for
for  , and then using a univariate method to impute all missing values in jth variable,
  3) To continue iteration until the maximum number of iteration is reached.
4.2. Discriminant Analysis
Discriminant analysis (DA) is a multivariate parametric statistical approach employed to establish a predictive model of group discrimination basis by observed predictor variables (factors), and classifying each observation to one of the groups to be discriminated. The analysis makes a discriminant function, which is a linear combination of the weightings and scores of variables that are considered. Van. [7]. This combination for a discriminant analysis, also called the discriminant function is derived from an equation which defined as the following: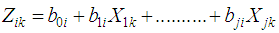 where:
 discriminant score of discriminant function i for object k,
 independent variable j for object
 discriminant weight for independent variable j and discriminant function i
 constant of discriminant functionand computational method is happening at about the same time estimation which includes computing the discriminant function so that all of the independent variables are considered concurrently.
4.3. Multivariate Logistic Regression
In fact, Logistic regression is the most popular modeling method when the dependent variable is dichotomous. The binary LR model is application when the response variable is divided into two categories. This model is mainly employed to figure out the relationship between one or more explanatory variables  and the dependent variable
  This model is determined by the following equation:
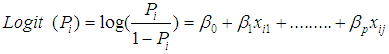
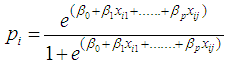 where,
  (explains the ratio of the probability of a success to the probability of a failure, is known as odds,
  are parameters to be estimated, and
  is the response probability for ith group, (j) expresses number of variables [1].
4.4. Criteria of Efficiency
The most leading thing when building a classification rule is to correctly. Little et al. [3]. An estimate of the error rate can be acquired by testing the classification procedure on alike data set which has been used to calculate the classification functions. This technique is usually make reference to as re-substitution. Ramayah et al. [8]. For two groups, around then observations in G1, n11 would effectively ordered under G1, and n12 are misclassified into G2, where n1 = n11 + n12. Similarly, of the n2 observations in G2, n21 need aid misclassified under G1 furthermore n22 need aid effectively classified into G2, where n2 = n21 + n22. Thus, the apparent error rate AER is presented as: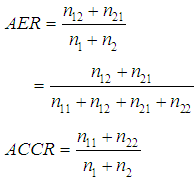
5. Results
The following chart shows the type of the missing data. Based on this figure, it can be noticed that the missing is (non monotone or Arbitrary). So, the suitable method to treat is (FCS) which was previously identified.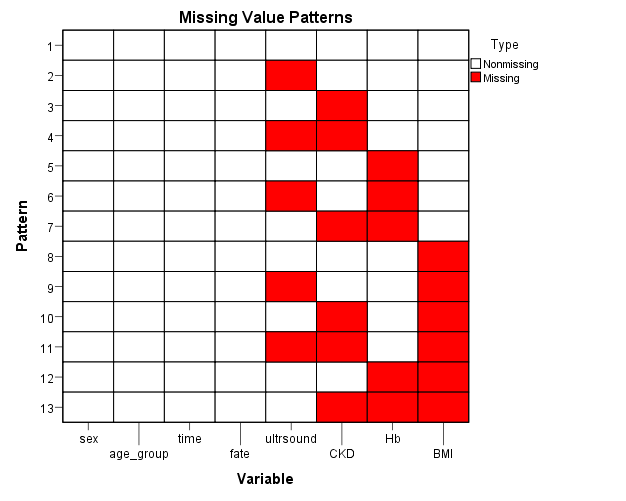 | Figure (1). Represents the type of missing data |
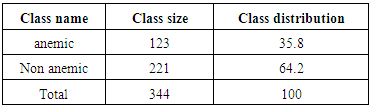
As is demonstrated in table 2, the sample size of the data is 344 observations and the data set were divided in to two groups where, the first group anemic with n1 = 123 which represents the 35.8% of observations, and the second group is not anemic with n2 = 221 which represents the 64.2% 0f observations.Table (2). Descriptive analysis for the variables
 |
| |
|
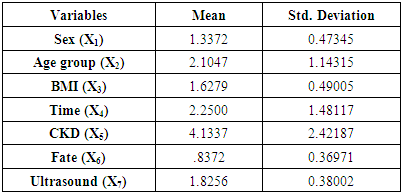
The main assumptions of DA were tested. Kolmogorov-Smirnov test statistic was used for testing normality of data and had a value of 0.414 with p-value <0.000. Depending on the significance level = 0.05, so, the data are not normally distributed and Box's M test used here to test the assumption of equality of covariance matrices and had a value of 9.12 with p value 0.000 indicates that the data do not differ significantly from multivariate normal.Table (3). Means and standard deviation for all variables
 |
| |
|
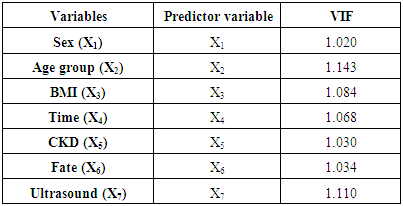
Table (4). VIF Values of Predictor Variables
 |
| |
|
Concerning of multicollinearity, high correlations should not be present among variables of interest. To perform this, the Variance Inflation Factor (VIF) index is employed, and a value of VIF >10 illustrate that multicollinearity is present all the VIF for the predictor is less than 10 which shows that there is no evidence of multicollinearity among the set of predictor variables or predictors. This means one can proceed with the analysis.
5.1. For Discriminant Analysis Model
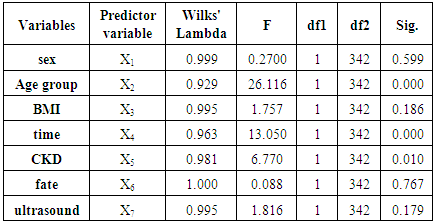
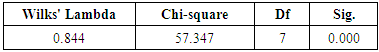
Wilks' Lambda can be used to measure of how well each function separates cases into births groups. From table 5, we can conclude that the discriminant function is significant in case of X2, X4, X5 and their function explains the group membership well.Table (5). Selection of Discriminating Variables Depending on Simultaneous Method
 |
| |
|
Table (6). Wilks' Lambda Table
 |
| |
|
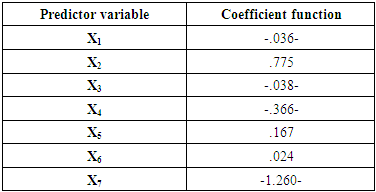
Table (7). Unstandardized Canonical Discriminant Model Coefficients
 |
| |
|
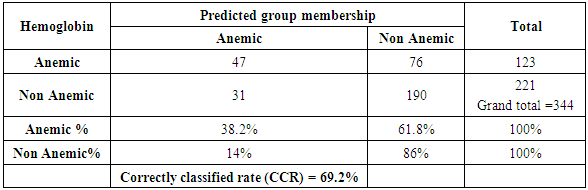
Unstandardized canonical discriminant function coefficients are used in the formula for making the classifications in DA, and function will be as follows:Z = 0.892 - 0.036(X1) + 0.775(X2) - 0.038(X3) - 0.366(X4) + 0.167(X5) + 0.024(X6) - 1.260(X7)The two performance criteria AER and ACCR were used to evaluate the efficiency of the discriminatory model of the estimated function. From table 8, it could be showed that 47 of 123 children from the anemic group have correctly been classified and 190 of 221children from the non anemic group have correctly been classified. It can be concluded that the DA was able to correctly classify 237 cases of patients out of 344 cases while, The AER was 29.8% and the ACCR was 69.2% indicating that the model has ability on classification.Table (8). The Final Classification Results
 |
| |
|
5.2. For Logistic Model
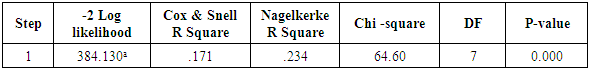
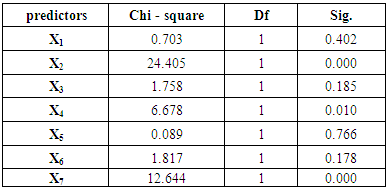
Table 9 clearly shows that -2log likelihood value of basic model was 384.13. The value of the Chi-square was 64.60 against the probability 0.000 showing that the model is significant and for this reason, the null hypothesis is rejected and the alternative hypothesis accepted. There is an obvious relationship between the predictors and the dependent variables.Table (9). Model Fitting Information
 |
| |
|
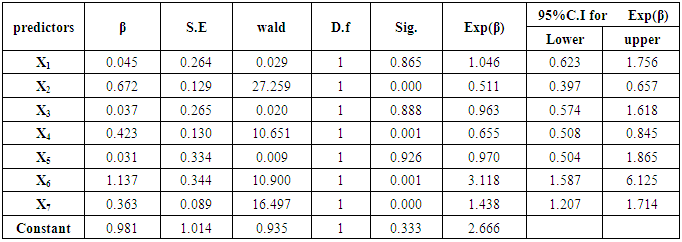
Estimation of the model parameters obtained by using Wald statistic for the final model are presented in the table 10 which gives the results of fitting the LRA model to anemia presence and presenting coefficients which are used in the formula for making the classifications in LRA. Also, the estimated logistic regression model is:Ln (π /1 – π) = 0.981 + 0.045(X1) − 0.672(X2) - 0.037(X3) − 0.423(X4) − 0.031(X5) + 1.137(X6) + 0.363(X7).Table (10). Result of LRT
 |
| |
|
Table (11). Results of Fitting the LRA Model to Births Data
 |
| |
|
Table (12). The Final Classification Results Using LRA model
 |
| |
|
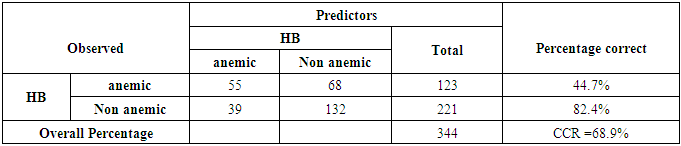
The two criteria of AER and ACCR have been used to evaluate the LRA model efficiency of the estimated function and we can see that 55 of 123 children from the anemic group have been correctly classified, and 182 of 221 children from the non anemic group have been correctly classified, it can be concluded that the LRA was able to classify cases of patient out of 237cases correctly. The AER was 31.1% and the ACCR was 68.9% indicating that the model has ability on classification.
6. Conclusions
The result of this study illustrated that LDA is significantly more efficient than MLR in the accuracy of the prediction. The missing data were treated by using fully conditional specification (FCS). The comparison between groups depended mainly on statistical criteria; apparent error rate AER and apparent correct classification rate ACCR. Also, a simultaneous method was used in case of discriminant analysis model to estimate the relation between dependent and independent variables and for the binary logistic function. The sample size of the data was 344 observations and the data set were divided in two groups where, the first group anemic with n1 = 123 which represents the 35.8% of observations, and the second group is not anemic with n2 = 221 which represents the 64.2% 0f observations. Kolmogorov-Smirnov test statistic was used for testing normality of data and had a value of 0.414 with p-value <0.000. The DA was able to correctly classify 237 cases of patients out of 344 cases. while, the AER was 29.8% and the ACCR was 69.2% indicating that the model has ability on classification. The LRA was able to classify cases of patient out of 237cases correctly. The AER was 31.1% and the ACCR was 68.9% indicating that the model has ability on classification.
References
| [1] | Alkarkhi AF, Easa AM. Comparing discriminant analysis and logistic regression model as a statistical assessment tools of arsenic and heavy metal contents in cockles. Journal of Sustainable Development 2008; 1:102-106. |
| [2] | Montgomery M E, White M E, Martin SW. A comparison of discriminant analysis and logistic regression for the prediction of coliform mastitis in dairy cows. Canadian Journal of Veterinary Research 1987; 51: 495-498. |
| [3] | Little R J, Rubin DB. Statistical Analysis with Missing Data. John Wiley & Sons. Inc: New York; 1987. |
| [4] | Zahra Sh, Naser M, Leila Sh, Parisa N. Prediction of Depression in Cancer Patients with Different Classification Criteria, Linear Discriminant Analysis versus Logistic Regression. Global Journal of Health Science 2016; 8(7): 41-46. |
| [5] | Balogun OS, Akingbade TJ, Oguntunde PE, An assessment of the performance of discriminant analysis and the logistic regression methods in classification of mode of delivery of an expectant mother. Mathematical Theory and Modeling 2015; 5:147-154. |
| [6] | Krieng K. Comparison Logistic Regression and Discriminant Analysis in classification groups for Breast Cancer. IJCSNS International Journal of Computer Science and Network Security 2012; 12 (5): 111-115. |
| [7] | Van BS. Multiple imputation of discrete and continuous data by fully conditional specification. Statistical Methods in Medical Research 2007; 16: 219–242. |
| [8] | Ramayah T, Ahmad NH, Halim HA, Zainal SR, May-Chiun Lo. Discriminant analysis: an illustrated example. African Journal of Business Management 2010; 4(9):1654-1667. |
| [9] | Elhabil A, Eljazzar M, A comparative study between linear discriminant analysis and multinomial logistic regression. An Najah University Journal research 2014; 28: 1528-1548. |
| [10] | Rencher AC: Methods of multivariate analysis, Second edition, John Wiley and Sons, Inc 2002. |

 Abstract
 Reference
 Full-Text PDF
 Full-text HTML