Collins Abaitey, Francis T. Oduro
Department of Mathematics, Kwame Nkrumah University of Science and Technology, Kumasi, Ghana
Correspondence to: Collins Abaitey, Department of Mathematics, Kwame Nkrumah University of Science and Technology, Kumasi, Ghana.
| Email: |  |
Copyright © 2017 Scientific & Academic Publishing. All Rights Reserved.
This work is licensed under the Creative Commons Attribution International License (CC BY).
http://creativecommons.org/licenses/by/4.0/

Abstract
This paper considers the modelling of a life table model for Ghana when her population becomes stable in the future. To do this, a Leslie matrix for Ghana is first determined. The Leslie model (which is an age-structured population projection matrix) is used to find the asymptotic growth rate, stable population and the stable age distribution (which forms the basis for actuarial computations). Life tables are computed from the stable age distribution and the survival curve compared with survival curves of other life tables to see the disparities. A life table (or mortality) model is estimated by fitting the survival curve of the generated life table to already existing mortality models. Ghana’s mortality model has been found to follow the modified De Moivre distribution with an estimated survival function 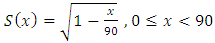 . It has been found that Ghana’s population would attain stability by the year 2030 with an estimated population of 43.8 million; comprising 49.6 percent males and 50.4 percent females. Life expectancy has been estimated to be 58years for males and 60years for females. Annual growth rate has been estimated to be 1.21%.
Keywords:
Actuarial values, Dominant eigenvalue, Eigenvector, Growth rate, Leslie matrix, Life table, Modified De Moivre model, Mortality model, Omega, Radix, Stable age distribution, Stable population, Vital rates
Cite this paper: Collins Abaitey, Francis T. Oduro, Estimated Life Tables and Mortality Model for Ghana, International Journal of Statistics and Applications, Vol. 7 No. 2, 2017, pp. 121-130. doi: 10.5923/j.statistics.20170702.08.
1. Introduction
1.1. Background
Life (mortality) tables are very useful demographic tools (Burch, 2003; Shyrock and Siegel, 1973). They are usually used to measure mortality experience and also to study the labour force dynamics of various populations (Kpedekpo, 1969). Even though they are extremely necessary, their estimation has always been very challenging, particularly in Africa; and this could mainly be attributed to data unavailability, inconsistency and inaccuracy.Whilst most developed countries have collected data on births and deaths for over one hundred years, many developing countries do not. The few data that one could lay hands on are only few decades old and do not represent a stable population, thus they may not give reliable future estimates (Murray, et al. 2000). Lack of these data implies the lack of accurate mortality values or tables which are needed by actuaries to compute correct premiums and good sum assureds for insurance companies and the insured. The currently available life tables for Ghana from the World Health Organization and the Ghana Statistical Service are ‘valid’ for only a year. Thus, there is always a need to develop new ones each year or within some few years, and this situation would not augur well for long term actuarial computations. In an instance whereby an individual buys a 20year life insurance policy, the insurance company would prefer a life table or mortality model that could span a period of 20years or more to one that could be applied for only a year. This necessitates the computation of life tables from stable population and not just from the current unstable population. The unavailability of data from accurately and consistently recorded births and deaths also means data-based approaches to life table estimation would not always give good estimates. It would therefore be necessary to use model-based approaches.
1.2. Life Tables and Actuarial Values for Ghana
There are a very limited number of available life tables for Ghana. World Health Organization constructed life tables for the years; 1960, 2000, 2010 and 2012, Kpedekpo in 1969 used the WHO’s 1960 life table to come up with working life tables for males and females and Ghana Statistical Service also constructed empirical life tables in the year 2010. All these tables were computed from census data with many adjustments, estimations and assumptions. Sometimes the correct ages of individuals are unknown, birth and death records are incomplete and not all individuals are even enumerated on a census day (Murray, et al. 2000).It is an ‘open secrete’ that actuaries usually adopt life tables from other countries, particularly South Africa, adjust them and use them to compute premiums, sum assureds, annuities and other actuarial values for insurance companies in Ghana. If researchers were to obtain reliable life tables for Ghana (especially ones from stable populations), they could probably see whether or not actuaries are really doing the right thing: perhaps insurance companies are charging more premiums, or they are paying far less than the actual benefits.
1.3. Leslie Models
The English biologist P. H. Leslie in 1945 introduced a model which uses the age-specific rates of fertility and mortality of a population to determine its dynamics. The model has been very successful in ecological study (Gonze, 2012), as it has been a useful tool for describing population dynamics of plants (Usher, 1969) and animals (Yu, 1990). However, it has not been used much when it comes to humans, particularly in the area of life table estimations.Why would one think of using the Leslie model to generate life tables? Life tables normally involve birth and death rates and stable population (especially in the case of period life tables); and the Leslie model already contains these values. Again, in an instance where the population is not yet stable, the Leslie model could be easily used to generate the future stable age distribution. Actually, the Leslie model is capable of generating both the unstable and stable part of any population. It could as well be used to project the age distribution of a population into the future. When all these have been said about the Leslie model, it would be necessary to add that in the developing parts of the world (e.g. Africa) where data is mostly inaccurate and unavailable, it would not be advisable to use a method which extensively involves or depends on data, since that may be difficult and may not produce good estimates. The Leslie model, however, only needs a few parameters and once they are robustly determined, could be used to obtain good estimates. The matrix basis also makes its usage quite straightforward.
2. Method
2.1. Definition of Leslie Model
The Leslie model could be defined as a deterministic, age structured, linear difference equation model. It is used to determine the growth pattern and age structure of a population. The model involves the use of matrices and it is presented as a projection model as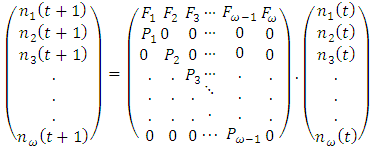 | (1) |
and mathematically as 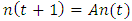 ; with
  being a population vector having elements
  ,
,  representing the number of individuals in each age class at time t and
  being a population vector in the following year. A is the
  (female only) Leslie matrix or ‘projection matrix’ having fertility rates
  on its first row and survival probabilities
  on its leading sub-diagonal and all other elements being zeros. From the matrix and mathematical models above, when one multiplies the Leslie matrix by a population vector, one obtains the population vector for the following year, and when the model is used repeatedly for say
  times then the model mathematically becomes
 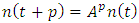 . Thus, one can use an initial population vector and a Leslie matrix to obtain the population vector (age distribution) of the population at any time in the future.An extension of the basic Leslie matrix is the two-sex model that allows one to capture the number of both males and females in the population from age zero to the maximum possible age (Caswell 2001). Let the vector
 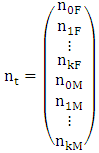 represent the number of females
  and males
  of age
 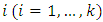 in the population at time t.
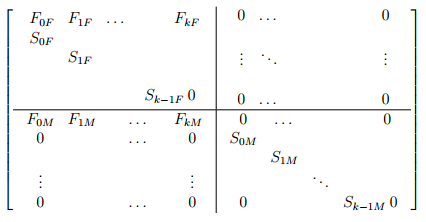 | Figure 1. Structure of a two-sex Leslie matrix |
The projection matrix for the two-sex model can be written as which is of the size  when
when  unique age classes are involved. This matrix has been sub-divided into four
  sub-matrices (Millspaugh, et al. 2009). Where:
  and
and  and
and represents the age-specific survival rates for females at age i,
 represents the age-specific survival rates for males at age i,
 represents the age-specific fertility rates for females at age i (that is female producing female offspring) and
  represents the age-specific fertility rates for males at age i (that is female producing male offspring).The Leslie matrix model can be generated by estimating the vital rates which are obtained from the continuous survival and fertility functions. The survival function
  defines the possibility of a person surviving from birth to age x. The fertility function
  defines the expected number of female offspring produced by an individual of age x at a unit time.
2.2. Parameter Estimation
Human survival depends on the age of the individual within usually a year, say from age x to  , and where the individual’s age is known
  (Kot, 2001) and when the age is unknown (Caswell, 2001), then
  can be approximated by averaging over the interval
  . Thus,
  , where
  is the number of individuals alive in age group i to
  in the stationary age distribution.Human fertility is obtained from the distribution of births and deaths in the age class, and it is given by
  , which is the number of children produced in the following year multiplied by the survival probability. Note that
  was taken as
  for the calculations in this work (see appendix).
2.3. Dominating Eigenvalue and Properties of the Stable Vector
The Leslie matrix is an  matrix and so there are n possible eigenvalues and eigenvectors which would satisfy the equation
  , where
  is any eigenvalue and
  is an eigenvector corresponding to
  . The eigenvalue which is highest positive with its corresponding eigenvector indicates the long term dynamics of the population – growth rate and stable age distribution. This eigenvalue is called the dominant eigenvalue. After obtaining the dominant eigenvalue using the equations
  , where I is the identity matrix, one would have: when
  , the population is stationary,
  , population is increasing and when
  , the population is decreasing. Thus
  is now and later anywhere in this article considered as the dominant eigenvalue.
2.4. Stable Age Distribution
A population growing based on the Leslie matrix will have an age composition which is entirely determined by its Leslie matrix and does not depend on its initial composition after a period of time. Then from some future year, the following year’s population will be a multiple of the year in question i.e.  (Li, 1994). This age composition is called stable age distribution. The multiple
  is the dominant eigenvalue of the Leslie Matrix and if e the associated eigenvector, then a stable age distribution can be obtained from e. Let
  and
and  , then the vector S is called the stable age distribution of the population, where S is given by
  (Cullen, 1985). With this, a period life table could be computed by first using this age distribution as
  values by taking
  (radix). Other columns of the life table could be obtained from the
  values (see section 2.5).
2.5. Description of a Life-Table
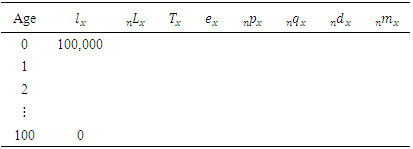
A typical life table look like Table 1 (where  ).
).Table 1. Illustrative life table
 |
| |
|
 = number of people left alive at age x. It isobtained from the stable age distribution vector S.
 = person-years lived between ages x and
 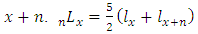 .
. = person-years lived above age x.
 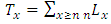 .
. = expectation of life at age x.
  .
. = probability of surviving from age x to
 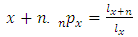 .
. = probability of dying between ages x and
 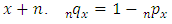 .
. = number of people dying between ages x and
 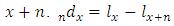 .
. = age-specific death rate between ages x and
 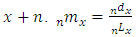 .
.
3. Results
3.1. Data Description
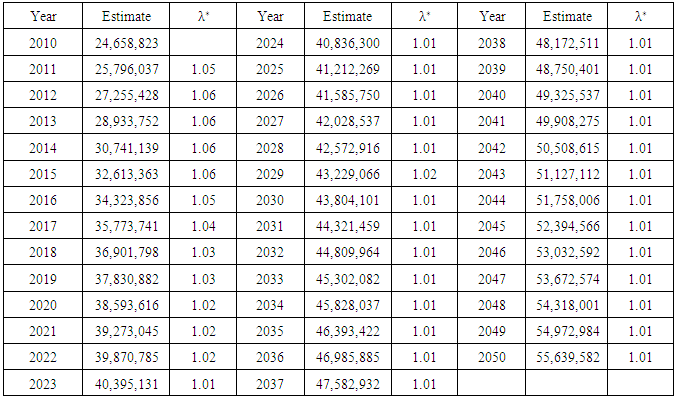
Data was obtained from the World Health Organization (WHO) and Ghana Statistical Service (GSS). Parameters of the two-sex Leslie matrix (see Figure 1 and Appendix; Table A1) were obtained (or calculated) from existing life tables (WHO 2012 life tables for Ghana) and population census data reports, with some adjustments (see Appendix; Tables A2, A3 and A4 ). 2010 age distribution (Table A4), being the base year (initial population vector nt), MATLAB code was used to generate the growth rate, stable age distribution and a projected population. Life tables for males, females and both sexes were also computed from the stable age distribution (by using formulas in section 2.5). A  of 1.0121 which is approximately 1.01 (2 decimal places) was obtained as the growth rate. A radix of 100,000 and an omega of 90 years were used for the life tables (see Tables 2, 3 and 4).Thus, Ghana’s population is expected to experience an annual percentage growth rate of 1.21.Using
  ,
,  is always equal to
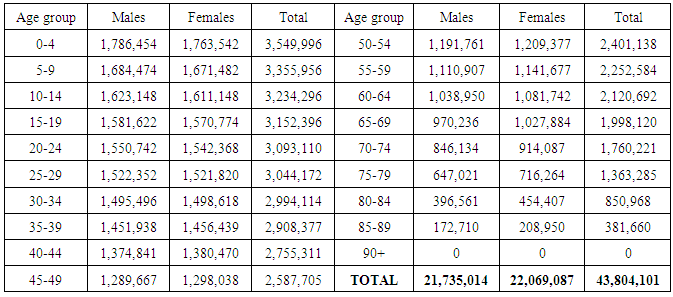
  from 2030 and beyond (approximating to 2 decimal places). Thus, according tothe generated Leslie model and projected population, Ghana’s population will converge to stability by year 2030 with an estimated growth rate of 1.01. Table 6 shows the age distribution in the year 2030.
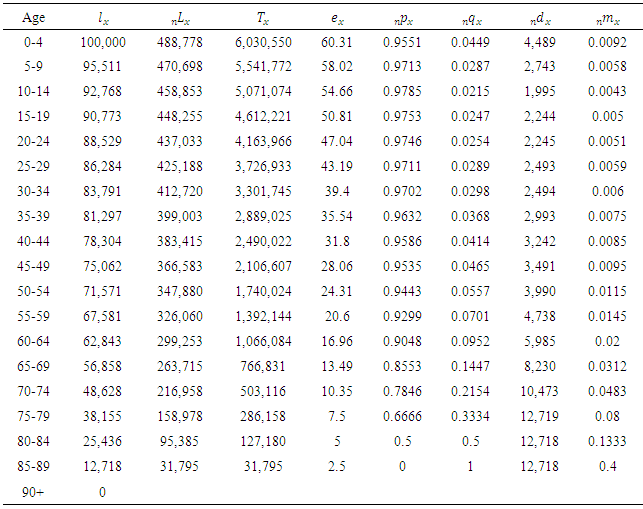
Table 2. Estimated life tables (Males)
 |
| |
|
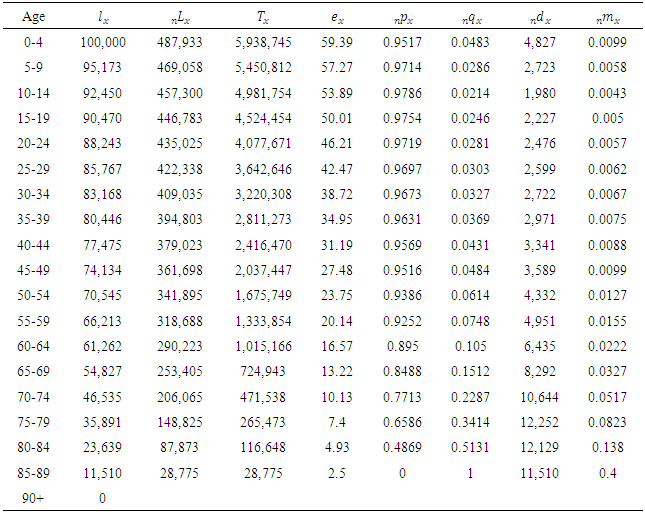
Table 3. Estimated life tables (Females)
 |
| |
|
Table 4. Estimated life tables (Total Population)
 |
| |
|
Table 5. Projected Population and ‘Growth Rate’
 |
| |
|
Table 6. Estimated Age Distribution for the year 2030
 |
| |
|
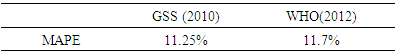
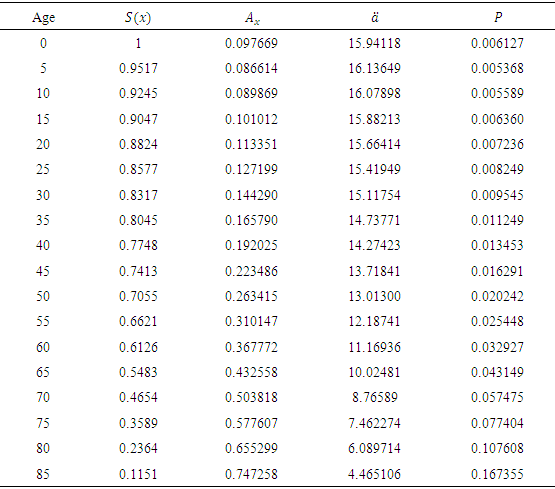
3.2. Comparing Survival Curves and MAPE
The various survival curves in Figures 1 and 2 were plotted from empirical data computed from GSS 2010 empirical life tables for Ghana, WHO 2012 life tables for countries in the world and from the estimated life table (Total Population; Table 4) by using  .
.Table 7. MAPE
 |
| |
|
The Mean Absolute Percentage Error (MAPE) is computed to find the error between the survival curves by using the formula 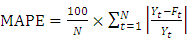 . The lower the measure, the better the prediction (Fomby, 2008).
Table 8. MAPE
 |
| |
|
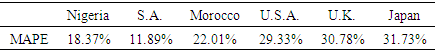
The survival curve of the estimated life table (Total Population) is close to GSS 2010 curve for Ghana, and WHO 2012 curve for South Africa since they have comparatively low MAPE values.From Figures 1 and 2, one could observe that GSS and WHO use omegas above 90 even though their curves show high child mortality rates. This may contributeto higher life expectancies from their life tables. Their omegas and life expectancies are hardly realistic, particularly in developing African countries where infant mortality happens to be high. It would therefore be better if their omegas are reduced.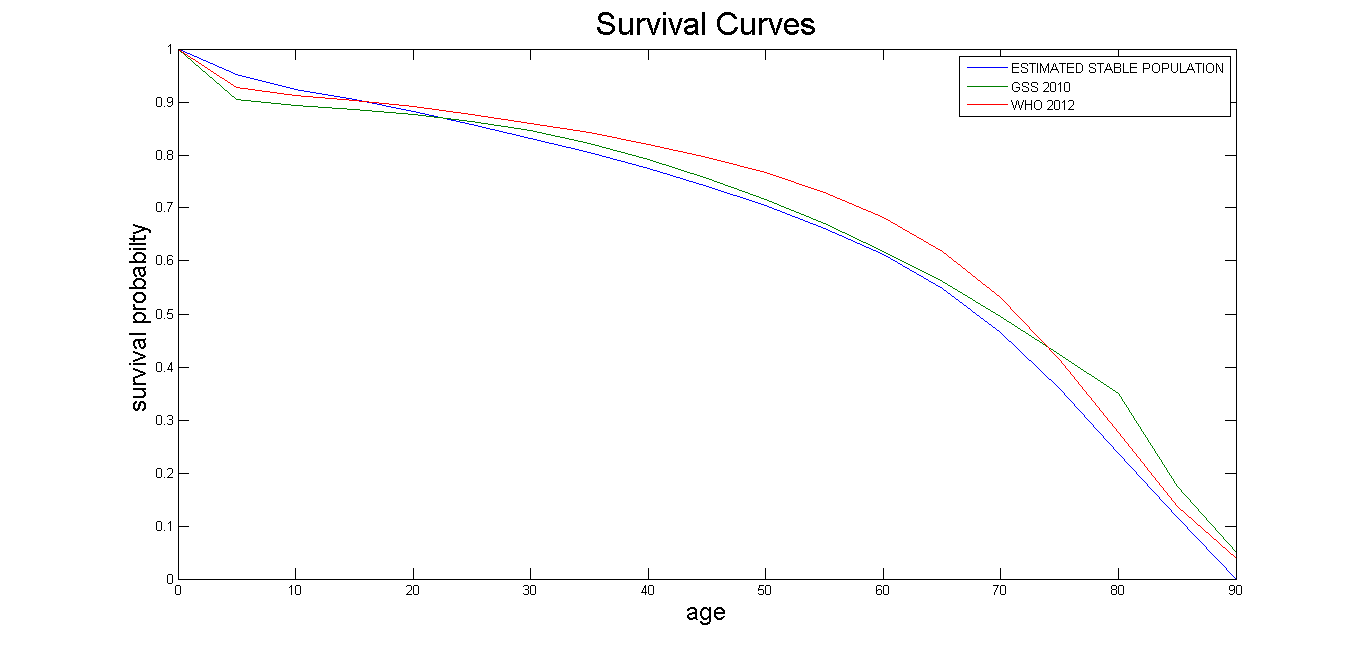 | Figure 2. Survival curves for Ghana |
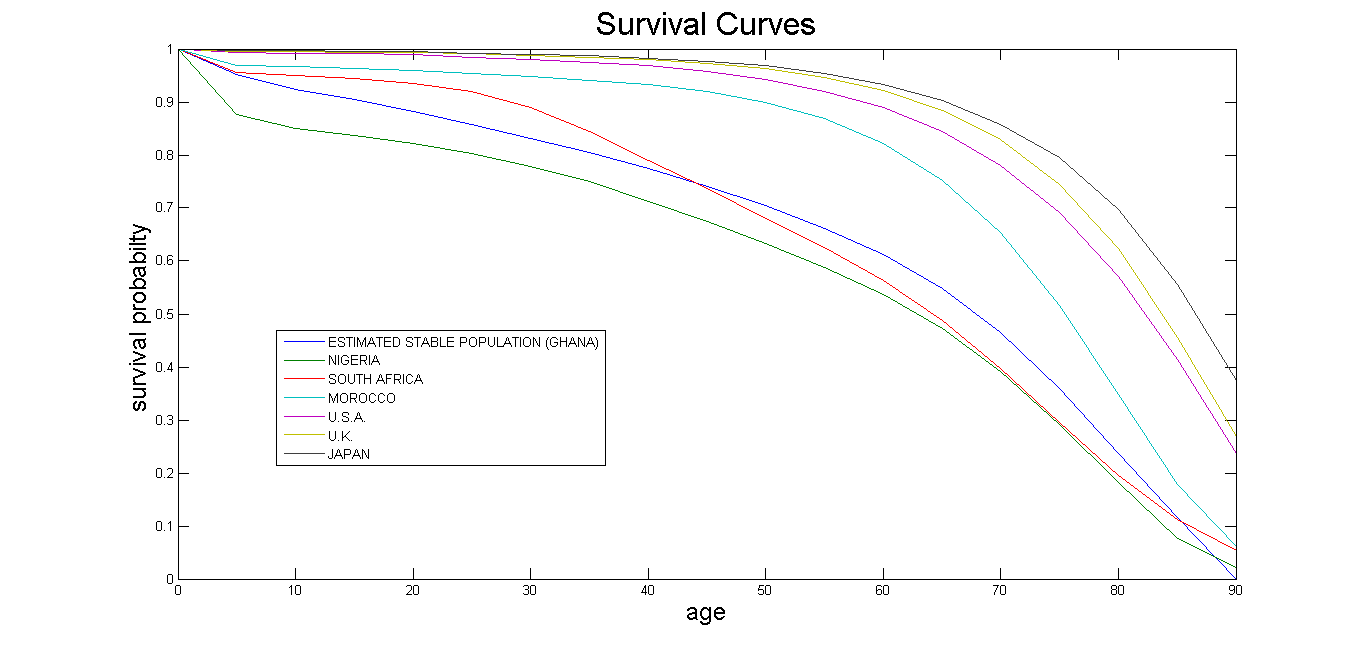
3.3. Distribution Fitting
The survival curves for the various probability distributions were plotted from empirical values by defining their parameters such that the ages range from 0 to 90. For the De Moivre,  (i.e. a uniform distribution with
  ). For the exponential distribution,
  . For the normal distribution,
  . For the Weibull function,
  .
.Table 9. MAPE
 |
| |
|
Survival probability,  , is the probability that an individual survives from birth to exact age x.De Moivre model:
 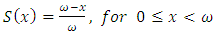 Exponential model:
 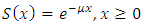 , where
  .Normal distribution:
  .Weibull distribution:
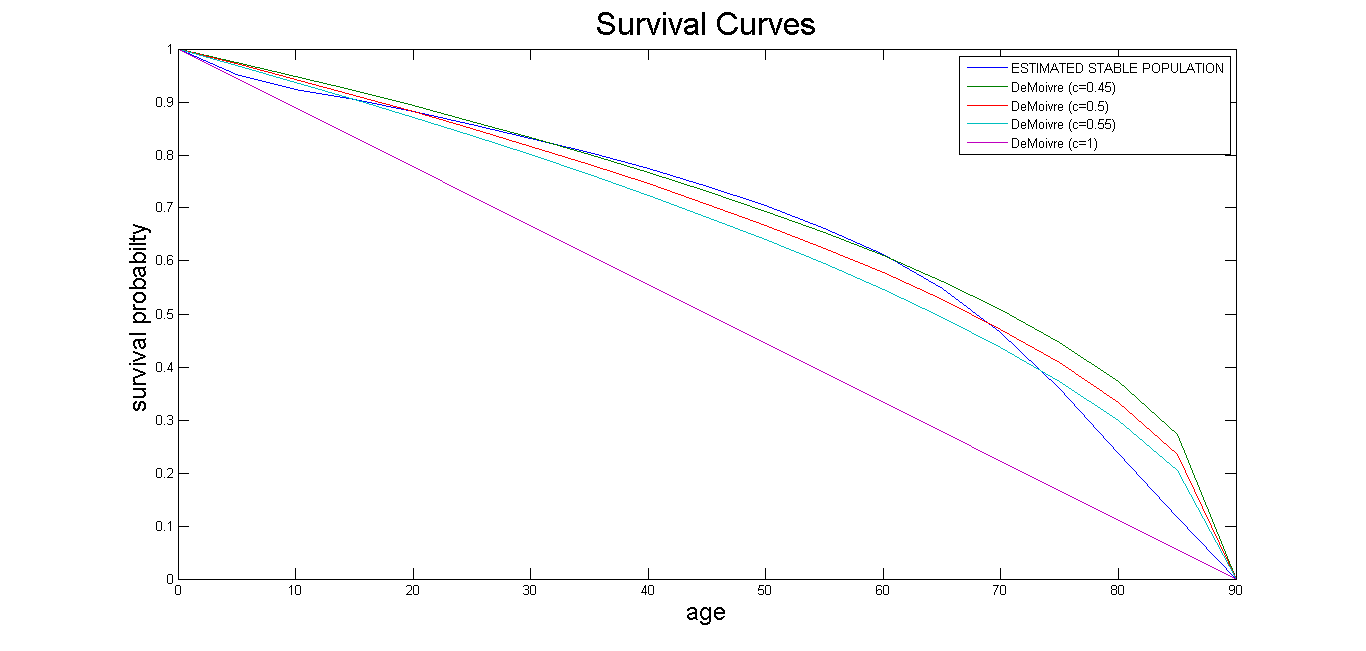
 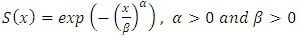 .Generalized (or Modified) De Moivre model:
 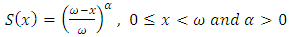 .The Modified De Moivre appears to fit better to the estimate than all the other distributions, and when
  the least error is observed.Now, with an annual effective interest rate of 6%, one could use the life tables (e.g. Table 4) to compute actuarial values. (See Table 10)
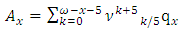 where
where  and
and  .
.
 .
.
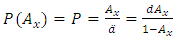 , where
  represents actuarial present value for a discrete whole life insurance policy,
  is the actuarial present value for a discrete whole life annuity policy and P is the whole life benefit insurance premium; for life age
  is the annual effective interest rate, d the annual effective discount rate and
  the discounting factor.
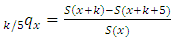
  defines the probability that a life aged x is expected to survive the next 5 years and then dies within the following k years Note that annual benefits are taken as GH$1 (that is
  ) and the selection of 6% annual effective rate of interest is arbitrary, though common in literature.
Table 10. Actuarial Values
 |
| |
|
 | Figure 3. Survival curves for Countries |
 | Figure 4. Survival curves for Distributions |
 | Figure 5. Survival curves for Modified De Moivre distributions |
4. Conclusions
The Leslie model has been used to generate life tables in an instance (i.e. the case of Ghana) where data that represent stable population is not available. It has been found that Ghana’s population will attain stability by the year 2030; with an estimated annual growth rate of 1.21percent. Life expectancy will be 59 years; 58 years for males and 60 years for females. Thus in the long run females in Ghana will live longer than their male counterparts. The life table is close to that of some African countries, particularly South Africa, but far from the developed non-Africa countries. Per the generated life tables, Ghana’s mortality follows the Modified De Moivre distribution with 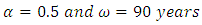 . Thus,
 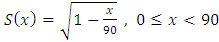 .The Leslie model could be used to generate life tables in regions or countries where data on births and deaths are mostly inaccurate or unavailable. Actuaries, insurance companies and academic institutions can use the Modified De Moivre as a model for computing mortalities and thus all actuarial values for Ghana.
Appendix
Table A1. Parameters of Leslie matrix (see Figure 1)
 |
| |
|
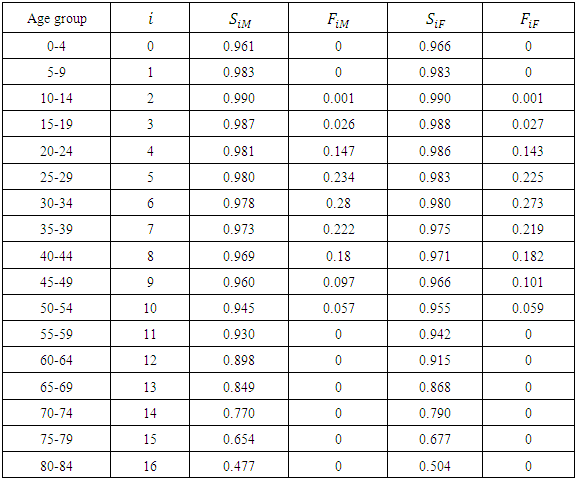
The age-specific survival rates 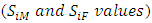 were computed from the 2012 WHO life table for Ghana and the age-specific fertility rates
  were computed from 2010 GSS PHC report. The computations are shown in Tables A2 and A3, where
  .
.Table A2. Matrix parameters (nPx values)
 |
| |
|
 values were obtained from WHO 2012 life tables for Ghana. Age 0 figures are adjusted. The rest follow the formular
  . Example:
  for males. Note that values have been rounded to 3 decimal places in Table A1.
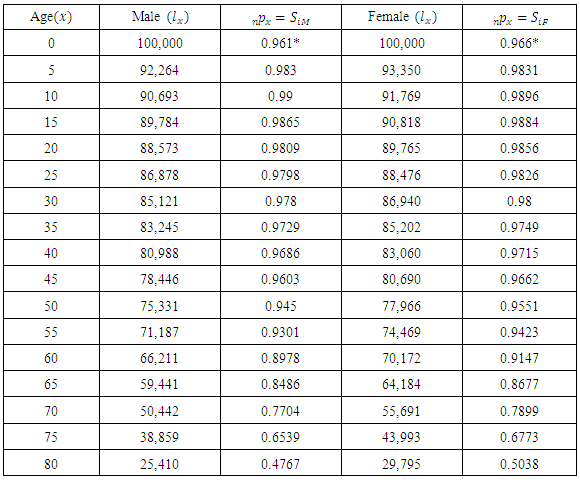
Table A3. Children ever born (CEB) and mx values
 |
| |
|
Entries of Ages 0, 5, 55 – 80 are all zeros. Children ever born (CEB) values were obtained from GSS 2010 phc analytical report (page 176).  values are computed from the CEB values by subtracting preceeding CEB values from succeeding values (thus CEB values are seen to be cumulative values). Example:
  for males.
  values are adjusted
  . Note that ages 10 and 50 values are estimates.
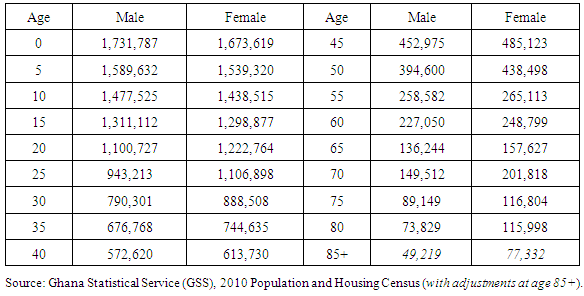
 Table A4. 2010 Age Distribution (Ghana)
 |
| |
|
References
| [1] | Abaitey, C. (2015). Estimating Life Tables from Leslie Population Models (Unpublished master’s thesis). Kwame Nkrumah University of Science and Technology, Kumasi, Ghana. |
| [2] | Burch, T.K. (2003). Demography in a new key A theory of populationtheory. Demographic Research, 9(11). |
| [3] | Caswell, H. (2001). Matrix Population Models: Construction, Analysis, and Interpretation.2nd Edition. |
| [4] | Cullen, M. R. (1985). Linear models in biology. Ellis Horwood Ltd., England. pp.213. |
| [5] | Fomby, T. (2008). Scoring Measures for Predicting Problems. (http://faculty.smu.edu/tfomby/... January 4, 2015). |
| [6] | Ghana Statistical Service (2013). 2010 Population & Housing Census: National Analytical Report. pp.176, 180 and 190. |
| [7] | Ghana Statistical Service (2013). 2010 Population & Housing Census Report: Children, Adolescents & Young People in Ghana. pp.116. |
| [8] | Gonze, D. (2012). Discrete age-structured models: the Leslie matrices. (http://homepages.ulb.ac.be/~dgonze/TEACHING/leslie.pdf. October 19, 2012). |
| [9] | Kot, M. (2001). Elements of Mathematical Ecology. Cambridge University Press. |
| [10] | Kpedekpo, G.M.K. (1969a). On Working Life Tables in Ghana with Particular reference to the Female Working Population. Journal of the Royal Statistical Society, 132(3): 431-441. |
| [11] | Kpedekpo, G.M.K. (1969b). Working Life Tables for Males in Ghana. American Statistical Association Journal, March 1969, pp.108-110. |
| [12] | Leslie, P. H. (1945). The use of matrices in certain population mathematics. Biometrika 33:183-212. |
| [13] | Leslie, P. H. (1948). Some further notes on the use of matrices in population mathematics. Biometrika 35:213-245. |
| [14] | Leslie, P. H. (1959). The properties of a certain lag type of population growth and the influence of an external random factor on a number of such populations. Physiol. Zool. 32: 151-159. |
| [15] | Li, W. C. (1994). Application of Leslie matrix models to wild turkey populations. Thesis submitted to the Statistics department of North Carolina State University, Raleigh. |
| [16] | Lopez, A.L.; Salmonson, J.; Ahmad, O.; Murray, C.J.L. and Mafat, D. (2000). Life Tables for 191 Countries: Data, Methods and Results. GPE Discussion Paper Series: No.9. EIP/GPE/EBD World Health Organization. (http://www.who.int/healthinfo/paper09.pdf. October, 2014). |
| [17] | Millspaugh, J.J.; Skalski, J.R.; Townsend, R. L.; Diefenbach, D.R.; Boyce, M.S.; Hansen, L.P. and Kammermeyer, K. (2009). An Evaluation of Sex-Age-Kill (SAK) Model Performance. |
| [18] | Murray, C.J.L.; Ahmad, O.B.; Lopez, A.D. and Salmonson, J.A. (2000). WHO System of Model Life Tables. GPE Discussion Paper Series: No.8. EIP/GPE/EBD World Health Organization. (http://www.who.int/healthinfo/paper08.pdf. October, 2014). |
| [19] | Shyrock, H.S. and Siegel, J.S. (1976). The Methods and Materials of Demography, Academic Press, New York. |
| [20] | Usher, M. B. (1966). A matrix approach to the management of renewable resources, with special reference to selection forests. Journal of Applied Ecology 3:355-367. |
| [21] | Usher, M. B. (1971). Developments in the Leslie model in mathematical models in ecology. Blackwell Scientific Publications. |
| [22] | Usher, M.B. (1969). A matrix model for forest management. Biometrics 25, 309-315. |
| [23] | World Health Organization (Global Health Observatory Data): Life Tables by Country (http://aps.who.int/gho/data. Feb., 2015). |
| [24] | Yu, Y. (1990). A Leslie model, threshold function and uncertainty for chemical control of corn earworm. Ph.D. Thesis. North Carolina State University. Raleigh, N.C. 148pp. |

 Abstract
 Reference
 Full-Text PDF
 Full-text HTML