N. K. Frempong1, Nimo Nicholas1, M. A. Boateng2
1Department of Mathematics, Kwame Nkrumah University of Science and Technology, Kumasi, Ghana
2Faculty of Engineering, Ghana Technology University College, Kumasi, Ghana
Correspondence to: N. K. Frempong, Department of Mathematics, Kwame Nkrumah University of Science and Technology, Kumasi, Ghana.
| Email: |  |
Copyright © 2017 Scientific & Academic Publishing. All Rights Reserved.
This work is licensed under the Creative Commons Attribution International License (CC BY).
http://creativecommons.org/licenses/by/4.0/

Abstract
The objective of this study is to develop a predictive model that can predict the likelihood of claim given some possible risk factors on the occurrence of claims from the insurance industry. The decision trees analysis was adopted and a predictive model was developed. The model developed took into account the class of portfolios at the individual and corporate policy levels. The model also considers vehicle usage such as private or commercial. The age of vehicle and age of policyholder were the main contributing risk factors predicting the occurrence of motor claims for both individual and cooperate policy holders. It was established that corporate policyholders with vehicles aged up to 8 years have a higher probability of claim. Whilst individual policyholders between ages 18 to 48 years have a high probability of making a claim as compared to older policyholders aged above 48 years when other conditions remain the same.
Keywords:
Predictive Modeling, Decision tree, Claim, Risk, Policyholder
Cite this paper: N. K. Frempong, Nimo Nicholas, M. A. Boateng, Decision Tree as a Predictive Modeling Tool for Auto Insurance Claims, International Journal of Statistics and Applications, Vol. 7 No. 2, 2017, pp. 117-120. doi: 10.5923/j.statistics.20170702.07.
1. Introduction
Risk classification in modern risk management helps in solving the problem of information asymmetry and moral hazards. The decisive theories of [2] and [3] predicts a positive association between the probability of a policyholder making claim and the munificence of his insurance contract. This reflects adverse selection between the insurer and the policyholder, which leads to a sub-optimal allocation of risk within a risk class defined by characteristics observed by the insurer [4]. The risk exposure of the insurance industry in Ghana has increased tremendously [5], due to variety of factors which include; high element of moral hazard, increase in the cost of claim, high inflationary trend, pecuniary risk of the subject matter of insurance. The increasing risk that is being carried by insurers in Ghana facilitated the increment of motor insurance premium by Ghana Insurers Association to over 400% in 2015.“General coverage that is given by the insurer decreases the expected rate of occurrence of accident and therefore the incentives for safety” [6, 7]. Meaning more insurance cover, which do not consider the risk at hand that may lead to occurrence of claim. It can be predicted that there is a positive correlation between risk and the extent of insurance cover within a risk class.This paper used decision tree tool which is a form of machine learning to classify policyholders into groups based on their peculiar risk characteristics. In recent times there has been many innovative research and writings on the tree creation algorithms, to cite a few [8-15].There have been various applications of this modeling approach in the industry such as; claim processing and management, detection of fraudulent claims, allocation of loss reserves, underwriting, and retail marketing campaigns. Predictive modeling goes to the next step and anticipates the future so that appropriate action can be taken and resources assigned earlier in the business process in order to try and achieve better outcomes.
2. Data and Methods
Data on insurance policyholders and their risk characteristics was used to develop the model. A secondary data obtained from the insurance industry and for the purpose of homogeneity the data was grouped into Individual and corporate sets. Seven (7) variables were used for the analysis, namely; policyholder age, vehicle age, make and model of vehicle, usage, vehicle ownership and claim status. The total number of policyholders that were considered was One Thousand Five Hundred and Twenty-Eight (1,528) from calendar year 2012 to 2014. Risk characteristics of policyholders were recorded against whether claim had been made or not over the period.
2.1. Decision Tree Theory
The classification and regression tree (CART) algorithm were considered by [1] to fit trees, branches and leaves to data so as to observe predictive behavior of factors or variables under consideration. The main output structure that evolves is as a direct consequence of asking an ordered flow of questions in the Decision tree. The type of question that is asked at each step in the flow depends upon the answers to the previous questions of the sequence.Node Impurity FunctionsAll of the allowable ways of splitting at each stage of continuous partitioning into subset of L are considered at each node of the tree. The split which would lead to the greatest increase in node “purity” is then chosen for the split. This can be achieved using the “impurity function”; the functions of the proportions of the learning sample belonging to the possible classes of the response variable. We choose the best split over all the variables with the aim to have as little purity as possible.Accordingly, the best split is the one that reduces the node impurity the most.Let (P1, P2, · · · , Pk) be k >= 2 classes, then, at any given node, ρ the impurity function at each node imp(ρ) is defined as; | (1) |
where ψ(k|ρ) is an estimate of P (X ∈ πk), i.e. the conditional probability that an observation X is in πk given that it falls into node ρ.It is required for imp(ρ) to be a symmetric functions defined on the set of all k-tupples of probabilities (p1, p2, · · · , pk) with unit sum, minimized at the points (1, 0, 0, ...0); (0, 1, 000, · · · , 0); ...; (0, 0, 0, 0, 0, · · · , 1) and minimized at the point P = (1/k, 1/k, ..., 1/k).Now if k = 2, these conditions reduces to a symmetric ψ(p), maximized at the point p = 1/2 with ψ(0) = ψ(1) = 0.Resubstitution ErrorThis measures what fraction of the cases in a node is classified incorrectly, if we assign every case to the majority class in that node. That is; | (2) |
where p(j/ρ) is the relative frequency of class j in node ρ. For a two-class problems we denote the classes by 0 and 1; P (0) denotes the relative frequency of class 0 and P (1) must be equal to 1-P(0) since the relative frequencies must sum to 1.The entropy function:This is given by; | (3) |
Now if k=2, it implies that | (4) |
Now Let p (1/ρ) =P, this implies p (2/ρ) = 1-PTherefore equation (4) becomes,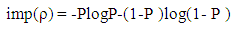 | (5) |
The Geni Index Function:This is define for all (i = k), the Geni Index at any node ρ is measured by;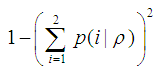 | (6) |
As shown in Figure 1 above, all the 3 functions for measuring impurity at the node are concave, having minimum point at p = 0 and p = 1 and a maximum at p = 0.5.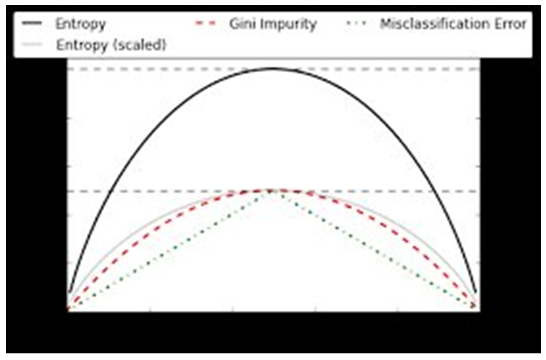 | Figure 1. Concave functions |
3. Results and Discussion
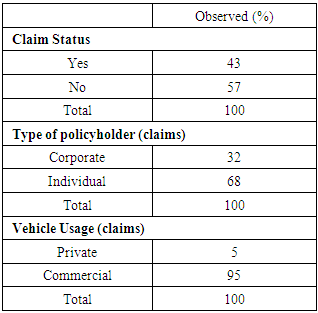
From table 1 below, it is shown that generally, the number of policyholders that make at least a claim over the period represents 43% of the entire portfolio of the insurance company and non-claimants represents about 57%. This supports and backs the general view of the public that most policyholders do not make claim to the insurance company. However, that cannot be concluded to say that the effect of claims do not affect the companies’ growth or sustainability. Claims do contribute to the industries liabilities. Since the principle of insurance operates by the law of large numbers, it may be that even though potential policyholders come to the “pool”, just a few of them get register claimable event(s). Table 1. Summary statistics of binary variables
 |
| |
|
Therefore an assessment of individual claim size could help to ascertain the reality of the distribution of claims above. For instance, third party injury claim liability is unlimited, which means though the count may be minimal, impact could be felt when it comes to modeling with the claim size.From Table 1, vehicles that were owned by individuals had high claim reporting rate compared to the corporate bodies.From the summary of results in table 1, we observe that commercial vehicles impact on claim reporting were quite negligible i.e. 5% as compared to 95% for vehicles that were owned privately. This could be attributed to the fact that most commercial drivers felt reluctant to report claims, lacked adequate knowledge on insurance, inability to compile claim documentations, whilst private persons who owned their vehicles had adequate knowledge of claim processes, had the tendency to challenge liability of insurance policies, etc. However the claim size of a commercial vehicle could have a significant impact on the insurance company’s funds as compared to claim size of private car.
3.1. Predictive Model for Individual Policyholders
The data consist of 728 observations (with 346 claim experience and 382 with no claim experience over the entire period. In the decision tree process, the probability of no claim is about 52.47%.From Figure 2 below, we observe 13 terminal nodes with the root node of the decision tree split by the most important variable being the age of the vehicle. The node consist of 728 observations where V AGE ≤ 21 (229, with 21 yes and 208 No) and V AGE >21(499, with 174 No and 325 Yes).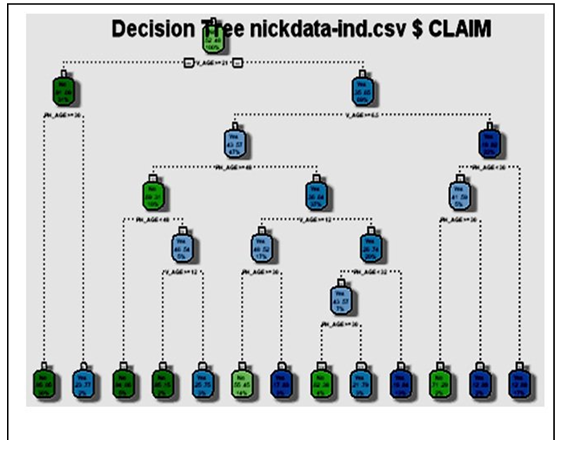 | Figure 2. Predictive Model-Individual |
Further, the node with 229 observations under V AGE ≤ 21 was split by PH AGE ≤ 30.5 with total observation 216 (11 yes, 205 No) and PH AG>30.5 with 13 observations (11 No and 3 Yes). Node 4 predicts that there would be no claim for an individual claimant who is aged above 301/2 years and vehicle age is greater than or equal to 21 would have no claim with 94%. Whilst Node 5 also predicts that an individual policyholder who is aged less than 30 years who owns a vehicle aged less than 21 would result in a claim with 77% chance.
3.2. Predictive Model for Corporate Policyholders
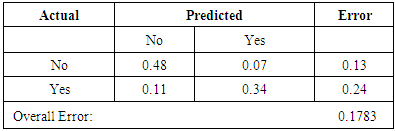
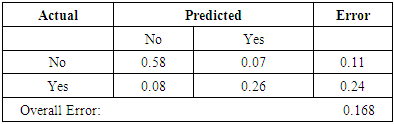
From table 2, shows that the model predicts that if a policyholder owns his/her own car and did not make a claim in the current year, there is 48% chance that he will not make a claim in the coming year and 7% otherwise. However, for a person who makes a claim in the current year, there is a 34% chance that he/she will make a claim next year. Analysis of corporate policyholders shows a similar trend as depicts from that of individual as shown in Table 3. Thus, there is a 58% chance that a corporate policyholder, who did not make a claim in the current year, will also not make a claim in the next year as against 7% for those who did not make a claim this year but will make a claim next year.Table 2. Confusion Matrix - Individual
 |
| |
|
Table 3. Confusion Matrix-Corporate
 |
| |
|
Again from Table 3, corporate policyholders who made a claim in the current year stands 8% chance of no claim as against 26% chance of a claim in the coming year. The overall prediction of claim shows that the propensity for a policyholder to make a claim depends very much on the loss history of that claimant.In addition, the foregone data analysis made it clear that age of policyholders and age of vehicles are the important factors that affect the propensity of a policyholder to make a claim, and it varies among the Individual and Corporate policyholders. Policyholders aged between 30 years and 40 years have a high propensity to make claim, and very peaked at age 30. Individual policyholders aged more than 48 years have a lower chance of making claim. Private vehicles have more potential to make claims than commercial vehicles. This is as a result of the time consuming claim process, the ”knock-for-knock” agreement that commercial drivers do at time of accident and the fear of arrest for lack of vehicle documents among commercial vehicle users [16].Also most private vehicle owners in Ghana have high level of education and insurance awareness, hence are able to read insurance contracts to understand, follow up claim processes to its logical conclusion and provide legal arguments where needed. Young adults between the ages of 19 years to 36 years have high propensity to make claim than older folks. This can be attributed to the fact that younger adults have more potential and expose themselves to the risk on the road, due to inexperience, ignorance of road safety measures etc. under the cooperate model From figure 3, vehicles aged between 0 to 8 years make lots of claim as compared to vehicles above 8 years. This is obviously the fact that owners of new and less older vehicles belong to the elite class who have more knowledge in insurance and ready to follow the claim processes to its logical conclusion as compared to those of older vehicles.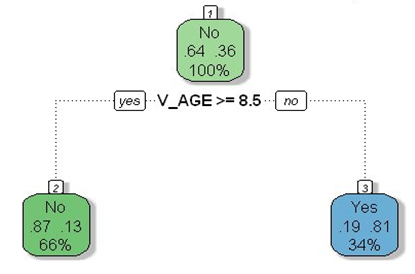 | Figure 3. Predictive Model- Corporate |
Vehicles that are owned by individuals have high claim reporting rate than those that belonged to corporate bodies.
4. Conclusions
Among the predictor variables that were used in the study to predict the target variable claim, the age of the vehicle and the age of the policyholder were chosen by the algorithm as important predictors that explains the claim process. Taking into consideration of heterogeneity in the claims process the policyholders were classified as corporate and individual policyholders. Individual policyholders make marginally more claim as compared to corporate customers. In respect of corporate policyholders, vehicles aged up to 8 years have a higher probability of claim in the coming year. More so, individual policyholders aged between 18 to 48 years have a high probability of making a claim as compared to older policyholders.Generally, there is a greater chance for individuals or corporate bodies who make a claim in the current year to make a claim in the next year. The low error margin of the prediction shows that the model is well validated and suitable for the prediction of future claims given the current data and risk characteristics.
References
| [1] | Breiman, L., Friedman, J., Stone, C. J., & Olshen, R. A. (1984). Classification and regression trees. CRC press. |
| [2] | Ritschard, G. (2006). Computing and using the deviance with classification trees. In COMPSTAT 2006-Proceedings in Computational Statistics (pp. 55-66). Physica-Verlag HD. |
| [3] | Wilson, C. (1977). A model of insurance markets with incomplete information. Journal of Economic theory, 16(2), 167-207. |
| [4] | Crocker, K. J., & Snow, A. (1986). The efficiency effects of categorical discrimination in the insurance industry. In Foundations of Insurance Economics (pp. 444-467). Springer Netherlands. |
| [5] | National Insurance Commission, Ghana (2014). |
| [6] | Hölmstrom, B. (1979). Moral hazard and observability. The Bell journal of economics, 74-91. |
| [7] | Shavell, S. (1979). On moral hazard and insurance (pp. 280-301). Springer Netherlands. |
| [8] | Buckinx, W., Moons, E., Van den Poel, D., & Wets, G. (2004). Customer-adapted coupon targeting using feature selection Expert Systems with Applications, 26(4), 509-518. |
| [9] | Tan, P. N., Steinbach, M., & Kumar, V. (2006). Introduction to data mining (Vol. 1). Boston: Pearson Addison Wesley. |
| [10] | Ngai, E. W., Xiu, L., & Chau, D. C. (2009). Application of data mining techniques in customer relationship management: A literature review and classification. Expert systems with applications, 36(2), 2592-2602. |
| [11] | Rokach, Lior; Maimon, O. (2008). Data mining with decision trees: theory and applications. World Scientific Pub Co Inc. ISBN 978-9812771711. |
| [12] | Hastie, T., Tibshirani, R., Friedman, J. H. (2001). The elements of statistical learning: Data mining, inference, and prediction. New York: Springer Verlag. |
| [13] | Rodriguez, J.J. and Kuncheva, L.I. and Alonso, C.J. (2006), Rotation forest: A new classifier ensemble method, IEEE Transactions on Pattern Analysis and Machine Intelligence, 28(10):1619-1630. |
| [14] | Kass, G. V. (1980). An exploratory technique for investigating large quantities of categorical data. Applied Statistics. 29 (2): 119–127. doi:10.2307/2986296. JSTOR 2986296. |
| [15] | Murthy S. (1998). Automatic construction of decision trees from data: A multidisciplinary survey. Data Mining and Knowledge Discovery. |
| [16] | National Road Safety Commission Ghana, NRSC (2010). |

 Abstract
 Reference
 Full-Text PDF
 Full-text HTML