L. Tetteh-Ahinakwa, F. T. Oduro
Department of Mathematics, Kwame Nkrumah University of Science and Technology, Kumasi, Ghana
Correspondence to: L. Tetteh-Ahinakwa, Department of Mathematics, Kwame Nkrumah University of Science and Technology, Kumasi, Ghana.
| Email: |  |
Copyright © 2017 Scientific & Academic Publishing. All Rights Reserved.
This work is licensed under the Creative Commons Attribution International License (CC BY).
http://creativecommons.org/licenses/by/4.0/

Abstract
This paper assesses the significance of occurrence and incidence of infant mortality in the Kumasi district, a suburb of the Ashanti Region of Ghana, from 2008 to 2014 using the poisson regression model. Data was collected from the Ghana Health Service (GHS) District Office in Kumasi. The poisson regression model was used to determine the improvement of infant mortality during the years understudy with reference to the year 2014. Results show that the mean number infant mortality is higher in 2008, 2009 and 2012 compared to 2014 (reference year) for both occurrence and incidence. Also, the mean occurrence and incidence of infant mortality reduced significantly throughout the study period.
Keywords:
Poisson loglinear, Infant mortality, Incidence, Occurrence
Cite this paper: L. Tetteh-Ahinakwa, F. T. Oduro, Poisson Regression Model on Infant Mortality Occurrence and Incidence in the Kumasi District of Ghana, International Journal of Statistics and Applications, Vol. 7 No. 2, 2017, pp. 113-116. doi: 10.5923/j.statistics.20170702.06.
1. Introduction
Childbirth is the main source of increase in the size of a family in developing countries. This, in effect, leads to an increase in the size of a community, society and country at large. It is really held in high esteem particularly in these countries where the size of a family or community reflects its social status. However, this is usually breached by the occurrence of deaths in infants. Infant mortality is the death of a child before reaching one year of age per 1,000 live births in a given year [1]. There are various causes to infant mortality. Some factors include medical, environmental and socio-cultural. Common causes are preventable with low cost measures.An assessment of the quantitative contribution of mild (birth at 34-36 gestational weeks) and moderate (birth at 32-33 gestational weeks) preterm birth to infant mortality showed that mild– and moderate–preterm birth infants are at high RR for death during infancy and are responsible for an important fraction of infant deaths [2]. Relative risks (RRs) and etiologic fractions (EFs) were measured for overall and cause specific early neonatal (age 0-6 days), late neonatal (age 7-27 days), post-neonatal (age 28-364 days) and total infant death among mild and moderate preterm births vs term births (at ≥37 gestational weeks). A reviewed article aimed at developing mathematical models of malaria shows that nearly a million child mortality was recorded in about 109 countries declared to be endemic to malaria and its prevalence is highest in infants and children. The research emphasised more on the evolution of the deterministic differential equation based epidemiological compartment models with a brief discussion on data based statistical models under the age of 5-years. The Ross model was used as a basis to develop this model [3].A proposed mathematical model for the association between P. falciparum transmission and neonatal death related neonatal mortality resulting from malaria infection during pregnancy to the age-specific prevalence of P. falciparum in the general population [4]. Results showed that there is no evidence of an association between neonatal mortality and malaria transmission intensity, yet such an association is evident for both post-neonatal and overall infant mortality. Malaria kills about 1 to 3 million people a year of whom 75% are African children. It presents an ordinary differential equation mathematical model for the spread of malaria in human and mosquito populations. A reproductive number, R0, for the number of secondary cases that one infected individual will cause through the duration of the infectious period was defined. It was found that the disease-free equilibrium is locally asymptotically stable when R0 <1 and unstable when R0 >1 [5].A study to assess the effect of early infant feeding practices (delayed initiation, prelacteal feeding established neonatal breastfeeding) on infection-specific neonatal mortality in breastfed neonates aged 2–28 days. It employed a prospective observational cohort study based on 10 942 breastfed singleton neonates who were born between 1 July 2003 and 30 June 2004, survived to day 2 and whose mothers were visited in the neonatal period. The risk of death as a result of infection increased with increasing delay in initiation of breastfeeding from 1 hour to day 7. No obvious associations were observed between these feeding practices and non- infection-specific mortality [6]. Intermittent preventive treatment in pregnancy (IPTp) with sulfadoxine–pyrimethamine was adopted by Gab on, an African country, to reduce neonatal morbidity and mortality associated with malaria in pregnancy. Data on prevalence of maternal Plasmodium falciparum infection, anemia, premature birth, and birth weight were collected in cross-sectional surveys in urban and rural regions of the country before and after the implementation of IPTp in a total of 1403 women and their offspring. The prevalence of maternal Plasmodium falciparum infection decreased dramatically (risk ratio 0.16, P< 0.001) [7]. A cross-sectional survey design was employed to examine socio-cultural factors influencing infant feeding practices of mothers in Cape Coast Metropolis. Respondents who reported having primary education were significantly more likely to exclusively breastfeed than were respondents who reported having higher levels of schooling. Mother’s marital status, employment status, friends’ way of feeding their babies, social support and baby’s age were also influential in infant feeding practices [8].
2. Methodology
This study uses the Poisson regression model with log link to assess the significance of occurrence and incidence of infant mortality in the Kumasi District. Data was obtained from the Ghana Health Service Kumasi Office. The SPSS version 17 is used for this analysis.Poisson regression, a special case of Generalized Linear Models, is a standard model for count data. It is useful in studying the occurrence per unit time conditional on some covariates [9]. This regression model is derived from the Poisson distribution by allowing the intensity parameter µ to depend on covariates (regressors). It is not only motivated by the usual consideration for regression analysis but also seeks to preserve and exploit as much as possible the non-negative and integer-value aspect of the outcome.The Poisson loglinear model with explanatory variable X is | (1) |
for this model, the mean satisfies the exponential relationship | (2) |
The result indicate that a unit increase in x has a multiplicative impact of  on
on  When there are a set of predictor variables, then the model becomes
 | (3) |
Where; µ= E(Y) =Var(Y). This is the major assumption of the Poisson regression model.It is more appropriate to model the rate at which events occur than its number of occurrence when they happen over time, space or some other index of size. For the rate occurrence of an event let Y = count and t = index of time or space, then the rate of occurrence is Y/t and the expected value of the rate is | (4) |
Thus, the Poisson loglinear regression model for the rate of occurrence is | (5) |
 | (6) |
 | (7) |
Where –log(t) is an adjustment term and is referred to as offset.With multiple explanatory variables, the rate model becomes | (8) |
3. Results
Figure 1 shows a bar chart of the distribution of infant mortality ratios in Kumasi district for 2008-2014. The highest infant mortality ratio of 45.6 /1,000 live births was recorded in 2008 and the least of 20.1 /1,000 live births was recorded in 2013. Infant mortality ratio declined from 2008 at 45.6/1,000 live births to 2011 at 26.6/1,000 live births. It then experienced consecutive years of upward and downward trend from 27.9/1,000 live births in 2012 to 20.1/1,000 live births in 2013 and finally 20.3/1,000 live births in 2014. The chart in Figure 2 shows the trends of supervised infants on admission in Kumasi district from 2008-2014. It indicates that, infants admitted dropped steadily from 2008 to 2010. It rose at an increasing rate the following year and then at a decreasing rate from 2011 to 2013. It finally dropped in 2014.
3.1. Modelling the Occurrence of Infant Mortality Cases
Poisson distribution with log link function is used in modelling. Four hundred and fifty-eight (458) observations were made in a 7-year period. In the model, infant death is used as the response variable while time (years) is used as the only predictor variable.The model is given as follows; Where i = 1 – 7
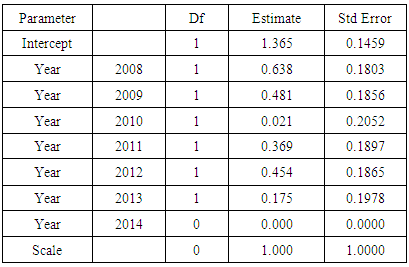
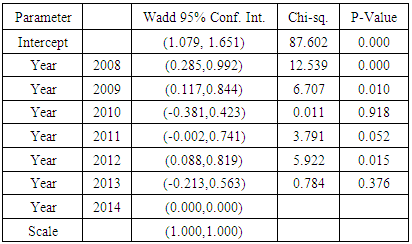
 The fitted model has a deviance value of 122.602 which follows a chi-square distribution with 77 degrees of freedom. The ratio of the deviance and the degrees of freedom is 1.592. The scaled deviance and the scaled Pearson chi-square had 122.602 and 104. 046 values respectively with the same degrees of freedom of 77.Tables 1a and 1b presents detail analysis of the of occurrence of infant mortality cases in Kumasi district from 2008 to 2014. Time in years, the only predictor variable, is treated as a discrete variable. The intercept has a chi-square and p-value of 87.602 and 0.000 respectively. This implies that the intercept is significant (α < 0.05). It can be seen that the parameter estimates for the years 2008, 2009, 2010, 2011, 2012, and 2013 were all positive showing that the mean number of occurrence of infant deaths is higher in those years than the reference year (2014). The years 2008, 2009 and 2012 experienced significant increase in the mean occurrence of infant mortality cases in the Kumasi district compared to 2014. That is, the mean number of infant deaths for all the months in 2008(e1.365e0.638) = 7.411, that of 2009(e1.365e0.481) = 6.334 and 2012(e1.365e0.454) = 6.166 higher than the mean number of infant deaths for all months in 2014.
Table 1a. Analysis of parameter estimates for occurrence of infant mortality
 |
| |
|
Table 1b. Analysis of parameter estimates for occurrence of infant mortality
 |
| |
|
3.2. Modelling the Incidence of Infant Mortality Cases
Poisson distribution with log link function is again used in modelling. Four hundred and fifty-eight (458) observations were made in a 7-year period. In the model, infant death is used as the response variable while time (years) is used as the only predictor variable. The model is given as follows; Where i = 1 – 7
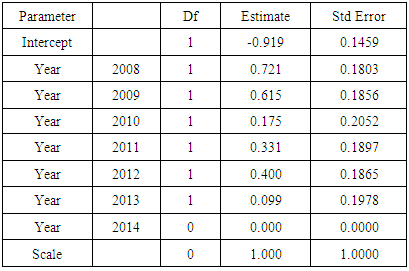
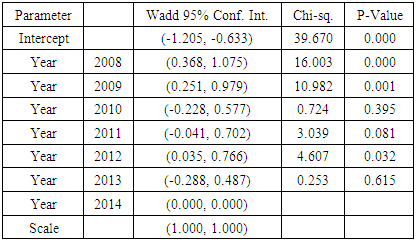
 Tables 2a and 2b present a detailed analysis of incidence of infant mortality cases in Kumasi district from 2008 to 2014. The value of the intercept -0.919 is significant with chi- square value 39.670 and p-value of 0.000. Positive values of parameter estimate for the years 2008, 2009, 2010, 2011, 2012 and 2013 indicates that the mean number of occurrence of infant deaths was higher in those years than the reference year (2014). There was a statistically significant difference between 2014 and years 2008, 2009 and 2012. They had chi-square values of 16.003, 10.982 and 4.607 with p-values of 0.000, 0.001 and 0.032 respectively. In 2008, infant mortality rate increased by (e-0.919e0.721) = 0.820, (e-0.919e0.615) = 0.738 in 2009 and (e-0.919e0.400) = 0.595 in 2012 respectively compared to the reference year 2014.
Table 2a. Analysis of parameter estimates for incidence of infant mortality
 |
| |
|
Table 2b. Analysis of parameter estimates for incidence of infant mortality
 |
| |
|
4. Conclusions
The aim of the study was to examine the significance of occurrence and incidence of infant mortality in Kumasi district.The Poisson regression model for the occurrence of infant mortality in Kumasi district was considered. Only parameter estimates for the years 2008, 2009 and 2012 were significant. Also, the mean number of infant deaths for all the months in these years are higher than the mean number of infant deaths for all months in 2014.The Poisson regression model for the incidence of infant mortality in Kumasi district was also considered. Parameter estimates for incidence of infant mortality for the years 2008, 2009 and 2012 were significant. The infant mortality rates for these years were higher than the reference year 2014.
ACKNOWLEDGEMENTS
We wish to express our sincere gratitude to everyone that contributed in diverse ways in making this research a success.
References
| [1] | The World Bank IBRD –www.data.worldbank.org/indicator/SP.DYN.IMRT.IN. |
| [2] | Kramer, M. S., Demissie, K., Yang, H., Platt, R.W., Sauve R., Liston R. (2000). The Combination of Mild and Moderate Preterm Birth to Infant Mortality. |
| [3] | Mandel, S., Sarkar, R. R., Sinha, S. (2011). Mathematical models of malaria- review Published online 2011 Jul 21. doi: 10.1186/1475-2875-10-202 PMCID: PMC3162588M. Wegmuller, J. P. von der Weid, P. Oberson, and N. Gisin, “High resolution fiber distributed measurements with coherent OFDR,” in Proc. ECOC’00, 2000, paper 11.3.4, p. 109. |
| [4] | Ross, A., Smith, T. (2006). The Effect of Malaria Transmission Intensity on Neonatal Mortality in Endemic Areas. Am J Trop Med Hyg August vol. 75 no. 2 suppl 74-81. |
| [5] | Nakul, C., Cushing, J. M., Hyman, J. M. (2006). Bifurcation Analysis of Mathematical Model For Malaria Transmission SIAM J. APPL.MATH. Vol. 67, No. 1, pp. 24–45. |
| [6] | Edmond, K.M., Kirkwood, B.R., Amenga-Etego, S., Owusu-Agyei, S., Hurrt, L.S. (2007). Effect of early infant feeding practices on infection-specific neonatal mortality: an investigation of the causal links with observational data from rural Ghana. Am J Clin Nutr October 2007 vol. 86 no. 4 1126-1131. |
| [7] | Ramharter, M., Schuster, K., Bouyou-Akotet, M. K., Adegnika, A.A., Schmits, K., Mombo-Ngoma, G., Agnandji, S. T., Nemeth, J., Afène, S. N., Issifou, S., Onnas, I. N., Kombila, M., Kremsner, P. G. (2007). Malaria in Pregnancy Before and After Implementation of a National IIPTp Program in Gabon. Am. J. Trop. Med. Hyg. 77(3), pp. 418–422. |
| [8] | Sika-Bright, Solomon (2009). Socio-Cultural factors influencing current trends of infant feeding practices in Cape Coast Metropolis. |
| [9] | Colin A. Cameron, Pravin K. Trivedi (2013). Regression Analysis of Count Data (Second Edition). Econometrics Society Monographs. Cambridge University Press, 27 May 2013, Business & Economics, pages 2-9. |


 on
on  When there are a set of predictor variables, then the model becomes


 Where i = 1 – 7
 The fitted model has a deviance value of 122.602 which follows a chi-square distribution with 77 degrees of freedom. The ratio of the deviance and the degrees of freedom is 1.592. The scaled deviance and the scaled Pearson chi-square had 122.602 and 104. 046 values respectively with the same degrees of freedom of 77.Tables 1a and 1b presents detail analysis of the of occurrence of infant mortality cases in Kumasi district from 2008 to 2014. Time in years, the only predictor variable, is treated as a discrete variable. The intercept has a chi-square and p-value of 87.602 and 0.000 respectively. This implies that the intercept is significant (α < 0.05). It can be seen that the parameter estimates for the years 2008, 2009, 2010, 2011, 2012, and 2013 were all positive showing that the mean number of occurrence of infant deaths is higher in those years than the reference year (2014). The years 2008, 2009 and 2012 experienced significant increase in the mean occurrence of infant mortality cases in the Kumasi district compared to 2014. That is, the mean number of infant deaths for all the months in 2008(e1.365e0.638) = 7.411, that of 2009(e1.365e0.481) = 6.334 and 2012(e1.365e0.454) = 6.166 higher than the mean number of infant deaths for all months in 2014.
 Where i = 1 – 7
 Tables 2a and 2b present a detailed analysis of incidence of infant mortality cases in Kumasi district from 2008 to 2014. The value of the intercept -0.919 is significant with chi- square value 39.670 and p-value of 0.000. Positive values of parameter estimate for the years 2008, 2009, 2010, 2011, 2012 and 2013 indicates that the mean number of occurrence of infant deaths was higher in those years than the reference year (2014). There was a statistically significant difference between 2014 and years 2008, 2009 and 2012. They had chi-square values of 16.003, 10.982 and 4.607 with p-values of 0.000, 0.001 and 0.032 respectively. In 2008, infant mortality rate increased by (e-0.919e0.721) = 0.820, (e-0.919e0.615) = 0.738 in 2009 and (e-0.919e0.400) = 0.595 in 2012 respectively compared to the reference year 2014.
 Abstract
 Reference
 Full-Text PDF
 Full-text HTML


