Elvis Adam Alhassan1, Adjei Mensah Isaac2, Aidoo Emmanuel1
1Department of Mathematics, University for Development Studies, Navrongo, Ghana
2Department of Humanities, All Nations University College, Koforidua, Ghana
Correspondence to: Elvis Adam Alhassan, Department of Mathematics, University for Development Studies, Navrongo, Ghana.
| Email: |  |
Copyright © 2017 Scientific & Academic Publishing. All Rights Reserved.
This work is licensed under the Creative Commons Attribution International License (CC BY).
http://creativecommons.org/licenses/by/4.0/

Abstract
According to National Institute of Allergy and Infectious Diseases (2007), Malaria is a disease caused by a parasite that lives part of its life in humans and part in mosquitoes. Malaria remains one of the major killers of humans worldwide, threatening the lives of more than one-third of the world’s population. It thrives in the tropical areas of Asia, Africa, and Central and South America, where it strikes millions of people. Sadly, more than 1 million of its victims, mostly young children, die yearly. A study from the Navrongo Health Research Centre in the Kasena Nankana Municipal discovered that, in this physical Ghanaian rural setting, and highly endemic area of malaria, if malaria were eliminated as a cause of death, persons could live at least 6.1 years longer. This research was therefore undertaken with the prior motive to develop an adequate model for forecasting future trends of malaria in the Kasena Nankana Municipality. The analysis preliminarily evolved that, the reported cases of malaria in the municipality is higher from the months June to November. These months happen to be the major rainy seasons with the highest humidity in the study area and the country as whole. Descriptively, the study revealed that, the average number of patients diagnosed with malaria is 698.7 having slightly flat tail at right side (positively skewed) which implies that the malaria cases are heading towards more positive values with the value of Kurtosis being less than 3 hence making them not normally distributed (platykurtic) which means the variables exhibit broad peaks or high kurtosis. However, values with high skewness and kurtosis turns to produce inadequate result but in this case, a small value such as what was obtained in the descriptive statistics of figure 4.1 shows that the model ARIMA (1, 0, 1) is efficient.Also, with the help of the ACF and PACF plots, tentative models were fit to the data. ARIMA (1, 0, 1) was noted to fit the data well. Further adequacy test on the model also confirmed the validity of the selected model. The model was used to forecast for monthly cases of malaria for the next two years.
Keywords:
Malaria, Time series, ARIMA
Cite this paper: Elvis Adam Alhassan, Adjei Mensah Isaac, Aidoo Emmanuel, Time Series Analysis of Malaria Cases in Kasena Nankana Municipality, International Journal of Statistics and Applications, Vol. 7 No. 2, 2017, pp. 43-56. doi: 10.5923/j.statistics.20170702.01.
1. Introduction
Malaria is caused by Plasmodium parasites which are transmitted by mosquitoes (Henderson, 1999). This plasmodium has four species which include plasmodium falciparum, plasmodium vivax, plasmodium ovale and plasmodium malariae. Although the disease is preventable and treatable, billions of people are at risk of malaria of which 90% of all malaria based deaths occur in Sub-Saharan Africa. However, Asia, Latin America, and, to a lesser extent, the Middle East, are also at risk. In 2015, 95 countries and territories had ongoing malaria transmission. It is the biggest killer of children less than five years of age. That equates to one child almost every minute. Malaria parasite is transmitted from one person to another through the bite of a female anopheles mosquito between duck and dawn. The intensity of transmission depends on factors such as the parasite, vector, human host, and the environment. Anopheles mosquitoes lay their eggs in eggs in water, which hatch into larvae, eventually emerging as adult mosquitoes. When Malaria parasites enter the blood stream of a person, they infect and destroy the red blood cells. The destruction of these essential cells leads to fever and flu-like symptoms such as Chills, headache, muscle aches, tiredness, nausea, vomiting and diarrhea. Malaria, when not treated, can lead to coma and hence, death.Globally, Malaria is increasingly becoming a disease of serious concern to everybody. This is because day by day, the impact of Malaria in human existence, the world over, becomes more ravaging and damaging as a result of high morbidity and mortality experienced in different parts of the globe especially the developing countries of which Nigeria is one. Malaria parasite has been with man since the dawn of time. Hippocrates, a physician born in ancient Greece, today regarded as the “father of medicine” was the first to describe the manifestation of the disease. The association with stagnant water (breeding grounds for the Anopheles Mosquito) led the Romans to begin drainage program, the first intervention against Malaria. The first recorded treatment of Malaria dates back to 1600, when the bitter bark of cinchona tree in Peru was used by the native Indians. Not until 1889 was the protozoa (single celled parasite) cause of Malaria discovered by Alphonse. According to World Health Organization (WHO, 2014) report, estimates of 3.3 billion people are at risk of malaria, of which 1.2 billion are at high -risk. In a high risk area, more than one malaria case occurs per 1000 population. In the 3rd November, 2005 edition of the daily Graphic, it was reported that 2000 pregnant women and 15000 children below the age of five died of malaria. The ministry of Health reported that a quarter of all the cases of child mortality were attributed to malaria, which he said was responsible for 36% of all admissions in the country hospital over ten years.A study from the Navrongo Health Research Centre data discovered that, in this physical Ghanaian rural setting, and highly endemic area of malaria, if malaria were eliminated as a cause of death, persons could live at least 6.1 years longer .Life expectancy increased at every age in the absence of malaria but particularly for those under five years. It was also reported on www.sodzisodzi.com in May 2011 that, malaria represents both national and even global public health burden is not in doubt having been identified as key in achieving five of the eight millennium development goals. The direct and indirect costs of malaria in Africa exceed US$ 2 billion a year while accounting for a reduction of 1.3% of the annual economic growth rate. A study in 2003 by Asante et al revealed that nine workdays were lost by economic active people who were ill with malaria, while more than five working days were lost by their caretakers.In Ghana, the statistics as supplied by NMCP are no less staggering. Establishing as the leading cause of illness, it causes about 8,200 cases daily and 3,000,000 illness every year with over 3000 deaths in 2010. As high mortality as this is, the NMCP is quick to point out that this represents a steady drop from 40,000 deaths reported ten years ago. The most vulnerable groups remain children under five years of age, pregnant women and non-immunes. It is in the light of this report that the research is carried out to reveal the trend of the malaria cases in Upper East to also come out with an adequate model to forecast the future trend.
2. Literature Review
According to National Institute of Allergy and Infectious Diseases (2007), Malaria is a disease caused by a parasite that lives part of its life in humans and part in mosquitoes. Malaria remains one of the major killers of humans worldwide, threatening the lives of more than one-third of the world’s population. It thrives in the tropical areas of Asia, Africa, and Central and South America, where it strikes millions of people. Sadly, more than 1 million of its victims, mostly young children, die yearly. Although malaria has been virtually eradicated in the United States and other regions with temperate climates, it continues to affect hundreds of people in this country every year. The Centers for Disease Control and Prevention (CDC) estimates 1,200 cases of malaria are diagnosed each year in the United States. People who live in the United States typically get malaria during trips to malaria-endemic areas of the world.
2.1. History of Malaria
Malaria has been around since ancient times. The early Egyptians wrote about it on papyrus, and the famous Greek physician Hippocrates described it in detail. It devastated invaders of the Roman Empire. In ancient Rome, as in other temperate climates, malaria lurked in marshes. Hence, the name is derived from the Italian, “mal aria,” or bad air. In 1880, the French scientist Alphonse Laveran discovered the real cause of malaria, the single-celled Plasmodium parasite. Almost 20 years later, scientists working in India and Italy discovered that Anopheles mosquitoes are responsible for transmitting malaria. Historically, the United States is no stranger to the tragedy of malaria. This disease, then commonly known as “fever and ague,” took a toll on early settlers. Malaria has been a significant factor in virtually all of the military campaigns involving the United States. In World War II and the Vietnam War, more personnel time was lost due to malaria than to bullets according to National Institute of Allergy and Infectious Diseases (2007).
2.2. Global Burden of the Malaria Disease
Malaria is viewed as the most important parasitic disease in people. There are upwards of 350-500 million clinical scenes for each year around the world (UNICEF, 2003) keeping in mind most gauges of mortality brought about by Malaria lie at around 1 million deaths for each year (Snow et al. 2005), a few estimations go as high as 3 million (Breman et al, 2004). All of these deaths happen in kids (Phillips, 2001), living in malarious nations in sub-Saharan Africa (SSA) (Ukoli, 1990) where 25% of all youth mortality beneath the age of five (around 800,000 youthful kids (Shepard et al., 1991) is owing to intestinal sickness. Of those youngsters who survive cerebral intestinal sickness (malaria), more than 15% endure neurological deficiencies (Schönfeld et al, 2007) which incorporate shortcoming, spasticity, visual impairment, discourse issues and epilepsy. Where such kids are inadequately overseen and don't have entry to particular instructive offices, these deficiencies may meddle with future learning and improvement. Children less than five years old years are at most noteworthy danger for malaria since they have not yet gained defensive invulnerability. Individuals with semi-safety are contaminated, however don't get an extreme ailment when in doubt. In stable transmission areas infants are secured by the IgM antibodies of their mom and through breastfeeding. After three months infants have a higher vulnerability for a contamination with the parasite. In high transmission zones this period lasts until the age of 3-5 years. In zones with an occasional transmission, the period can most last 10 years. Without re-contamination the obtained safety can disappear in a matter of years (Eddleston et al. 2008). Furthermore kids under five years old experience the greatest malaria issues since they are regularly super-contaminated with different parasites and/or that they frequently experience the ill effects of healthful insufficiencies. These lead to a weaker resistant framework, which prompts a higher weakness for malaria. In addition, a malaria contamination and lack of healthy sustenance are explanations behind an expanding paleness trouble in kids (Greenwood et al. 1991).
2.3. Knowledge on Malaria
Various studies have explored contrasts in knowledge and reported health seeking behaviour amongst men and ladies. Most discovered either no distinction or those ladies had more restricted decision making and monetary energy to act. This was related with disappointments and deferrals in looking for treatment, with differential comprehension of malaria amongst men and ladies, and differential wellbeing looking for conduct. Women delayed looking for consideration until men were accessible, while men were less ready to spend on child health (Al-Taiar et al 2007). These contrasts are basic while considering the fundamental tyke minding part of women and children's expanded helplessness to malaria. Besides as per (Minja et al., 2001), it was expressed that knowledge, state of mind and behaviour practices in regards to malaria were appeared to have effect on the ITN proprietorship.Some different studies that were finished by (Victora, 2003) reported that knowledge of the issue; reasonableness and openness are among significant impediments for the ITN possession and use. Net proprietorship has likewise been identified with the instructive levels of family individuals. This is a confounded relationship since instructive fulfillment can have the effect on an individual's capacity to comprehend and get to data with respect to malaria counteractive action strategies. In Malawi it was found that net proprietorship was less basic in family units where the head/guardian had not finished elementary school and in homes where the house had mud dividers or a grass rooftop (Holtz et al., 2002). This is being bolstered by (Nuwaha, 2001) with proof that instructive fulfillment is connected with malaria specific knowledge and uptake of preventive measures. Rhoida et al (2004) concluded that the achievement in executing preventive mediations amongst pregnant ladies in Tanzania is consequently liable to be resolved to some extent by consciousness of malaria and the techniques accessible to counteract it.
2.4. Causes of Malaria
Malaria is caused by a single-celled parasite from the genus Plasmodium. More than 100 different species of Plasmodium exist. They produce malaria in many types of animals and birds, as well as in humans. Four species of Plasmodium commonly infect humans. Each one has a distinctive appearance under the microscope, and each one produces a somewhat different pattern of symptoms. Two or more species can live in the same area and infect a single person at the same time. Plasmodium falciparum is responsible for most malaria deaths, especially in Africa. The infection can develop suddenly and produce several life-threatening complications. With prompt, effective treatment, however, it is almost always curable. Plasmodium vivax, the most geographically widespread of the species, produces less severe symptoms. Relapses, however, can occur for up to 3 years, and chronic disease is debilitating. Once common in temperate climates, P. vivax is now found mostly in the tropics, especially throughout Asia. Plasmodium malariae infections not only produce typical malaria symptoms but also can persist in the blood for very long periods, possibly decades, without ever producing symptoms, National Institute of Allergy and Infectious Diseases (2007).
2.5. Management of Malaria
Yeboah-Antwi and colleagues (1997) examined the extent to which district health teams in Kintampo in the Brong Ahafo Region of Ghana could reduce the burden of malaria, which is a major cause of mortality and morbidity in a situation where severe resource constraints existed. It was found out that, compliance improve by approximately 20% in both adults and children but there was improvement to care about 50% for example in cost to patients, waiting time at dispensaries and drug wastage at facilities. Another case study in Ghana sought to compare household’s data on acute morbidity and treatment seeking behaviour in two districts with the use of health facility data (Agyepong and Kangeya-Kayonda 2004). For every case of febrile illness seen in the health facilities there were approximately 4-5 cases in the community, hence they concluded that every febrile episodes especially in children be treated with an anti-malarial drug. Since several countries extend malaria treatment to include the community and the home through public and private, formal and informal sectors, the need for more comprehensive estimates becomes urgent. Appawu and colleagues (2004) studied malaria transmission dynamics in the Kassena Nankana District, a site in northern Ghana proposed for testing malaria vaccines. Intensive mosquitoes sampling was done for one year using human landing catches in three micro-ecological sites that is irrigated, lowland and rocky highlands. Transmission was highly seasonal and the heaviest transmission occurred from June to October. The intensity of transmission was higher for people in the irrigated communities than the non-irrigated ones. Approximately 60% of malaria transmission in KND occurred indoors during the second half of the night, peaking at daybreak between 04.00 to 06.00 hours.
2.6. Prevalence and Determinants of Malaria
It ought to be noticed that scourge malaria is gotten from collaborations of vectors, parasites and different natural and anthropogenic determinants. Malaria plague distress immunological powerless populaces, straining the limit of health facilities and bringing on case casualty rates to build five-fold or all the more amid episodes. The demographic profile may interpret into bigger monetary outcomes, despite the fact that the full financial effect of malaria stays unclear. A study was directed in Benin on the most proficient method to consider and set up the significance of financial elements that added to malaria transmission (Mensah and Kumaranayake 2004). As per the study, in spite of the endemic malaria circumstances, there was still small comprehension of the relative significance of monetary elements that add to individuals getting the infection in groups where malaria was endemic. The analysts fought that, inclining attributes of family unit's heads, for example, age, information of malaria, training and size of family fundamentally influence the rate of malaria as expected by financial hypothesis. A study by Asenso (1994) on malaria in 4 areas in particular Kojo Ashong, Barekese, Barekuma and Oyereko all from the Greater Accra Region of Ghana uncovered that elements that were seen as bringing about malaria are hunger, mosquitoes, over the top warmth, unreasonable drinking, flies, weakness, messy environment, risky water, terrible air and poor cleanliness. All the teenagers around then had no clue how the sickness was spread from individual to individual, while the manifestations of malaria was likewise as often as possible thought to be yellowish eyeball, chills and shuddering, cerebral pain, a sharp taste, body shortcoming and yellowish pee, the study included.
3. Methodology
The purpose of this research is to unfold the current pattern or trend of malaria cases in Kassena Nankana Municipality and come out with an adequate model for forecasting future trend of malaria. Data for the research was a secondary data for the years 2010 through to 2015 compiled by the records department of the War Memorial Hospital in the Kassena Nankana Municipal. This data was used to forecast future cases of malaria for the next two years (2017 and 2018). The statistical tool used in analysing the data in the research was Box-Jenkins ARIMA process of model analysis.
3.1. Box-Jenkins ARIMA Process of Model Analysis
Box-Jenkins forecasting models consist of a four-step iterative procedure as follows; Model Identification, Model Estimation, Model Checking (Goodness of fit) and Model Forecasting. The four iterative steps are not straight forward but are embodied in a continuous flow chart depending on the set of data under study.
3.2. Model Identification (Selecting an Initial Model)
We first Determine whether the series is stationary or not by considering the graph of ACF. If a graph of ACF of the time series values either cuts off fairly quickly or dies down fairly quickly, then the time series values should be considered stationary. If a graph of ACF dies down extremely slowly, then the time series values should be considered non-stationary. If the series is not stationary; it would then be converted to a stationary series by differencing. That is, the original series is replaced by a series of differences. An ARIMA model is then specified for the differenced series. Differencing is done until a plot of the data indicates the series varies about a fixed level, and the graph of ACF either cuts off fairly quickly or dies down fairly quickly. Once a stationary series has been obtained, then the form of the model to be used can be identified.
3.3. Model Estimation and Evaluation
Once a model is identified, the next stage for Box-Jenkins approach is to Estimate the parameters. In this research, the estimation of parameters was done using maximum likelihood estimation (MLE) with the help of the R-Consol statistical package.
3.3.1. Maximum Likelihood Estimation of ARIMA Model
For an independent and identically distributed (idd) data with marginal pdf  the density function for a sample
 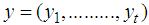 is simply the product of the marginal densities for each observation which is given as;
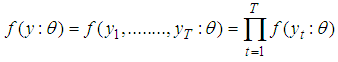 | (1) |
The likelihood function is this joint treated as a function of the parameters given the data y;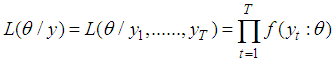 | (2) |
The log-likelihood then as a sample form is obtained as;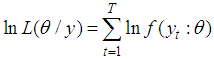 | (3) |
For a sample from a covariance stationary time series  the construction of the log-likelihood given above doesn’t work because the random variables in the sample
  are not independently and identically distributed. One solution is to try to determine the joint density function
  directly which requires among other things
  variance ARIMA process. An alternative approach relies on factorization of the joint density into a series of conditional densities and the density of a set of initial values.In order to illustrate this approach, we consider the joint density of two adjacent observations
  from the covariance stationary time series. The joint density can always be factored as the product of the conditional density
  given
given  and the marginal density of
  as;
as;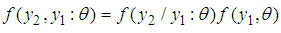 | (4) |
Hence for three (3) observations, the factorization becomes: | (5) |
In general, the conditional marginal factorization becomes;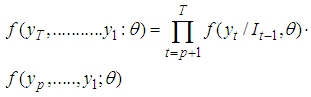 | (6) |
where 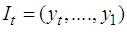 denotes the information available at time t and
  denotes the initial values. The log-likelihood function may then be expressed as:
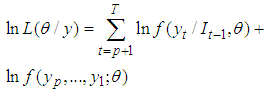 | (7) |
The full log-likelihood function is called the exact log-likelihood. The first term is called the conditional log-likelihood and the second term is called marginal log-likelihood for the initial values.In the maximum likelihood estimation of time series models, two types of maximum likelihood estimation (mles) may be computed. The first type is based on maximizing the conditional log-likelihood function. These estimates are called conditional MLEs and are defined by 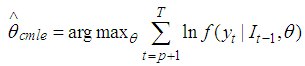 | (8) |
The second type is based on maximizing the exact log-likelihood function. These estimates are called exact MLEs and are defined by;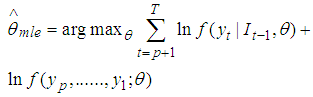 | (9) |
For stationary models,  and
and  are consistent and have the same limiting normal distribution. In finite samples,
  and
and  are generally not equal and may differ by a substantial amount if the data are close to being non-stationary.
3.3.2. Akaike Information Criterion (AIC)
The final model after estimation can be selected using a penalty function statistic such as the Akaike Information Criterion (AIC), a measure of the goodness of fit an estimated statistical model. Given a data set, several competing models may be ranked according to their AIC with one having the lowest information criterion value being the best. These information criterion judges a model by how close its fitted values, in terms of certain expected values. The criterion value assigned to a model is only meant to rank competing models and tell the best among the given alternatives. The criterion attempts to find the model that best explains the data with minimum of free parameters but also includes a penalty that is an increasing function of the number of estimated parameters. Generally, the AIC is calculated using the relation; | (10) |
where k is the number of parameters in the statistical model, and L is the maximized value of the likelihood function for the estimated model.
3.4. Model Checking (Goodness of Fit)
In this step, the model must be checked for adequacy by considering the properties of the residuals whether the residuals from an ARIMA model must have the normal distribution or should be random. An overall check of the model adequacy is provided by using the Ljung-Box statistic. The test statistic Q is given as; | (11) |
where (e) is the residual autocorrelation at lag, n is the number of residual and m is the number of times lags is included in the test.If the p-value associated with the Q statistic is small (p-value<α), then the model is considered inadequate. We then consider a new model and continue the analysis until a satisfactory model is obtained.
3.5. Forecasting
Once the model has been selected, the estimated residuals of the model is carefully examined to follow a white noise process. The parameters of the model are tested for significance and the final model estimated, then forecasting is done. Forecasting with this system is straight forward; the forecast is the expected values, evaluated at a particular point in time. Confidence intervals may also be easily derived from the standard errors of the residuals.
4. Results and Discussions
4.1. Preliminary Analysis
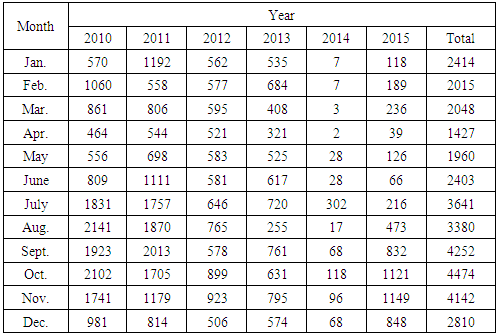
Table 4.1. Frequency on Monthly Malaria Cases in Kasena Nankana Municipality from 2010-2015
 |
| |
|
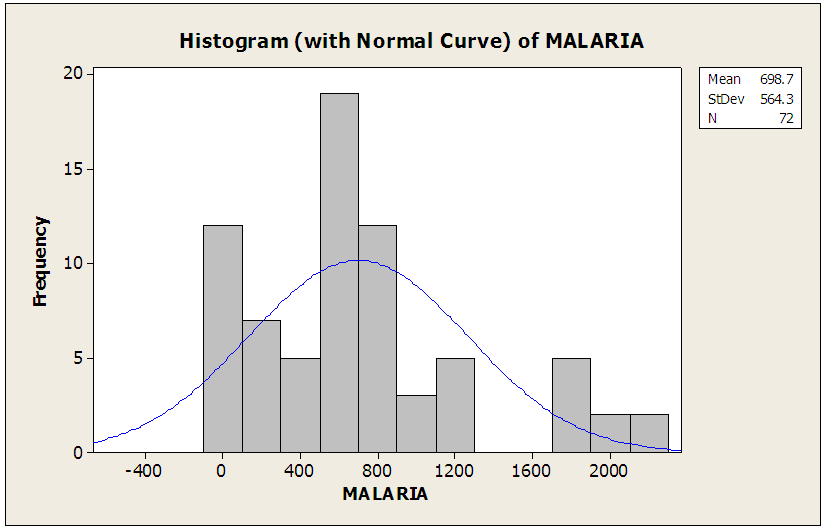 | Figure 4.1. Testing For the Normality of the Malaria Data |
This figure above is used to assess the normality of the data and as a result reveals that the data is not normally distributed but rather skewed to the right.
4.1.1. Descriptive Statistics of Reported Cases of Malaria
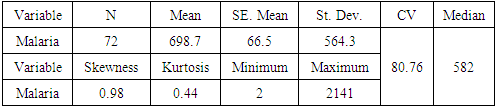
Table 4.2. Descriptive Statistics of Reported Cases of Malaria
 |
| |
|
From table 4.2 above the minimum malaria cases recorded was 2 with the maximum 2141, meaning malaria cases ranges from 2 to 2141 in the Navrongo Municipality in a month. It also appeared that the average number of malaria cases per month is tantamount to 698.7 which also implies the least expected number of malaria cases is 698.7 with median of 582 depicting that in Navrongo Municipality, the population is likely to be victimized by malaria more or less than the 582. The distribution of the data is positively skewed which implies the malaria case is fairly symmetrical and values slightly extends towards more positive values: meaning the time series data of malaria cases has more small values and few large values. Notwithstanding, the coefficient of variation which measures the variation of the malaria cases recorded is 80.76 percent with the positive kurtosis of 0.44. 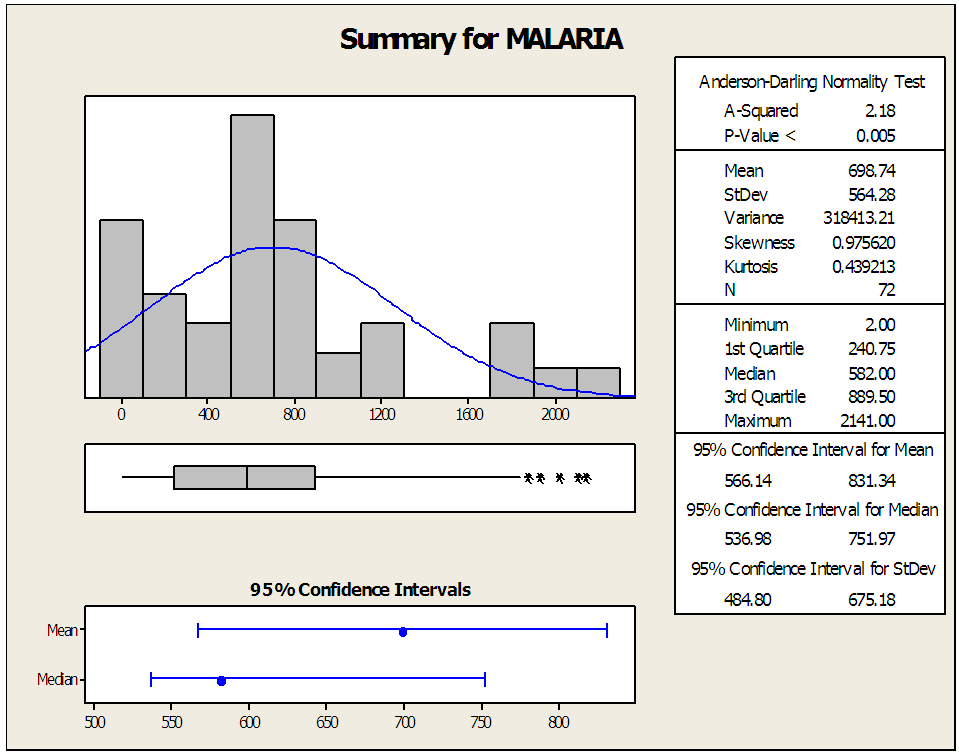 | Figure 4.2. Graphical Summary of Descriptive Statistics |
4.1.2. Normality Test Results
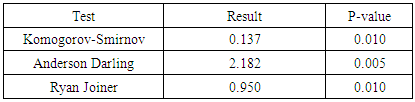
Table 4.3. Normality Test Results
 |
| |
|
In order to test the normality of the data, we test the null hypothesis that, there is no significant difference between the data and generated normal data. Obviously, all the p-values of the various test of normality in table 4.3 are less than 0.05. Therefore, we will reject the null hypothesis and conclude that there is difference between the data and the normal data generated indicating the data is non-normal.
4.2. Further Analysis
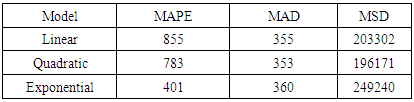
Table 4.4. Measure of Accuracy
 |
| |
|
Comparing the three models in order to select the best model as the trend of malaria cases in Navrongo Municipality, it is obvious that quadratic model has its two minimum of the measure of accuracy hence the trend of malaria cases follows quadratic trend.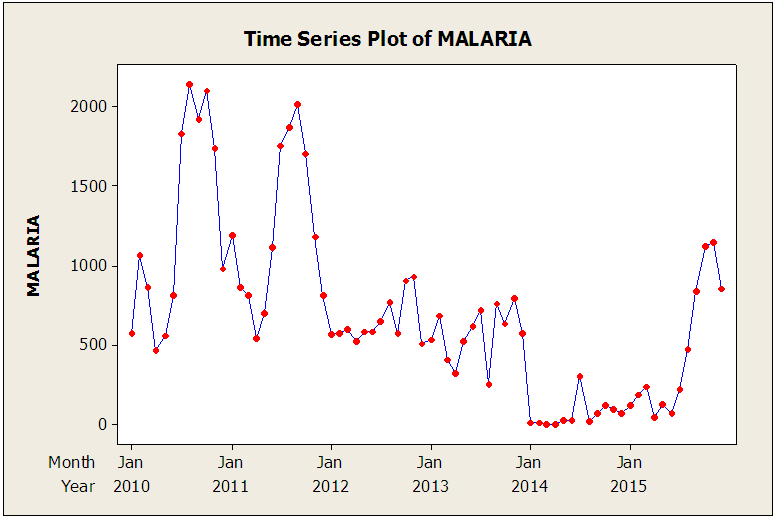 | Figure 4.3. Time Series Plot of Malaria Cases |
The figure above describes the nature of the malaria data in terms of time series plot as well as accessing the stationarity of the data. The cases of Malaria in January 2010 was quite moderate with reported cases 570 and inclined to 1060 in February 2010. At this point it declined absolutely in April 2010 with total malaria cases of 464. This figure was however maintained until a sharp upward movement in August 2010. Apparently, one could observe that the malaria cases drastically reduced to 544 in April 2011. Interestingly, the malaria cases became very rare in September 2011 with total malaria cases of 2013 and subsequently declined comprehensively in January 2014. The decline was steady till a jump in 2015 November with cases of 1149.
4.2.1. Trend Analysis
To get the best trend model for the data, we need to compare the Mean Absolute Percentage Error (MAPE), Mean Absolute Deviation (MAD) and Mean Square Deviation (MSD) of the three trends procedures namely: linear, quadratic and exponential trend and select the best, thus the minimum of MAPE, MAD and MSD.Table 4.5. ARIMA (1, 0, 3)
 |
| |
|
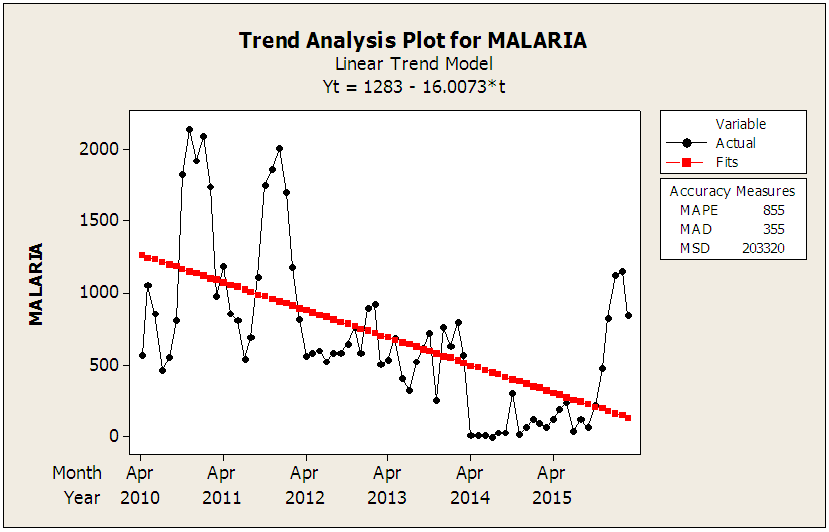 | Figure 4.4. Linear Trend Model |
4.2.2. Choosing the Best Model using MSE
Table 4.6. Choosing the Best Model using MSE
 |
| |
|
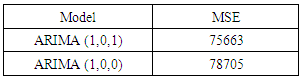
Comparing the two models, the one with the minimum MSE is the ARIMA (1, 0, 1) hence, it is the best model for forecasting the future cases of malaria of the Municipality.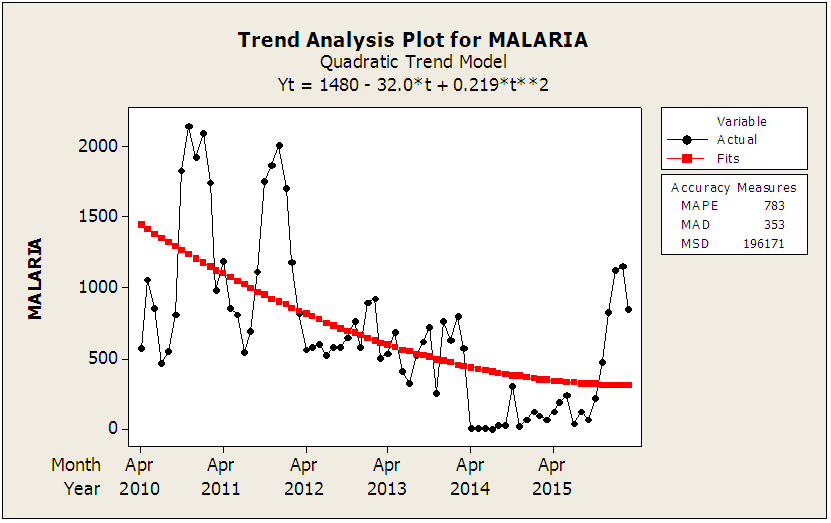 | Figure 4.5. Quadratic Trend Model |
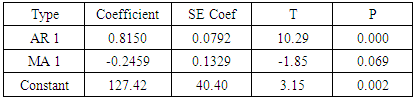
4.2.3. Final Estimate of Parameters for ARIMA (1,0,1)
Table 4.7. Final Estimate of Parameters for ARIMA (1,0,1)
 |
| |
|
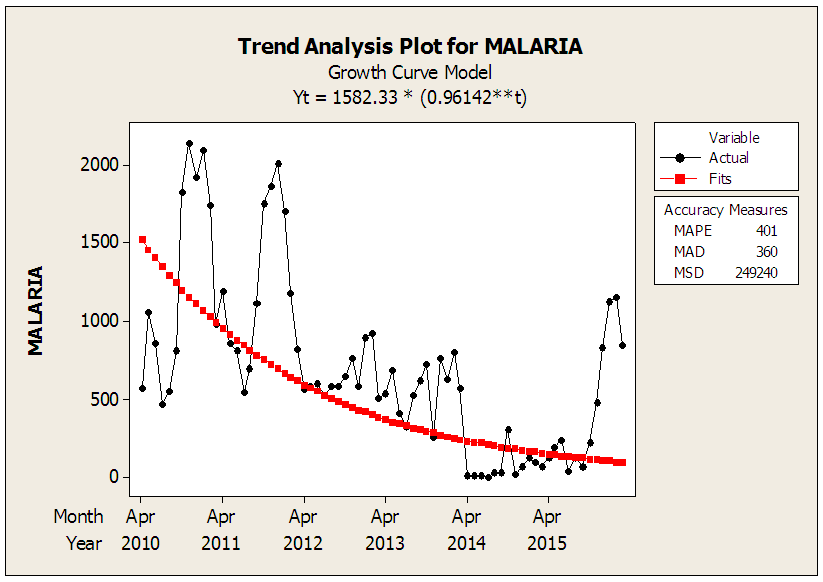 | Figure 4.6. Growth Curve Model |
4.2.4. Model Identification
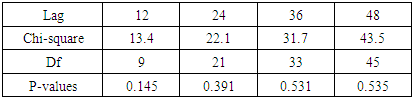
The ACF and PACF are the necessary tool that will help us in identifying the appropriate order of the moving average and the autoregressive respectively. The ACF together with PACF will again assist us determine whether or not the data is stationary.Table 4.8. Box-Pierce Chi-Square Test Statistics of ARIMA (1, 0, 1)
 |
| |
|
In order to test the adequacy of ARIMA (1, 0, 1), the following hypothesis needs to be tested; the model ARIMA (1, 0, 1) is adequate
 the model ARIMA (1, 0, 1) is not adequateThe decision rule is if and only if the P-Values of Box-Pierce test at non seasonal lag 12, 24, 36 and 48 are greater than 0.05 then the null (Ho) is accepted. Otherwise, the null hypothesis will be rejected. The p-values are all more than 0.05 (95% confidence interval) therefore we failed to reject the null hypothesis hence the model is good to forecast the future cases of Malaria in the Navrongo Municipality.
4.2.5. Autocorrelation Function for Malaria
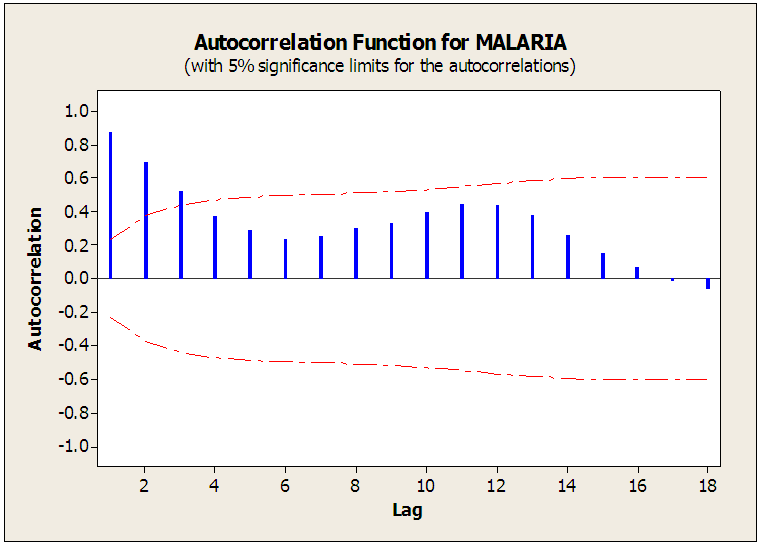 | Figure 4.7. The Autocorrelation Function of Malaria |
The autocorrelation function shown above (figure 4.7) of malaria reported cases from 2010 to 2015 in the Navrongo Municipality at 95% confidence level spikes significantly at lag 1, 2 and 3. After lag 3 it cuts off, implying that the moving average component of the ARIMA model is of order 3(MA=3). Furthermore, the ACF decayed very fast hence the malaria data is stationary.
4.2.6. Partial Autocorrelation Function for Malaria
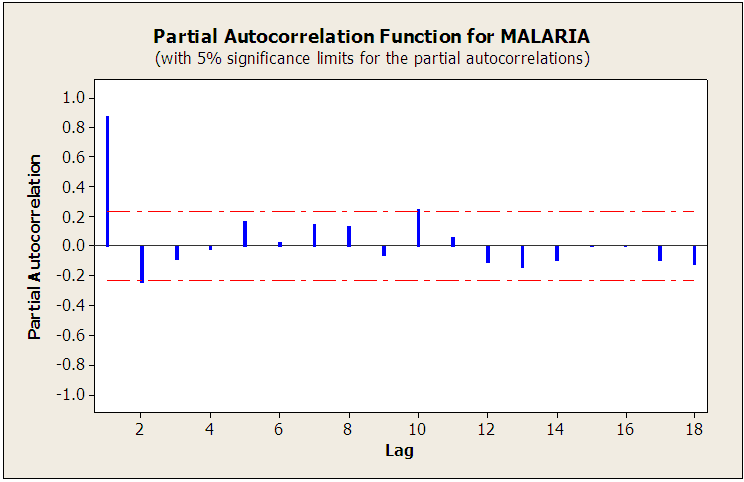 | Figure 4.8. The Partial Autocorrelation Function of Malaria |
The partial autocorrelation function of figure 4.8 at 95% confidence level significantly spikes at lag 1 and then quickly cut off. It again decay very fast which also means that the malaria cases as recorded is stationary.
4.2.7. Testing for Stationarity and Seasonal Components
A Stationary series has constant mean, constant variance and constant autocorrelation structure. The time series plot of monthly reported cases of malaria from January 2010 to 2015 seems to depict that the time series is stationary with the values having regular variability. However, the ACF decayed very fast at lag 3 suggesting that the data is stationary. The ACF significantly spikes at lag 1, 2 and 3 less than the periods hence there is no seasonal variations in the malaria data gathered.
4.2.8. Model Estimation
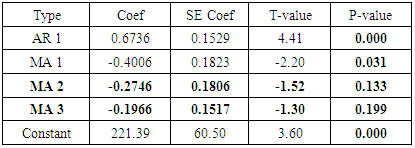
The procedure for choosing these models relies on choosing the model which passes all the tests and all the assumptions. The initial model was ARIMA (1, 0, 3). Some of the parameters of the moving average were not significant, the p-values of the MA2 and MA3 having p-values greater than 0.05 as shown in the table below. Significantly, in order to obtain a good model the p-values of the parameters must be significant enough thus, their p-values must be strictly less than 0.05. The tentative models that were obtained from the original model were ARIMA (1, 0, 1) and ARIMA (1, 0, 0) after dropping MA2 and MA3 due to their insignificant contribution. To obtain a good model, the two models ARIMA (1, 0, 1) and ARIMA (1, 0, 0) were further scrutinized using mean square error (MSE). In this case the model with minimum MSE values was chosen as the best model to predict the future cases of Malaria cases in the Navrongo Municipality.
4.2.9. Model Checking (Diagnostic Test)
This involves the ACF/PACF plots of the residuals and the Residuals (White noise) to ascertain the accuracy of the model.In accordance with ARIMA model assumptions of time series: white noise assumes that the residuals have zero mean, constant variance and the autocorrelation of any two observations of such sequence is always zero (uncorrelated). The figure 4.9 of ACF residual plot of the standardized residuals shows no significant autocorrelation. Also the p-values of the Box-Pierce Statistics for each lag up to 48 are all significant indicating that the model is adequate and reliable enough. The probability plot of the residuals also shows a straight line, it is therefore reasonable to assume that the observed sample comes from normal distribution. The residuals versus fit of figure 4.11 show that the variance of residuals is constant. The above supporting proves gave reasons to use the ARIMA (1, 0, 1) as the best model.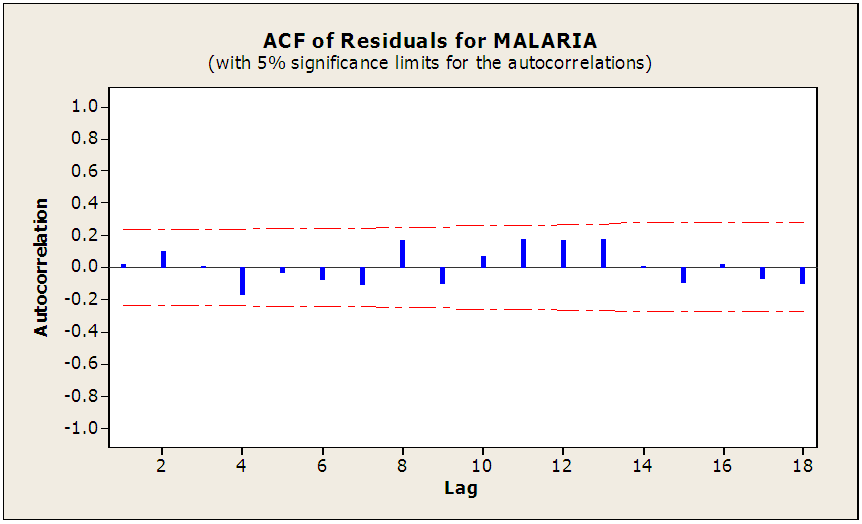 | Figure 4.9. ACF of Residuals for Malaria |
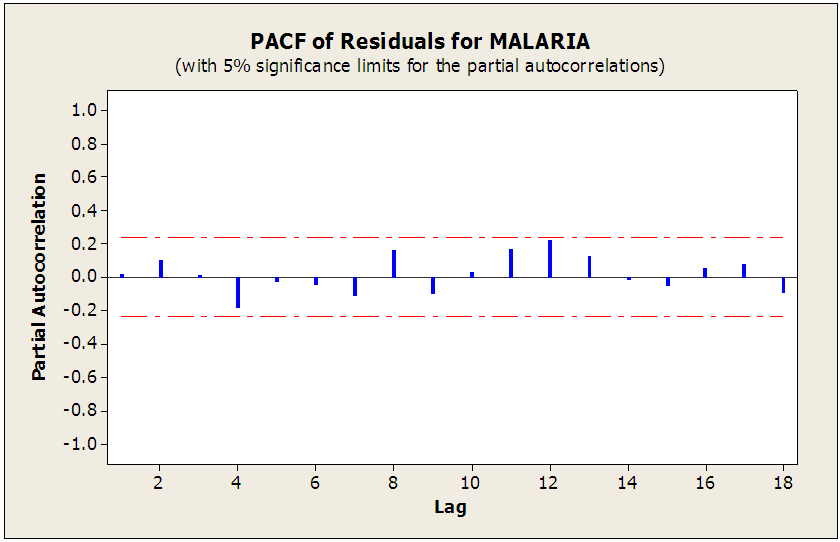 | Figure 4.10. PACF of Residuals Plot for Malaria |
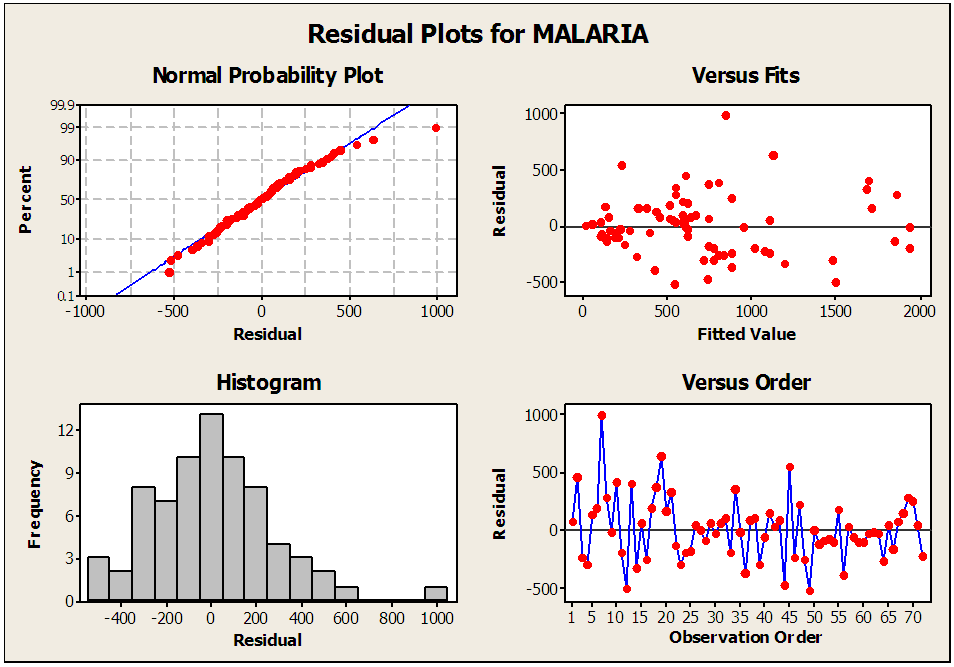 | Figure 4.11. Residuals Plot for Malaria |
4.2.10. Model Fitting and Forecasting
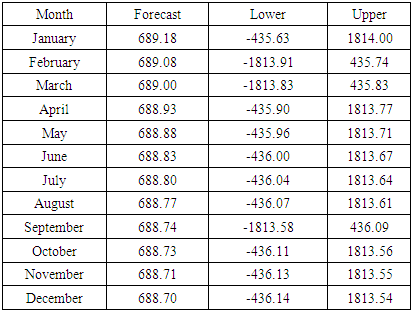
With the help of the ACF and PACF plots, tentative models were fit to the data. ARIMA (1,0,1) was noted to fir the data well. Further adequacy test on the model also confirmed the validity of the selected model. The model was then used to forecast for monthly cases of malaria for the next two years in the municipality as shown in the table below.Table 4.9. Forecasted Malaria Cases for 2018 in Navrongo Municipality
 |
| |
|
5. Conclusions
This research was undertaken with the prior motive to develop an adequate model for forecasting future trends. It evolved that ARIMA (1, 0, 1) fits the data well.The trend analysis indicated that malaria cases at the Navrongo Municipality is growing at a constant quadratic rate. Therefore Ministry of Health together with the health workers should intervene in the creation of awareness of this silent killer disease. The model also proved that the model is adequate for forecasting of monthly cases of malaria in the Municipality. Moreover, the model was found to have a good fit hence appropriate for the study. Therefore hospitals in the Municipality should expect a reduction in the number of malaria cases.
References
| [1] | Henderson, D. A. (1999). Lessons from the eradication campaigns. Vaccine, 17, S53-S55. |
| [2] | World Health Organization/UNICEF (2004). The Africa malaria report 2003. Geneva |
| [3] | Breman J.G. Alilio MS, mills A (2004). conquering the intolerable burdine of malaria; what is new, what is needed. American journal of tropical Medicine and hygiene. |
| [4] | Phillips, R. S. (2001). Current status of malaria and potential for control. Clinical microbiology reviews, 14(1), 208-226. |
| [5] | Ukoli, F. M. A. (1990). Introduction to parasitology intropical Africa. Textflow Ltd., Ibadan. 252-266. |
| [6] | Shepard, D. S., Ettling, M. B., Brinkmann, U., & Sauerborn, R. (1991). The economic cost of malaria in Africa. Tropical medicine and parasitology: official organ of Deutsche Tropenmedizinische Gesellschaft and of Deutsche Gesellschaft fur Technische Zusammenarbeit (GTZ), 42(3), 199-203. |
| [7] | Schönfeld, M., Miranda, I. B., Schunk, M., Maduhu, I., Maboko, L., Hoelscher, M., ... & Löscher, T. (2007). Molecular surveillance of drug-resistance associated mutations of Plasmodium falciparum in south-west Tanzania. Malaria Journal, 6(1), 1. |
| [8] | Greenwood, B.M., Marsh, K. and Snow, R.W. (1991). Why do some African children develop severe malaria? Parasitology Today 7(10):277-81, DOI:10:101610169-4758(91)90096-7. |
| [9] | Taiar A, Chandler C, Al Eryani S, Whitty CJ. (2007). Nov Knowledge and practices for preventing severe malaria in Yemen: the importance of gender in planning policy. Health Policy Plan.; 24(6): 428–37. |
| [10] | Minja, H., Schellenberg, J. A., Mukasa, O., Nathan, R., Abdulla, S., Mponda, H., ... & Obrist, B. (2001). Introducing insecticide‐treated nets in the Kilombero Valley, Tanzania: the relevance of local knowledge and practice for an Information, Education and Communication (IEC) campaign. Tropical Medicine & International Health, 6(8), 614-623. |
| [11] | Victora, C. G., Schellenberg, J. A., Mushi, A., de Savigny, D., Schellenberg, D., Mshinda, H., ... & Tanzania IMCI MCE Baseline Household Survey Study Group. (2003). Inequities among the very poor: health care for children in rural southern Tanzania. The Lancet, 361(9357), 561-566. |
| [12] | Holtz, T. H., Marum, L. H., Mkandala, C., Chizani, N., Roberts, J. M., Macheso, A., ... & Kachur, S. P. (2002). Insecticide‐treated bednet use, anaemia, and malaria parasitaemia in Blantyre District, Malawi. Tropical Medicine & International Health, 7(3), 220-230. |
| [13] | Nuwaha, F. (2001). The challenge of chloroquine-resistant malaria in sub-Saharan Africa. Health policy and planning, 16(1), 1-12. |
| [14] | Appawu, M., Owusu-Agyei, S., Dadzie, S., Asoala, V., Anto, F., Koram, K., & Fryauff, D. J. (2004). Malaria transmission dynamics at a site in northern Ghana proposed for testing malaria vaccines. Tropical Medicine & International Health, 9(1), 164-170. |
| [15] | Mensah, O. A., & Kumaranayake, L. (2004). Malaria incidence in rural Benin: does economics matter in endemic area?. Health Policy, 68(1), 93-102. |
| [16] | Asenso-Okyere, W. K. (1993, December). Socioeconomic factors in malaria control. In World health forum (Vol. 15, No. 3, pp. 265-268). |
| [17] | National Institute of Allergy and infectious Disease (2007). Understanding malaria; fighting an ancient scourge. NIH Publication No. 07-7139. |

 Abstract
 Reference
 Full-Text PDF
 Full-text HTML