-
Paper Information
- Paper Submission
-
Journal Information
- About This Journal
- Editorial Board
- Current Issue
- Archive
- Author Guidelines
- Contact Us
International Journal of Statistics and Applications
p-ISSN: 2168-5193 e-ISSN: 2168-5215
2016; 6(6): 408-415
doi:10.5923/j.statistics.20160606.10

Permutation Approach in Obtaining Control Limits and Interpretation of out of Control Signals in Multivariate Control Charts
 Abstract
 Reference
 Full-Text PDF
 Full-text HTML
Ikpotokin O.1, Ishiekwene C. C.2
1Department of Mathematics and Statistics, Ambrose Alli University, Epoma, Nigeria
2Department of Mathematics, University of Benin, Benin City, Nigeria
Correspondence to: Ikpotokin O., Department of Mathematics and Statistics, Ambrose Alli University, Epoma, Nigeria.
| Email: |  |
Copyright © 2016 Scientific & Academic Publishing. All Rights Reserved.
This work is licensed under the Creative Commons Attribution International License (CC BY).
http://creativecommons.org/licenses/by/4.0/

The use of multivariate control charts in manufacturing and service industries is often avoided because of the complexity in its development and interpretation of out of control signals. Most multivariate control charts require a specific distributional assumption to establish their control limits, but the bootstrap and permutation methods does not rely on such distributional assumption. Control limit obtain from the bootstrap method is approximate in nature while that of permutation is exact. This study introduces the permutation method in obtaining exact control limits as well as interpreting out of control signals in multivariate Hotelling’s T2 control charts. A performance study of the methods using empirical data sets shows that results from the proposed Permutation method when compared with other existing methods perform better in identifying out of control signal rather than stopping the entire processes.
Keywords: Exact control limits,Hotelling’s T2, out-of-control signals, Permutation p-values
Cite this paper: Ikpotokin O., Ishiekwene C. C., Permutation Approach in Obtaining Control Limits and Interpretation of out of Control Signals in Multivariate Control Charts, International Journal of Statistics and Applications, Vol. 6 No. 6, 2016, pp. 408-415. doi: 10.5923/j.statistics.20160606.10.
Article Outline
1. Introduction
- An important part of statistical process control chart is the setting of control limits, which plays a major role in determining whether a given process is in control or not. Since control limits assists in establishing whether the observed data are statistically significant or not, any statistical method that will guarantee its proper computation should be developed and employed so that the desired false alarm rate (similar to probability of making Type 1 error) will be minimized or exactly
 [1]. When a control chart signals, process quality managers must initiate a search for the cause of the process disturbance. The standard practice is to plot univariate control charts on the individual quality characteristics. However, the use of separate charts does not allow information about the correlation of variables to be utilized, hence the multivariate control chart [2]. One common method of constructing multivariate control charts is based on Hotelling’s T2 statistics [3-6]. Traditionally, control chart is based on the assumption that monitoring statistics follow some form of distributional assumption. The modern time practice is that this assumption is usually violated and a control limit obtained through this process may be inaccurate thereby increasing the rate of false alarms [7-9]. To address the problem of distributional assumption, univariate bootstrap control charts were introduced to obtain control limits [10-16]. Generally, univariate control charts involves the computations of one variable, and any decision based on these charts when two or more variables are involved can increase false alarm rate, hence the nonparametric multivariate control charts, such as the bootstrap method may provides better alternative [17-21]. Most of the nonparametric multivariate Hotelling's T2 control limit obtained in the literature is from the bootstrap method. However, the bootstrap method is approximate in nature since sampling is carried out with replacement. To reduce the problem of violating multivariate distributional assumption as well as avoiding the problem of approximation, this study proposed the permutation method so as to obtain exact control limit. The proposed permutation method is exact in nature because sampling is done without replacement.
2. Proposed Permutation Method in Obtaining Hotelling’s T2 Control Limit
- To reduce abnormal behaviours when multivariate distributional assumption is violated as well as overcoming the problem of approximation [22, 1], the permutation procedure is proposed to obtain exact control limit. Suppose there are
 quality characteristics with
  set of observations
 as can be summarized in the variance covariance matrix below:
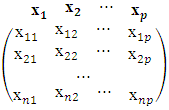 The permutation algorithm for setting exact Hotelling’s T2 control limit is given by the following Steps:STEP 1. Compute Hotelling’s
  statistic with
  observations from a given dataset as:
  STEP 2. Generate permutation sample from the initial
  statistics in Step 1 without replacement as:
  STEP 3. Compute the control limits by taking B average of
  percentile values as:
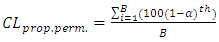 | (1) |
 declare that specific observation as out of control.For example, if there are
  there are
  ways of arrangements as follows:
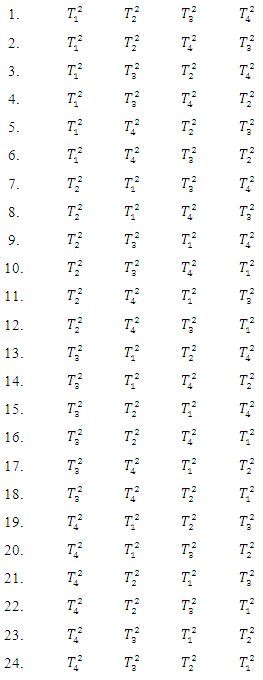 From the arrangement above, there are
  possible terms and
  distinct terms and the procedure is obtained as follows:1. Obtain
  ways each for the 1st column, i.e.
  for
for  2. Obtain
  way for each of the ways in 1st column to have 2nd column, i.e.
  for each of the 6 ways in 1st column 3. Obtain
  way for each of the 2ways in 2nd column to have 3rd column, i.e.
 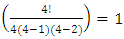 way for each of the way in 2nd column.4. Obtain
 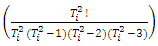 way for each of the way in 3rd column to have 4th column, i.e.
 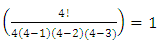 way for each of the way in 3rd column. Or complete the 4th (last) column by filling the value of
  that is yet to appear in each of the row.5. Obtain 100(1-α) percentile for each row.6. Obtain the permutation control limit by taking the average of the 100(1-α) percentile.
2.1. Proposed Permutation P-values Method in Identifying out of Control Signal
- The problem of identifying quality characteristics that is responsible for an out of control signals has been an issue in multivariate control charts [23-30]. The introduced of Multivariate statistical process control charts based on the approximate sequential χ2 test to detect a change in the non-centrality parameter was by [31]. The skipping strategy to reduce the effect of the autocorrelation on the T2 chart’s performance was proposed by [32]. A very useful approach to the diagnosis of an out of control signal is to decompose the Hotelling’s
 statistic into components that reflect the contribution of each of the d-dimensional vector of quality characteristics [23]. The following Steps Modified [23] in identifying out of control signal in multivariate control chart.STEP 1.For a d-dimensional vector of quality characteristics, the first row is expressed as:
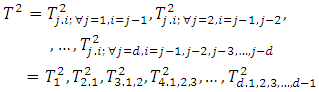 STEP 2.Obtain the Critical Values from f-distribution for each of
  and
and  terms in [23] such that:
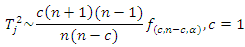 and
and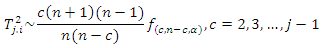 are used to check whether the
  variable is conforming to the relationship with other variables or not. STEP 3.Repeat Steps 1 and 2 for other rows based on the number of quality characteristics (d!) and obtain the distinct terms (d*2d-1) for both the unconditional
  and conditional
  terms.STEP 4.Obtain the permutation p-values for each of
  and
and  terms such that:
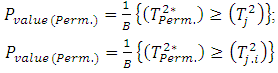 STEP 5.Use the various
  in Step 4 to assess whether there is a significant difference or not. If
 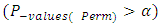 value, it means that
  or
or  is (are) not responsible for the out of control signal(s). But when
 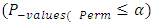 value, it means that
  or
or  is (are) responsible for the out of control signal(s).
 3. Application to Numerical Example
- By way of illustration, the set of data were obtained from the production processing of Owel Industries Nig. Ltd., a Family Delight Pure Soya Oil Production (FDPSOP) Company in Ekpoma, Edo State, Nigeria. Four quality characteristics (X1, X2, X3 and X4) representing phosphoric acid (milliliters), water (liters), caustic soda solution (kg) and industrial salt (kg) respectively at the neutralizer stage, under which forty five samples were recorded as shown in Columns (X1, X2, X3 and X4) of Table 1. The choice of data used in this study is the presence of sub standard product of cooking oil displayed in the local market in Nigeria. Another motivation is the challenges faced by Quality Control Managers to identify the variable that is responsible for out of control signals or stop the entire production process. Stopping the process will result to waste of material resources and continuing with the process without identifying the variable will lead to sub standard product. The urge to solve these problems gave rise to this research work.
|
 Statistic
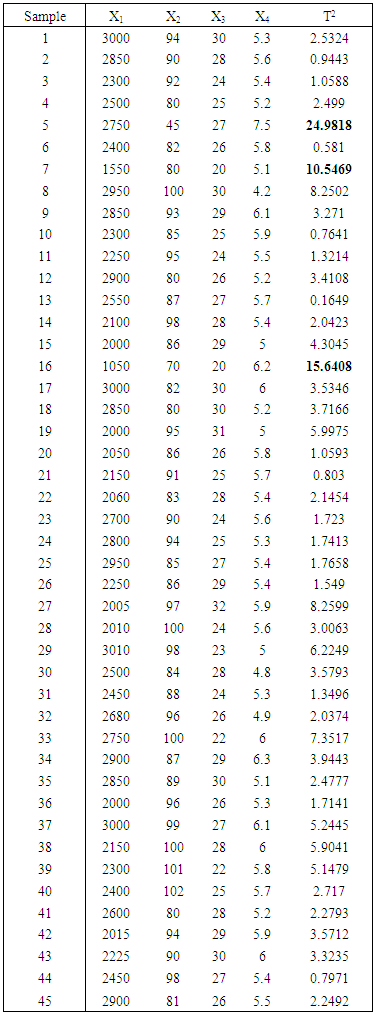
3.1. Test of Correlation Coefficient
- To apply any multivariate control chart methodology, there is need to know whether there exists inter-correlation among the four quality characteristics. From the given data, the statistics of mean vector
 variance covariance matrix
  and correlation matrix
  are given as follows:
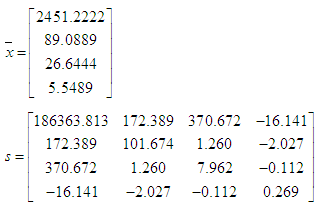 and
and * Significant at 0.05 ** Significant at 0.01The correlation matrix shows that there exists inter – correlation among the four quality characteristics, hence the need for multivariate control chart. The values of Hotelling’s
  statistic is computed for each sample and summarized in the last column of Table 1. The proposed permutation procedures presented in Session 2.0 was translated to Permutation Generic Code, permutation samples were replicated 13,948 times from the Hotelling’s
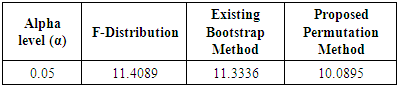
  statistic, and control limit is determined to be 10.0895 by taken the B average of 100(1-α) percentile value computed for each sample. Table 2 shows the results of control limits obtained from two existing methods (F-distribution and Phaladigalon’s [19]) with the proposed permutation methods at α = 0.05 level of significant and the control chart to monitor the observations is shown in Figure 1.
|
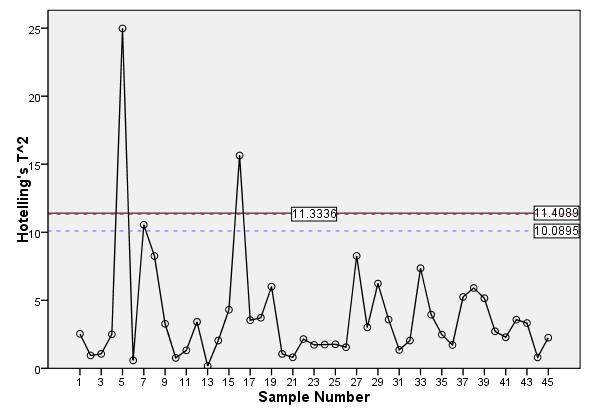 | Figure 1. Multivariate Hotelling’s T2 Control Chart for the given Data |
3.2. Identification of Out of Control Signal by the Critical and P-values Methods
- Table 2 and Figure 1 shows that samples 5, 7 and 16 are out of control, but we do not know which or set of quality characteristic(s) that is(are) responsible for the signals, hence the need to identify those quality characteristics by using the proposed p-values methods. To explain this procedure, focus shall be on Samples 5. Table 3 shows all the unconditional and conditional
 values computed for Sample 5 and compared with the various critical and p-values from both existing and proposed methods.
|
 Terms with p-values (Number of
  in Parenthesis)
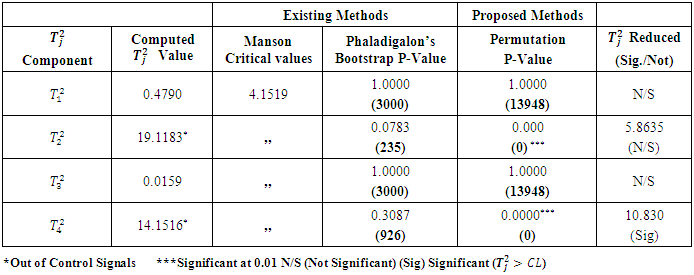
3.3. Discussion and Interpretation of Out of Control Results
- Results in Table 2 shows that control limits obtained from both F-distribution and Phaladiganon’s methods where able to detect out of control signal for Samples 5 and 16, but consider Sample 7 to be under control. This has demonstrated the ability of both methods to detect large shift in the process mean vector. However, the proposed permutation method was able to detect out of control signals in additional one Sample (7), this has demonstrated the ability of the proposed method to detect shift better in any process. Table 3 shows all the unconditional and conditional
 values for Sample 5 that were computed and compared with their respective critical and p-values. From Table 3,
  of the four unconditional
  terms associated with Sample 5 are significant, which means
  (water in liters) and
  (industrial salt in kg) are responsible for the out of control signals individually. However, results from Phaladiganon’s p-values did not support this finding. This has further demonstrated the ability of the proposed method to performed better in setting control limits and identifying out of control signals over the existing method. To reduce the problem of out of control signal facing variables X2 and X4, remove
  separately from
 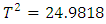 of Sample 5 and compare with the control limits whether they are significant or not. i.e.
 Hence, we conclude that variable X2 is not significant. However, result obtain when
  is removed from
  shows that
  (industrial salt in kg) is significant when compared with Control Limits from the proposed methods in Table 2, hence we move to the next step, i.e.
  In Table 4, the first conditional
  terms associated with Sample 5 shows that
  and
and  of the twelve conditional
  terms have significant values, which means the relationship between
  (water) and
  (phosphoric acid);
  (water) and
  (caustic soda);
  (water) and
  (industrial salt);
  (industrial salt) and
  (phosphoric acid);
  (industrial salt) and
  (caustic soda) respectively are responsible for out of control signals. To reduced the problem of out of control signal facing these 1st conditional variables, remove
  and
and  separately from
  of Sample 5 and compare with the control limits whether they are significant or not.
  are not significant as shown in the last columns of Table 5, while
  and
and  are significant, hence we move to the next step, i.e.
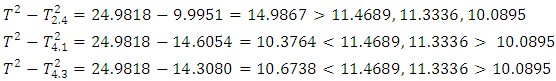 A similar interpretation of results from Table 5 shows that
  and
and  of the second conditional terms are significant, hence the last step in Table 6 shown no significant difference.
|
 Terms with p-values (Number of
  in Parenthesis)
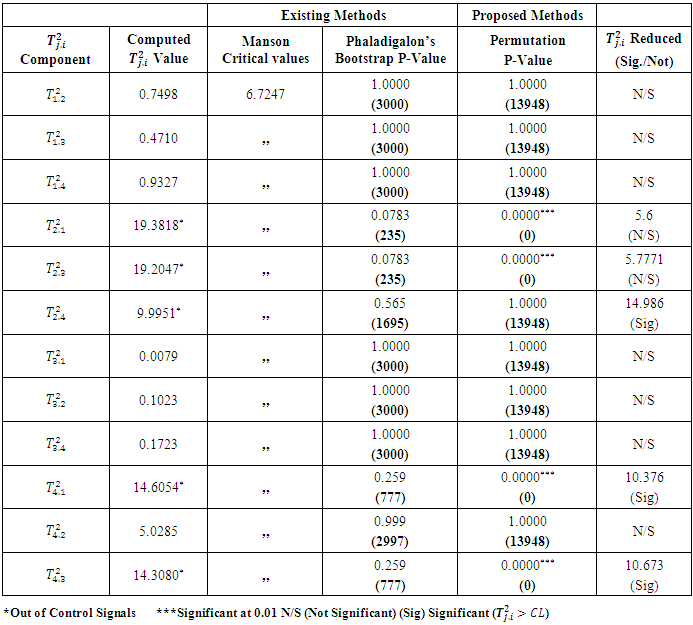
|
 Terms with p-values (Number of
  in Parenthesis)
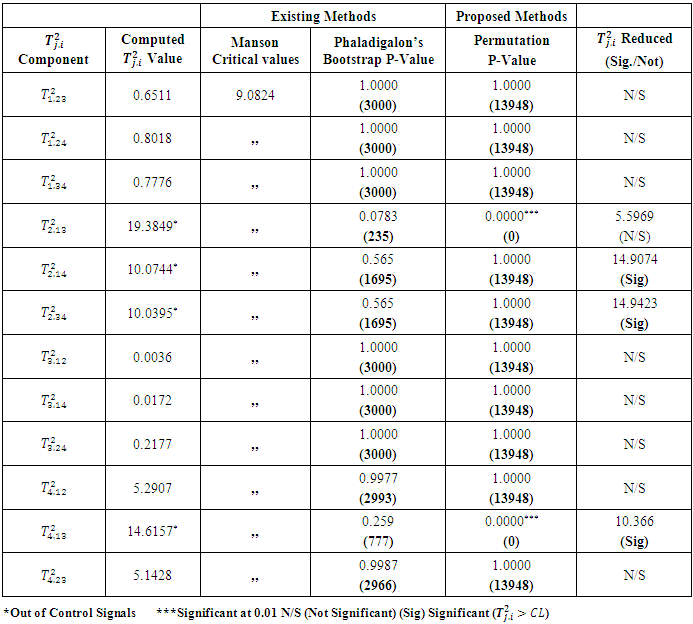
|
 Terms with p-values (Number of
  in parenthesis)
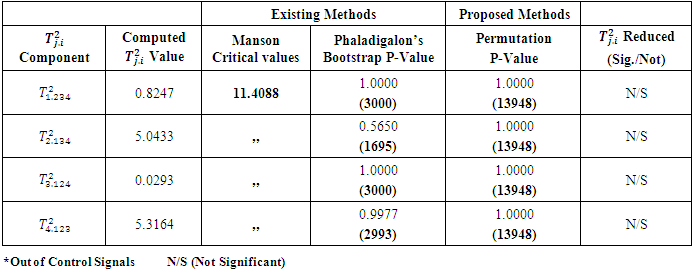
4. Conclusions
- This study specifically considered the permutation method as a means of determining exact Hotelling’s T2 control limits. Procedures that can carry out a systematic generation of permutation replications of two or more quality characteristics have been proposed in this work; it is straight forward but computer intensive. However, to identify the root cause of change when multivariate control charts signals, this work also considered the p-value method in identifying the variable(s) that is(are) responsible for the out of control signals. It is of importance to note that the univariate control chart practice is to stop the entire process as a result of out of control signal at variable X2 and X4, this will result to waste of material resources or low quality or sub standard products if the process continuous. With the proposed multivariate methods, one variable is being conditioned on the other(s) as shown in Table 3. The implication of these findings is the advantages of multivariate control charts; by combining variable X2 or X4 with any other variables until there is no out of control signals as observed in Table 6. This was achieved when variable X2 was combined with X1, X3 and X4 on one hand, and X4 with X1, X2, and X3 on the other hand. This finding will enhance production process and avoid waste of material resources and improve the quality of product.