-
Paper Information
- Previous Paper
- Paper Submission
-
Journal Information
- About This Journal
- Editorial Board
- Current Issue
- Archive
- Author Guidelines
- Contact Us
International Journal of Statistics and Applications
p-ISSN: 2168-5193 e-ISSN: 2168-5215
2016; 6(6): 386-390
doi:10.5923/j.statistics.20160606.07

A Chi-Squared approach to Obtaining Missing Values on Egg Production
 Abstract
 Reference
 Full-Text PDF
 Full-text HTML
Ogoke U. P.1, Nduka E. C.1, Soyinka A. T.2
1Department of Mathematics and Statistics, University of Port Harcourt, Nigeria
2Department of Research and Training, Federal Neuro-Psychiatric Hospital Aro, Nigeria
Correspondence to: Ogoke U. P., Department of Mathematics and Statistics, University of Port Harcourt, Nigeria.
| Email: |  |
Copyright © 2016 Scientific & Academic Publishing. All Rights Reserved.
This work is licensed under the Creative Commons Attribution International License (CC BY).
http://creativecommons.org/licenses/by/4.0/

In this paper, we estimate the missing values in the outcome of an experiment that involved four different types of poultry birds fed over a period of eighteen months in four feed weight replicates per month. The outcome which is the number of eggs produced monthly by the birds is stochastically dependent on two inputs (feed weight and months). The study assumed a cubic polynomial interaction that follows a binomial series expansion between the inputs. A regression equation was used to link the outcome and the input interaction. The regression coefficients of the link function was determined by the method of ordinary least square via multiple imputation technique while replacing the missing values with the available outcomes in turn. So for each imputation, there is a corresponding likelihood value obtained as estimate of the missing data from the regression equation. The probability of the chi-square goodness of fit was then used to determine the maximum likelihood value of the missing data by plotting the graph of the obtained chi-square density against the available outcomes.
Keywords: Missing values, Cubic interactions, Multiple imputations, Chi-Square density
Cite this paper: Ogoke U. P., Nduka E. C., Soyinka A. T., A Chi-Squared approach to Obtaining Missing Values on Egg Production, International Journal of Statistics and Applications, Vol. 6 No. 6, 2016, pp. 386-390. doi: 10.5923/j.statistics.20160606.07.
Article Outline
1. Introduction
- Missing data is an important aspect of statistical science that involves the unavoidable absence of an information as a result of factors which includes no response from the respondent due to acclaimed privacy violation, dropout of respondent in the middle of a research procedure and so making further information not available and finally as a result of initial improper capturing of critical statistics thus making such data inappropriate as a secondary source. However due to the fact that missing data reduce the representativeness of the sample and can therefore distort inferences about the population because majority of the statistical tools requires a complete data set for analysis; then there is need to prevent missing data or to properly estimate missing data before proceeding for further analysis. In situation where missing data are likely unavoidable, the researcher is advised to use statistical methods like statistical design and sampling techniques that allow for robustness in case of missing values. Hence the ultimate aim is to develop properly modeled statistical methods to estimate the missing values so that research work will not die prematurely. There are two major methods of estimating missing data in statistical science which are multiple imputations (MI) and maximum likelihood (ML) methods. Recently, modification of multiple imputations via local least square imputation (LLS) and Bayesian principal component analysis (BPCA) have been commonly used along with some form of neural network approach. Though MI and ML has been extensively used over years for estimating missing data, the precision and accuracy of the obtained estimate via sufficient statistics and standard error computation is still sketchy and difficult. Hence in this study, we bridged the advantages of MI and ML to obtain likelihood estimates of a missing data and confirm the most appropriate maximum likelihood estimate via chi square density approach (Aguilar (2003) [1], Allison (2006) [2], Stoop et al (2010) [3]).
2. Model Assumption
- Let the number of eggs produced
 be dependent on the input factors feed weight
  and months
  . Then
  is a function of the interaction between feed weight
  and months
  that is
 | (1) |
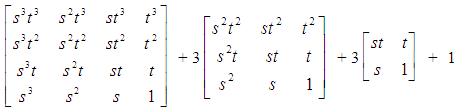
 and months
  has different levels of cubic, quadratic, linear and constant interaction effect on the birds then by binomial expansion
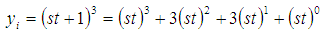 | (2) |
 | (3) |
 | (4) |
 | (5) |
 | (6) |
 | (7) |
3. Application
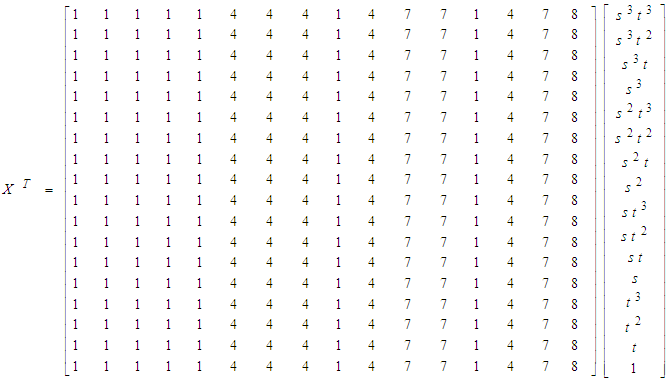
- The matrix of the egg produced for each month by the different categories of birds along with its missing spots is given below in equation (8)
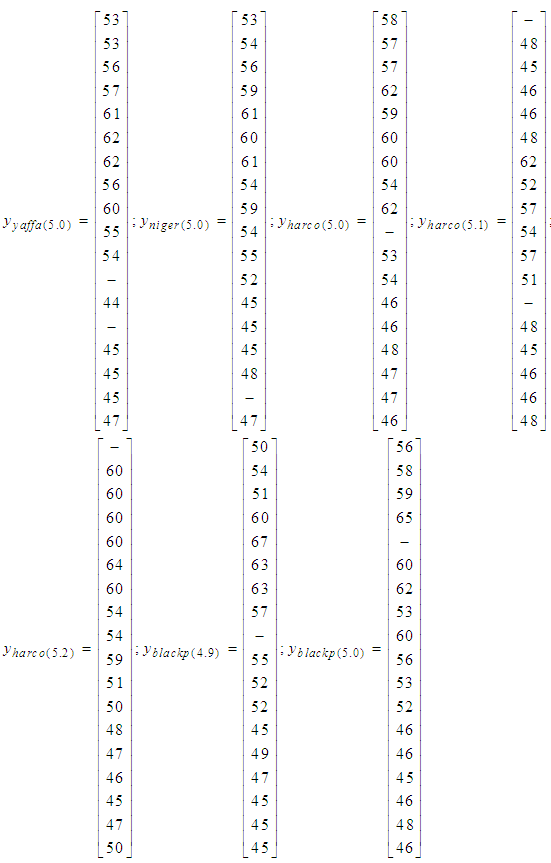 | (8) |
4. Methodology
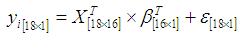
- Missing values Estimation stepsa. Substitutes the missing values in turn that is one after the other with each of the available outcome
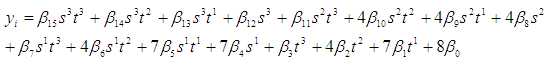
 .b. At each substitution obtain regression coefficients
  and estimate the missing value
  .c. For each available outcomes
  denoted as
  there is corresponding equivalent value estimated for the missing values (-) denoted as
  .d. Recall the chi square goodness of fit. Then evaluate
 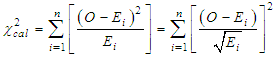 based on the null hypothesis
  . That is we obtain the observed value
  that has the maximum chi-square probability of not been significantly different from the missing value estimates. e. Then the Maximum Likelihood Estimate for the missing value is located at the point where the graph of
  against
  and
and  is minimum or at the point where the density of the chi square calculated against
  and
and  at specified degree of freedom k is maximum.
 5. Data Analysis and Result
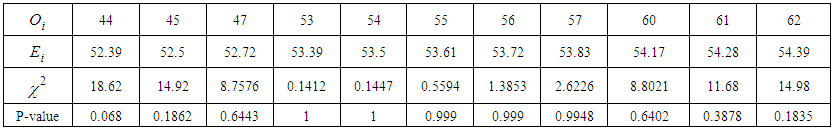
- 1. Estimating the missing value in the column
 with the feed weight of
  (column 6) in equation (8).
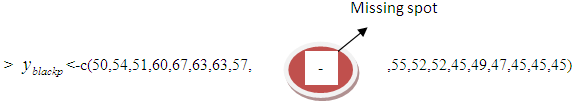
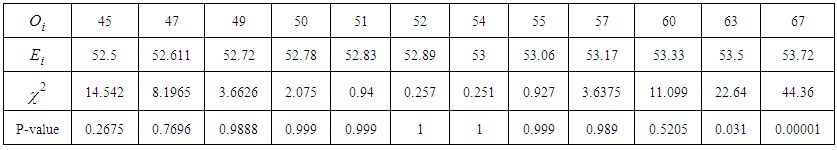 | Table 1. |
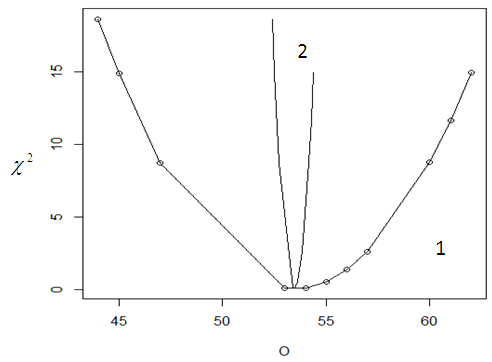
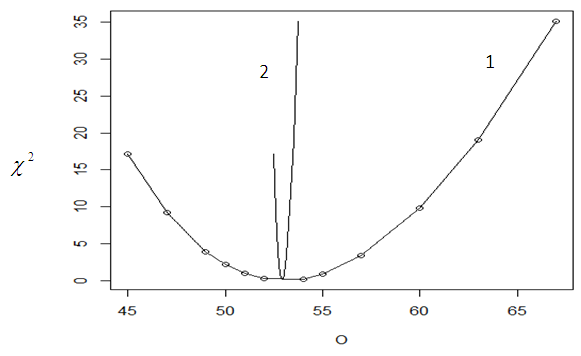 | Figure 1. Graph of Chi-square  value against the observed O {1} and the expected value value against the observed O {1} and the expected value  {2} {2} |
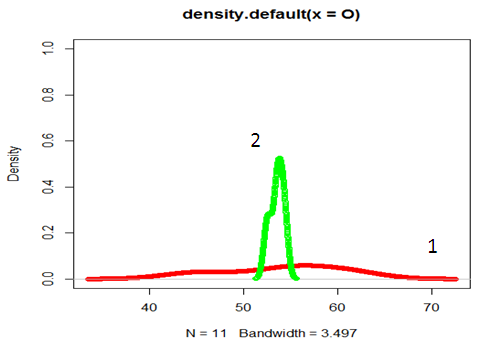
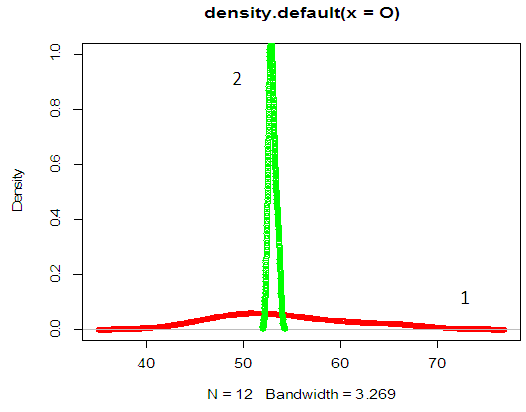 | Figure 2. Graph of  probability density against observed O {1} and the expected values probability density against observed O {1} and the expected values  {2} {2} |
 with the feed weight of
  (column 1) in equation (8).
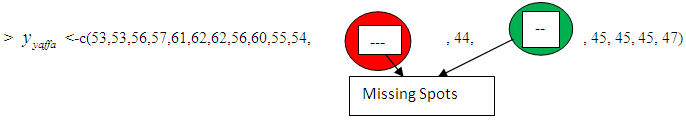
 | Table 2. |
 | Figure 3. Graph of Chi-square value against the observed O {1} and the expected value  {2} {2} |
 | Figure 4. Graph of  probability density against observed O{1} and the expected values probability density against observed O{1} and the expected values  {2} {2} |
 ;
;  ;
;  ;
;  ;
;  . See appendix for the r program.
6. Conclusions and Recommendations
- The chi square approach to estimating likelihood estimate of missing value(s) in data sets via multiple imputations and obtaining its maximum likelihood estimate via area under a chi square density is an approach that is easy to apply in practice. The approach is applicable to any factorial experiment where levels of each factors as well as its interactive factor levels are well defined. The missing data can then be estimated from other available outcomes with similar factor-level interaction. The approach can also be used to estimate missing data as a result of subject that drops out from a particular or joint intervention(s) in medical research.