-
Paper Information
- Paper Submission
-
Journal Information
- About This Journal
- Editorial Board
- Current Issue
- Archive
- Author Guidelines
- Contact Us
International Journal of Statistics and Applications
p-ISSN: 2168-5193 e-ISSN: 2168-5215
2016; 6(6): 352-360
doi:10.5923/j.statistics.20160606.03

Modeling Time to First Malaria Using Spatially Correlated Conditional Autoregressive Frailty Model
 Abstract
 Reference
 Full-Text PDF
 Full-text HTML
Sisay Wondaya 1, 2, Yehenew Getachew Kifle 3, Akalu Banbeta Tereda 1, Dinberu Seyoum 1, 4
1Department of Statistics, Jimma University, Jimma, Ethiopia
2School of Finance and Statistics, East China Normal University, Shanghai, China
3Department of Statistics and Operations Research, University of Limpopo, South Africa
4Institute of Health and Society (IRSS), Université catholique de Louvain, Brussels, Belgium
Correspondence to: Sisay Wondaya , Department of Statistics, Jimma University, Jimma, Ethiopia.
| Email: |  |
Copyright © 2016 Scientific & Academic Publishing. All Rights Reserved.
This work is licensed under the Creative Commons Attribution International License (CC BY).
http://creativecommons.org/licenses/by/4.0/

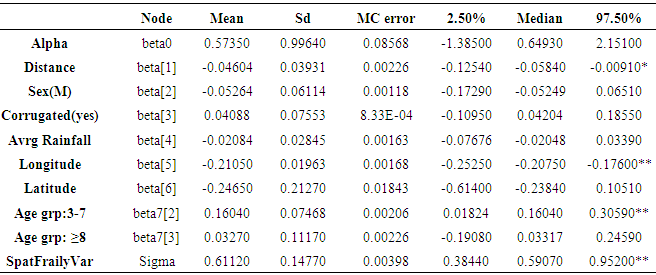
Introduction: The burden of malaria is a major public health concern in Ethiopia. Its dynamics is being changed by construction of dams which serve either for hydroelectric or irrigation purpose in the region. This study aimed at examining the impact of hydroelectric dam on malaria transmission in southwestern Ethiopia using Spatially Correlated Conditional Autoregressive Frailty (CAR) model. Method: A two-year weekly basis longitudinal study was conducted among children less than 10 years of age in sixteen villages, in southwest Ethiopia. CAR frailty model that accommodates the clustering effect were fitted to the malaria data set. The parameters in the model were estimated under a Bayesian framework using Markov Chain Monte Carlo (MCMC) approach. Results: Among 2040 children, 548 (26.9%) of them experienced malaria symptom in their blood samples during the study period. The minimum observed time for the first malaria infection was 4 days and the maximum was 698 days. The result reveals that the hazard of getting malaria infection is decreased by 5% for 1km distance away from the dam (HR=0.95, 95% CI: 0.88-0.99). Children aged > 3 years are more likely experienced malaria infection as compared to < 3 years of age. The result also showed that there is a marked clustering (Sigma=0.61 with 95% CI: 0.38 - 0.95) of villages in the study area. Hence the estimation of parameters with the assumption of neighborhood (Spatially Correlated CAR frailty model) was found to be parsimonious. Conclusions: Malaria control intervention program should consider the spatial variation of malaria transmission in order to get sustainable and efficient malaria control in the study area.
Keywords: Malaria, Clustering, MCMC, CAR Frailty, Southwest Ethiopia
Cite this paper: Sisay Wondaya , Yehenew Getachew Kifle , Akalu Banbeta Tereda , Dinberu Seyoum , Modeling Time to First Malaria Using Spatially Correlated Conditional Autoregressive Frailty Model, International Journal of Statistics and Applications, Vol. 6 No. 6, 2016, pp. 352-360. doi: 10.5923/j.statistics.20160606.03.
Article Outline
1. Introduction
- Malaria kills approximately 655,000 people per year; 91% of deaths occur in sub-Saharan Africa, mostly in children under five years of age (WHO, 2011). Global climate change and its interactive components, such as water availability, related vulnerability of natural and socio-economic systems and health, affect human wellbeing. If environmental conditions changed in a ways that would increase the survival time of mosquitoes, then they would be able to transmit other species of malaria that were not present in that area before (Research Journal of Environmental and Earth Sciences, 2010). Simple methods that enable accurate forecasting, early warning, and timely case detection in low and high transmission areas are needed to enable implementation of more effective control measures (WHO, 2003). Good maps of malaria risk have long been recognized as an important tool for malaria control. The production of such maps relies on modelling to predict the risk of malaria for most of the map, with actual observations of malaria prevalence usually only known at a limited number of specific locations (Tanner et al., 2001). Estimation is complicated by the fact that there is often local variation of risk that cannot be accounted for by the known co-varieties and because data points of measured malaria prevalence are not evenly or randomly spread across the area to be mapped (ibid). Now a day such a spatial data has become an important component of disease investigation (Pfeiffer, 1996). In fact the analysis becomes complex when the amount of information available is increased, but the availability of Geographic Information System (GIS) in combination with fast and relatively inexpensive computer hardware, leaves the scholars with the responsibility of making effective use of the information for the right decision. On the other hand ecological alterations favouring the spread of Mosquito insects facilitate the spread of the infection wherever malaria occurs. Man-made ecological transformations have occurred at an unprecedented magnitude over the past 50 years; prominent among them are water resource development projects (Lancy, 2012). The development, management and operation of water resources have a history of modifying the frequency and transmission dynamics of malaria, but analyses of how changes in the environmental risk factors and in the incidence and prevalence of malaria are related are sparse (WHO, 2005). In general, even though the potential health impacts of large dams are known warmly, only small number of systematic research were into these impacts and almost no quantitative information on the impact of dams specially on malaria case rates on communities at different distances from the dam, particularly in sub-Saharan Africa. Hence the need for more research into the connections between dams and its consequence for malaria transmission, whose results can be used to assist with health assessment when planning and constructing dam, has been highlighted (WHO, 2008; Jobin, 1999; Sleigh and Jackson, 2001). Distribution (spread) modelling that does not include spatial location explicitly, assumes that species’ locations are independent in space and time. Such an assumption could be violated if a) the conditions defining the niche were auto-correlated; or b) species’ locations were connected through dispersal or other behaviours that lead to spatial patterning such as aggregation or regular spacing (Volker et al., 2006). Some studies in Ethiopia (Delenasaw et al., 2009; Delenasaw et al., 2013; Solomon et al., 2009; Yehenew et al., 2011) tried to determine the connections between dams and its consequence for malaria transmission, but the spatial proximity of study areas (villages) was not considered in the analysis. Malaria is a vector born disease (mosquito’s possibly flay up to 3 km), hence incorporation of proximity of area is vital. In this study, spatially correlated conditional autoregressive frailty model were used to asses the relationship between different potential covariates (distance from the dam, age, house structure, rainfall, latitude/longitude) and time to first malaria infection for the survival data with random right censoring.
2. Methods
2.1. Study Setting
- At the early stage of the study, a baseline survey was conducted on the study area (around Gilgel Gibe hydropower dam in southwest Ethiopia) with the aim of collecting relevant information on individual and household characteristics. Information on demographic, environmental characteristics of the households, age, sex, number of children (who are less than 10 years of age) in each household, house proximity to the dam were collected. Children’s was followed from July 2008 to June 2010 at weekly intervals based on house-to-house visits. Since the interest in this study lies in assessing the effect of different covariates mainly of distance from dam shore, only time to first malaria infection was considered as primary outcome variable. Indeed, the percentage of children’s with second or more episodes of malaria in the follow-up time are relatively small. First malaria infection is malaria caused by any Plasmodium that happened at the time of diagnosis at the end of each week. The event indicator is defined as σij=I(Tij
2.2. Statistical Analysis
- Given the covariate information (independent variable) of subject j in villages (cluster) i denoted by Zij and baseline hazard h(tij, Zij), the hazard of experiencing malaria enables models of the following form.
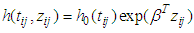 | (1) |
 is the baseline hazard,
  is a vector of covariates (assume fixed) and β is a vector of fixed effect parameters. In the model
  is the term that depends on the covariates but not time, and which describes the hazard on some level of covariates. In parametric survival models the baseline is not more constant. When important risk factors go unmodeled, heterogeneity in risk propensity is captured through random effects (frailty term). A frailty variance parameter distinguishable from zero indicates that the strata (villages) do not share a common variance and thus exhibit heterogeneity in risk propensity.
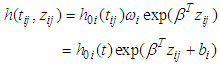 | (2) |
 is the stratum specific frailty term designed to capture differences among the strata. According to Li and Ryan (2002), a spatial frailty model has the following form.
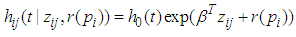 | (3) |
 is the fixed effect vector and
  is a mean-zero stationary Gaussian process with some basic properties. Common spatial modelling approach is to assign the spatial random effects as an intrinsic CAR prior, which usually incorporate information about the adjacency of regions rather than any type of continuous distance metric.Weight matrix settingLet
  denote the so-called spatial proximity matrix (weight matrix), in our case i = 1,. . . ,16 and j = 1,. . .,16 for the 16 villages, where ωii = 0 and ωij = 1 if the ith and the jth areas are neighbors (denoted i ) and 0 otherwise. The conditional expectation and variance of the village effect bi = b1, b2, . . . , b16 are:
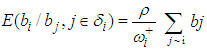
 Where δi is the set of neighbours of area i;
  is the number of neighborhood of village i.
  is the mean of the spatial random effects of these neighbours (sometimes set 0), the parameter
  is a conditional variance and its magnitude determines the amount of spatial variation. Notice that if
  is ”small” then although the residual is strongly dependent on the neighbouring value the overall contribution to the residual relative risk is small. Spatial weight matrix was set based on the Queen’s method. Unknown parameters in the models were estimated under a Bayesian framework using Markov Chain Monte Carlo (MCMC) methods via WinBUGS (http://www.mrc-bsu.cam.ac.uk/bugs/). In the estimation the likelihood of the semi parametric Cox model with spatial CAR frailty is proportional to;
 Where
Where  is the integrated baseline hazardWhile the likelihood for the Weibull model with spatial CAR frailties is proportional to:
 DIC (Spiegelhalter et al., 2002), which is based on the posterior distribution of the deviance statistic was used as model choice criteria. For implementation of parameter estimation in WinBUGS, Andersen and Gill (1982) extended the frailty model to the counting process framework and gave elegant martingale proofs for the asymptotic properties of the associated estimators in the models that try to fit models for survival data.
3. Result
3.1. Descriptive Statistics
- A total of 2040 children under age of 10 years was considered in this study, of which 951 (48.09%) children were females and 1059 (51.91%) were males. During the follow-up period, 548 (26.9%) of them experienced malaria at least one episode. The study area has a longitude between 37.187 - 37.383 degree and latitude between 7.667 - 7.883 degree. The median age of children in the cohort was five years. In this study children’s age at start of the survey was categorized in to three as ≤ 3 age, between 3 and 8 age, and ≥ 8 age. The total number of children’s per village at the start of the study was between 123 and 130. The nearest children’s household from the dam reservoir shore is 0.005 Km while the farthest is 9.046km. Figure 1 presents the survival probability of children’s in the 16 study villages. From the survival probability plot villages with higher survival (L14, L2, L3, L5, L1,) founds to North East of the dam, while the incidence in these villages are relatively low. Hence consideration of children’s residence in the analysis might be very important to control confounding. Log rank test was employed to check equality of survival probability of experiencing malaria among study villages; a significant difference survival probability was observed (p-value < 0.0001).
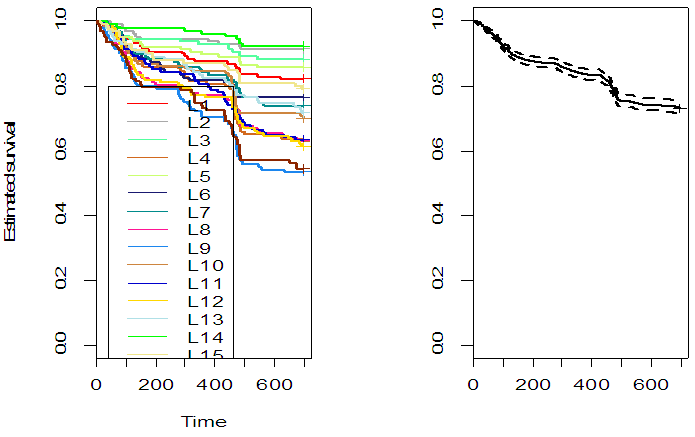 | Figure 1. Kaplan Meier Curve of the study villages |
3.2. Survival Regression Using Bayesian Method
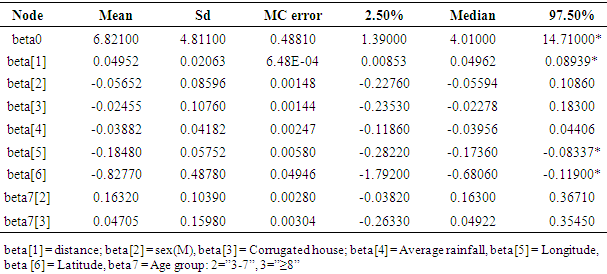
- We begin by summarizing our results for the cox regression model that doesn’t account any spatial variation (frailty term) across the villages, then a frailty survival model was followed. For the cox regression model a chain of 10,000 iterations with “burn-in” of 500 iterations starting from proper initial values were run and from the posterior summary we found some variables are important predictors for time to first malaria infection (Table 1). The result suggests that association of distance is positive and that of age group is negative with time to first malaria infection. Small difference in longitude and latitude of children’s residence house has significant effect on time to first malaria infection. In the summary (Table 1), Monte Carlo standard error (MC error) is fairly small almost for all coefficients indicating estimates are good. Initial values for β’s were the estimates from classical approach using R.
|
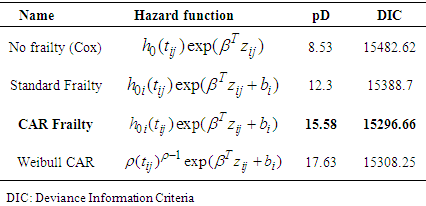
3.3. Comparison of Models
- The same groups of covariates were used for evaluation of the model fit and comparison. Deviance information criteria (DIC) value was used to evaluate the model performance for our data. For all of the models, we adopt a flat prior for β, and a G(α, 1/α) prior for which we make vague by setting α = 0.1.Initial values for locality effect bi were set 00s (independence). To set prior distributions for the overall variance parameter σ2, Gamma distribution with small shape and inverse scale parameters of 0.1 and 0.01 respectively were used (i.e, mean = 10 and variance =1000).
|
|
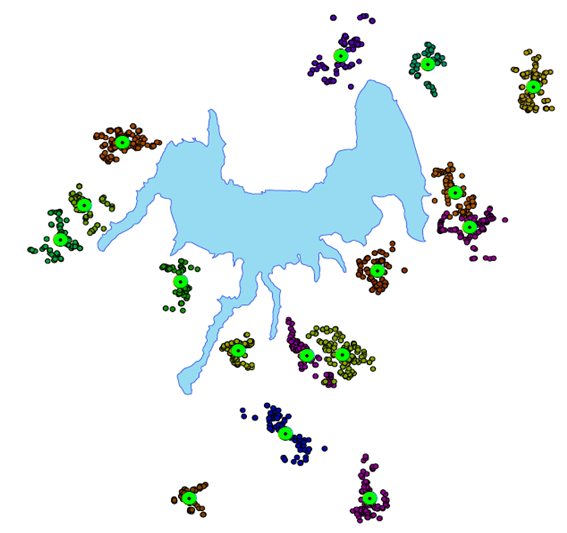 | Figure 2. Study village’s structure |
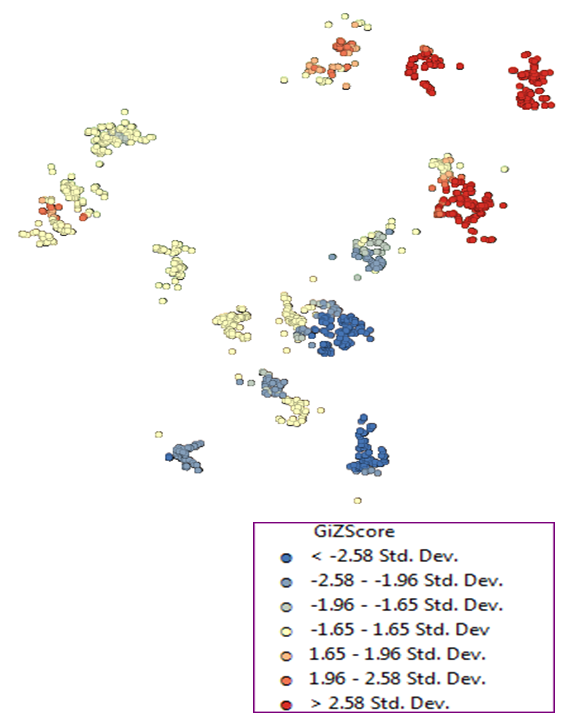 | Figure 3. Local Ord and Getis’ Gi* statistic mapping summary |
4. Discussion
- This study applied spatially correlated Conditional Autoregressive (CAR) Frailty model on two-year longitudinal cohort data in order to see the effect of some covariates on malaria transmission using a Bayesian framework with Markov Chain Monte Carlo (MCMC) estimation. We applied this advanced statistical model mainly to address the effect of dam on malaria transmission. Given that mosquitoes typically breed in stagnant water rather than flowing water, it was assumed that water reservoirs were more important contributors to malaria than flowing rivers. Finding of this study suggested that factors at household-level and individual level are important in understanding malaria transmission dynamics in the region. The time to first malaria infection in children living close to the dam shore is shorter than children living far away to the dam (HR decreases by factor 0.95). Based on Bayesian analysis result in this study, the malaria risk may be higher in children close to the dam; this is consistent with the results from several other studies (Lautze et al., 2007; Kibret et al., 2010). Other small dams constructed for irrigation in Ethiopia were also shown to be associated with higher malaria incidence (Ghebreyesus et al., 1999; Kibret et al., 2009). However, the result is not consistent with other studies conducted using same dataset (Delenasaw et al., 2009; Delenasaw et al., 2013; Solomon et al., 2009; Yehenew et al., 2011), and this is not surprising, since in this study we applied another prudent model CAR frailty to see the effect of covariates on time to first malaria. The fact that CAR frailty obeys the spatial version of the Markov property, that is, it assumes that state of a particular area is influence by its neighbors (and not neighbors of neighbours), and this assumption in malaria transmission is feasible since malaria is a vector born disease. Previous studies (Kibret et al., 2015) conducted in area near to the dam with unstable malaria transmission indicated that malaria prevalence in villages located < 3 km from the dams was 2.3 − 19.9 times higher than in villages located > 3 km from the dams. Recent studies also indicated that climate change will likely push the altitude limits of unstable malaria towards the highlands of East Africa (Kristan et al., 2008; Caminadea et al., 2014). The increase in household longitude leads a decrease in malaria hazard (HR=0.81; 95% CI: 0.78 - 0.84). Among other factors considered in the analysis; the malaria risk was higher among older children (HR=1.17 for age group 3-7; HR=1.03 for age group ≥ 8). This could be because the older children spend outdoors in the evening when mosquitoes bite become higher or the greater use of anti-malarial drugs in early childhood (Trape, 1987). A similar study in Gabon provided contradicted result that lower malaria prevalence in children less than six months (3.7%) than in children at the age of 47 months (47.5%) (Issifou et al., 2007). No difference was observed in malaria incidence between boys and girls. In epidemic-prone areas in which malaria risk can be highly focal, aiming control strategies at areas of highest risk can potentially increase the programme’s effectiveness (Carter et al., 2000). Therefore, future studies are warranted in the spatial identification of malaria at household level in the region to identify the finer-geographical hot spot of malaria. As this study reveals spatial clustering of malaria infection in villages of study area generally, it may help the targeted malaria control and treatment interventions to high risk villages which lead to the reduction of malaria infection in the study area.For this study we used secondary data collected with the overall aim of determining malaria incidence and patterns of its transmission among children’s living close to the dam. Hence, possible analysis like given the first symptom within a cluster of villages, what’s infection situation for the rest population or population before dam is constructed couldn’t done. If data on “reference population” will be collected, better analysis can be done.
5. Conclusions
- Based on a two-year longitudinal cohort data in this study, CAR frailty model found parsimonious among alternative models. This approach suggested that children living in close proximity to the reservoir created by the newly constructed Gilgel-Gibe dam are at a greater risk of malaria infection than children living further away. In order to maximize the economic benefits generated by Gilgel-Gibe hydroelectric dam, strategic malaria control programs could be implemented in more effective way. The paper provides a rationale for future Bayesian statistical modelling approaches for clustered data.
ACKNOWLEDGMENTS
- The authors would like to greatly thanks the Flemish Interuniversity Council (VLIR-UOS) project in Jimma university for providing the data. This work was financially supported by the College of Natural Sciences, Jimma University, Ethiopia.
Annex 1: Posterior Density for the Best Model
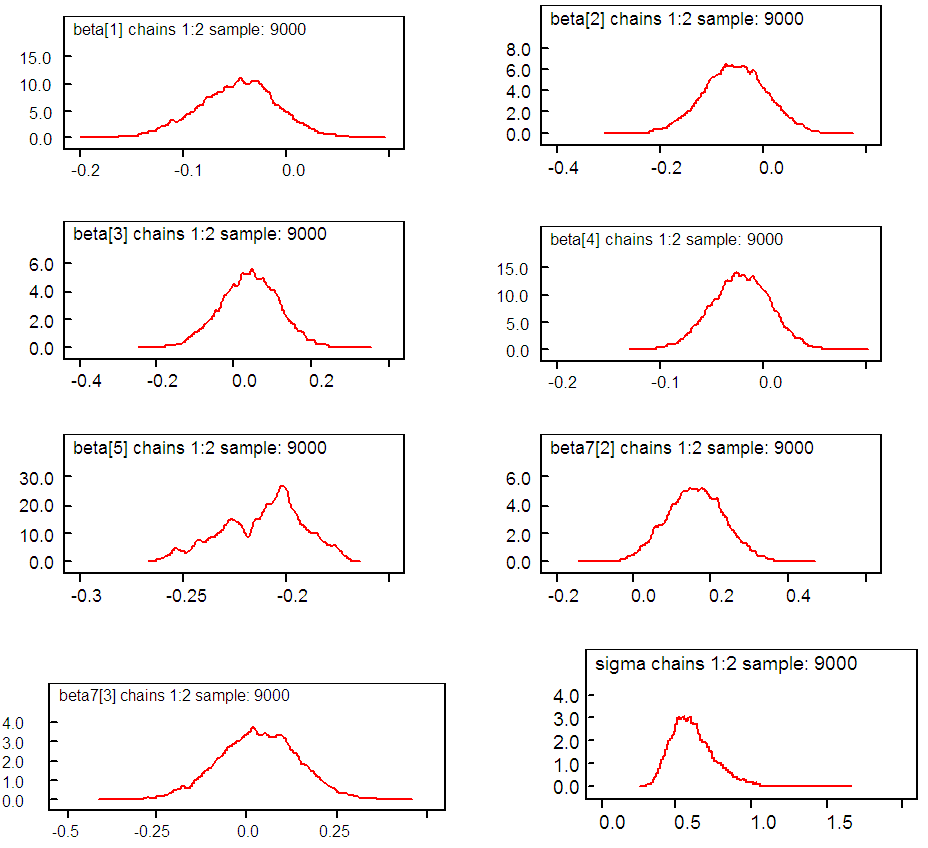 | Annex 1 |
Annex 2: History of Iteration
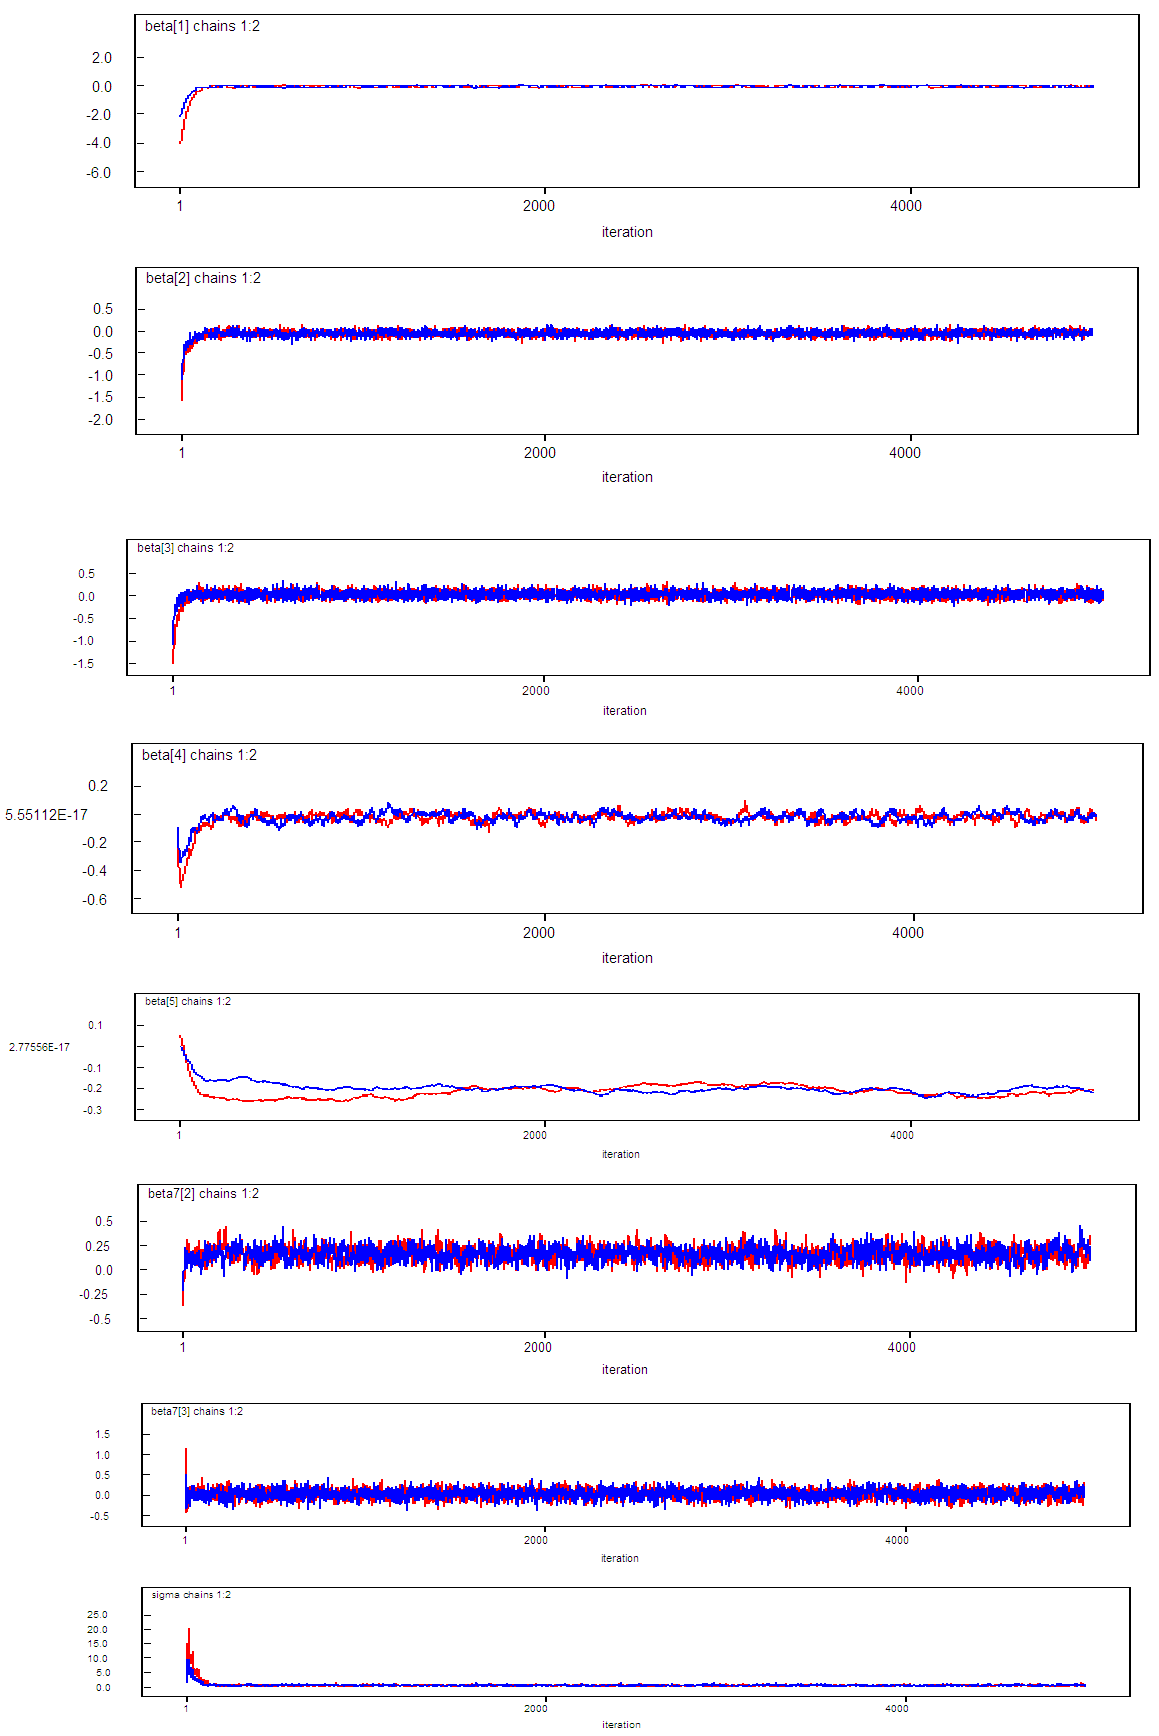 | Annex 2 |