-
Paper Information
- Paper Submission
-
Journal Information
- About This Journal
- Editorial Board
- Current Issue
- Archive
- Author Guidelines
- Contact Us
International Journal of Statistics and Applications
p-ISSN: 2168-5193 e-ISSN: 2168-5215
2016; 6(5): 276-292
doi:10.5923/j.statistics.20160605.02

On the Behaviour of Second-Order N-Point Equiradial Designs under Varying Model Parameters
 Abstract
 Reference
 Full-Text PDF
 Full-text HTML
M. P. Iwundu
Department of Mathematics and Statistics, Faculty of Science, University of Port Harcourt, Port Harcourt, Nigeria
Correspondence to: M. P. Iwundu, Department of Mathematics and Statistics, Faculty of Science, University of Port Harcourt, Port Harcourt, Nigeria.
| Email: |  |
Copyright © 2016 Scientific & Academic Publishing. All Rights Reserved.
This work is licensed under the Creative Commons Attribution International License (CC BY).
http://creativecommons.org/licenses/by/4.0/

The behaviour of alternative second-order N-point equiradial designs are studied under variations of model parameters for design radius ρ = 1.0. Useful numerical evaluations associated with the designs and the models are presented with respect to A-, D-, E-, G- and T-optimality criteria. Relationships among the optimality criteria are outlined with regards to the designs and the models. Furthermore, D- efficiencies of the equiradial designs are evaluated. The N-point equiradial designs perform correspondingly better for reduced bivariate quadratic model than for the full bivariate quadratic model under A- and D- optimality criteria. The reverse holds for the full bivariate quadratic model under T-optimality criterion as the N-point equiradial designs perform correspondingly better for the full bivariate quadratic model than for the reduced bivariate quadratic model. There is no indication of design preference for the models under E- and G-optimality criteria. On the whole, designs optimal for one model need not be optimal for another model.
Keywords: Equiradial designs, Full bivariate quadratic model, Reduced bivariate quadratic model, Optimality criteria, D-efficiency
Cite this paper: M. P. Iwundu, On the Behaviour of Second-Order N-Point Equiradial Designs under Varying Model Parameters, International Journal of Statistics and Applications, Vol. 6 No. 5, 2016, pp. 276-292. doi: 10.5923/j.statistics.20160605.02.
Article Outline
1. Introduction
- First and Second-order Response Surface Methodology designs play vital roles in modelling response functions. Most classical designs such as factorial designs assume the regression model, which is used as an approximation to the true unknown response function, is a full polynomial model. However, models with improper polynomial regression functions also exist. By the flexibility of optimal design theory, it is possible to obtain properties of designs for polynomial regression functions having complete terms present or some terms missing. Iwundu & Albert-Udochukwuka (2014) studied the behaviour of D-optimal exact designs for first-order polynomial models under changing regression polynomials. The polynomials used were with or without intercept terms or with or without interactive terms. The importance of first order designs and models cannot be over-emphasized as the applications are numerous in industrial processes, particularly in screening experiments. On the other hand, second-order response surface methodology designs are particularly very essential in modelling second-order response functions in the presence of curvature. They include the
 factorial designs, the central composite designs, the Box-Behnken designs and even D-optimal designs and have been extensively studied. However, some equiradial designs exist and can serve reasonably well in modelling second-order effects. Myer et al. (2009) defines equiradial designs as some special and interesting two-factor designs for modelling second-order response functions and whose design points appear on a common sphere. The class of equiradial designs require not many experimental runs and begins with a pentagon of equally spaced points on the sphere. The design matrix is expressed as
 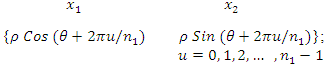 where
where  and
and  represent the two controllable variables, ρ is the radius of the design and
  represents the number of points on the sphere.
  center points are usually added to the
  radial points of the design. Myer et al. (2009) observed that the value of
  could be assumed equal to zero since the information matrix
  , of the design is not affected by
  . Some considerations for second-order response surface models and designs include Onukogu and Iwundu (2007), who considered the construction of efficient and optimal experimental designs for second-order response surface models. Concerns regarding optimality of designs have been investigated for second-order models (see for example Dette and Grigoriev (2014)). On optimal choices of design points for second-order response surface designs and performances of several types of second-order response surface designs, see Lucas (1976), Chigbu and Nduka (2006), Chigbu et al. (2009), Ukaegbu and Chigbu (2015), Oyejola and Nwanya (2015) and Iwundu (2015). Graphical techniques have been used in studying the variance properties of second-order response surface designs as seen in Myer et al. (1992), Giovannitti-Jensen and Myers (1989), Zahran et al. (2003). In a recent study by Iwundu (2016a), the equiradial designs were seen comparable with the standard central composite designs. Particularly, the D-efficiency values reveal that the N-point spherical equiradial designs are better than the inscribed central composite design though inferior to the circumscribed central composite design with efficiency values being less than 50% in all cases studied. We consider in this work the behaviour of the equiradial designs under variations of model parameters for design radius ρ = 1.0. We also investigate the assertion that designs optimal for one model need not be optimal for another model.
2. Methodology
- It is a common practice to assume some high order interaction terms of a model to be negligible. This practice is seen, for instance, in the area of factorial experiments where the highest order interaction is assumed negligible. It is even possible to assume a no-intercept (or zero-intercept) model as seen in origin regression. In studying the behaviour of alternative second-order N-point equiradial designs under variations of model parameters, a case where the second-order full model is assumed as well as a case where the highest order interaction is assumed negligible and is thus removed from the model shall be considered. The second-order full model (main effects, interaction effects and quadratic effects model) to be employed in this study is
 | (1) |
 | (2) |
 is maximized over all designs, where
  represents the design matrix associated with the design and
  represents its transpose. The criterion of D-optimality is equivalent to minimizing the determinant of
  . A-optimality criterion is one in which the sum of the variances of the model coefficients is minimized. The criterion of A-optimality thus minimizes the trace of
  and is defined as
  where Min implies that minimization is over all designs and tr represents trace. E-optimality criterion maximizes the minimum eigen value of M or equivalently minimizes the maximum eigen value of
  . The E-optimality criterion is defined by
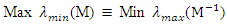 where
where  and
and  represent minimum eigen value and maximum eigen value, respectively. G-optimality criterion considers designs whose maximum scaled prediction variance,
  , in the region of the design is not too large. Hence, a G-optimal design minimizes the maximum scaled prediction variance and is defined by
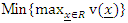 The assertion that designs optimal for one model need not be optimal for another model shall be investigated using equiradial designs for the full and reduced bivariate models in equations 1 and 2. Furthermore, the efficiency of designs shall be considered. In comparing two designs, the relative efficiency is seen as the ratio of their separate efficiencies. We shall employ the D-efficiency criterion as the test criterion. This criterion has been extensively used as a single numerical measure of the efficiency of designs. By definition, the D-efficiency of a design
  is given as
 | (3) |
 relative to the design
  is given as
 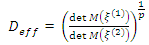 | (4) |
 is the information matrix of the design and
  is the number of model parameters. For an N-point equiradial design,
  , the information matrix of the design
  is
is  and normalized as
  to remove the effect of changing design sizes. The
  matrix,
  , is the design matrix whose columns are built from the model and the design
  and
and  represents transpose. In comparing designs, the best design is one with the largest D-efficiency value. In terms of relative efficiency, the ratio in equation 4 exceeds unity if the design
  is better than the design
  and lies between zero and one, otherwise.
3. Illustrative Examples
- Since the equiradial designs are defined for two controllable variables, the bivariate models to be considered are
 and
and  The N-point equiradial designs
  and
and  shall be employed. They are defined as
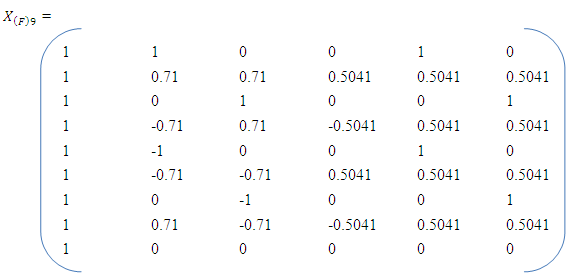
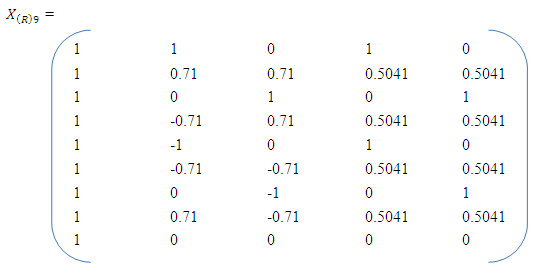
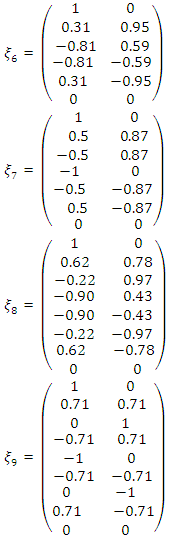 The associated design matrices using the designs and the full bivariate quadratic model are
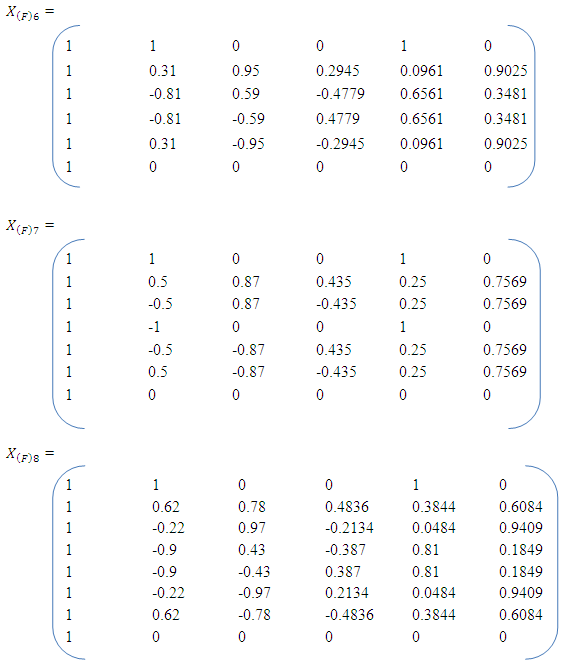
 Similarly, the associated design matrices using the designs and the reduced model are
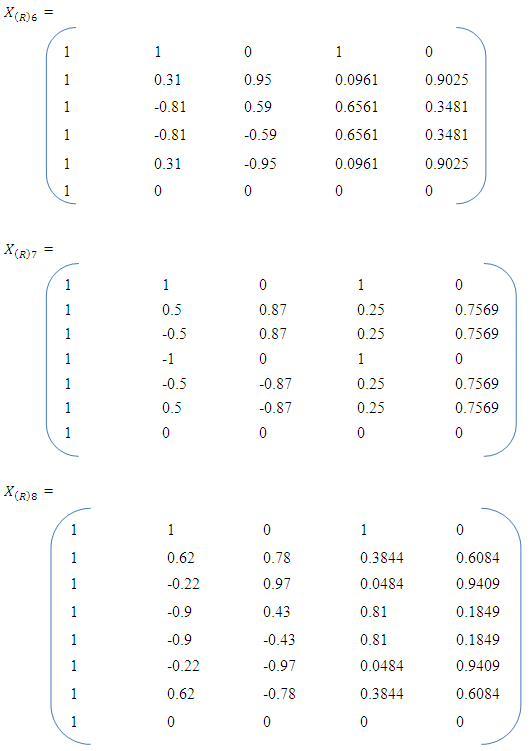
 For the full bivariate quadratic model, the normalized information matrices corresponding to the N-point equiradial designs are as follows;
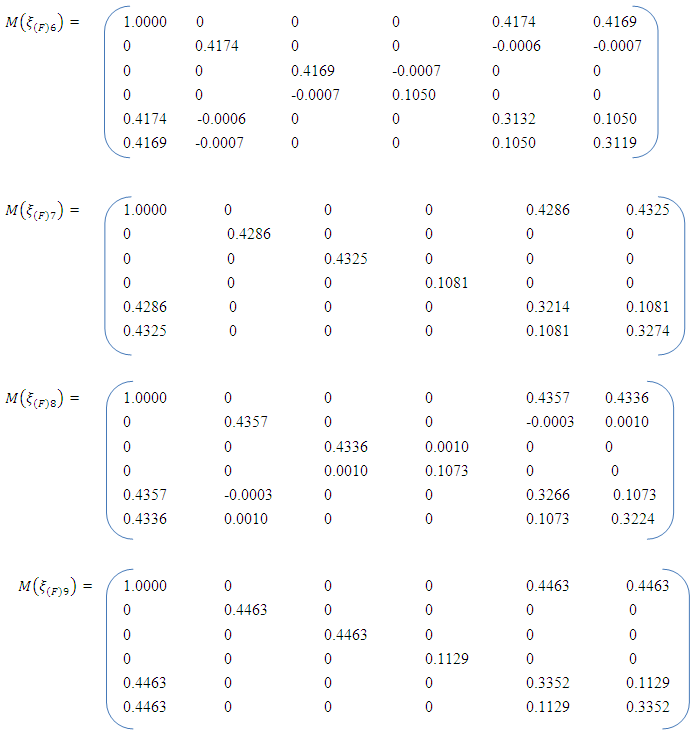 For the reduced bivariate quadratic model, the normalized information matrices corresponding to the equiradial designs are as follows;
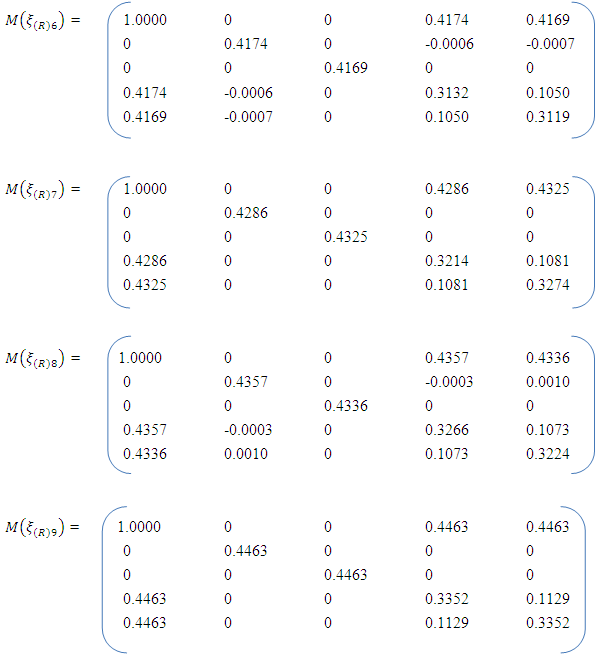 The numerical evaluations associated with the designs and the models with respect to A-, D-, E-, G- and T-optimality criteria as in Appendices A and B. The evaluations include the determinant value of the information matrix and its inverse, the trace of the information matrix and its inverse, the eigenvalues of the information matrix and its inverse as well as the scaled prediction variances.
 4. Results and Discussion
- A concise summary of numerical evaluations associated with the equiradial designs and the models is presented in Table 1. D-efficiency values of the equiradial designs for the full and reduced bivariate quadratic models as well as the relative D-efficiency values are presented in Table 2. It is clear as contained in literature that relationships exist among the various optimality criteria. One of such is that a design that maximizes the determinant value of information matrix equivalently minimizes the determinant value of the inverse of the information matrix. As observed in this research, while seeking to minimize the trace of the inverse of the information matrix, the N-point equiradial designs performed correspondingly better for the reduced model than for the full model. By implication, the average variance of the estimates of the regression coefficients associated with the reduced model is better minimized using the equiradial designs than that observed for estimates of the regression coefficients associated with the full model.It is also observed that when interest is in maximizing the determinant of the information matrix of the design or equivalently minimizing the determinant of the variance-covariance matrix, the N-point equiradial designs performed correspondingly better for the reduced model than for the full model. By implication, the equiradial designs minimize the generalized variance of the parameter estimates for the reduced model than for the corresponding full model. However, a different opinion holds for the full model under T-optimality criterion as the N-point equiradial designs performed correspondingly better for the full model than for the reduced model. There was no observed design preference for the models under E- and G-optimality criterion. For the full model, the 6-point equiradial design was best under A-, E- and G-optimality criteria. The 7-point equiradial design was best under D-optimality criterion and the 9-point equiradial design was best under T-optimality criterion. For the reduced model, the 6-point equiradial design was outstandingly best under A-, D-, E- and G-optimality criteria and the 9-point equiradial design was best under T-optimality criterion. Also for the reduced model, the 7-point equiradial design had maximum determinant value of information matrix too. Hence both 6-point and 7-point equiradial designs have uniform determinant value of information matrices and consequently have equal preference in terms of D-optimality criterion. The D-efficiency values of the equiradial designs confirm the preferences of the equiradial designs for the reduced model. It is worthy of note that each of the N-point exact designs had very low efficiency value for the full as well as for the reduced model. This is possibly because the small sized equiradial designs may be far from being orthogonal. Although relative D-efficiency values have been computed for the designs under study, it would be more informative to obtain the efficiency of each design relative to the global D-optimal design for the full as well as for the reduced model. Global D-optimal design as used here refers to the D-optimal design whose maximum scaled prediction variance approximately equals the number of model parameters. Investigations carried out in this work confirm that optimal designs are model dependent.
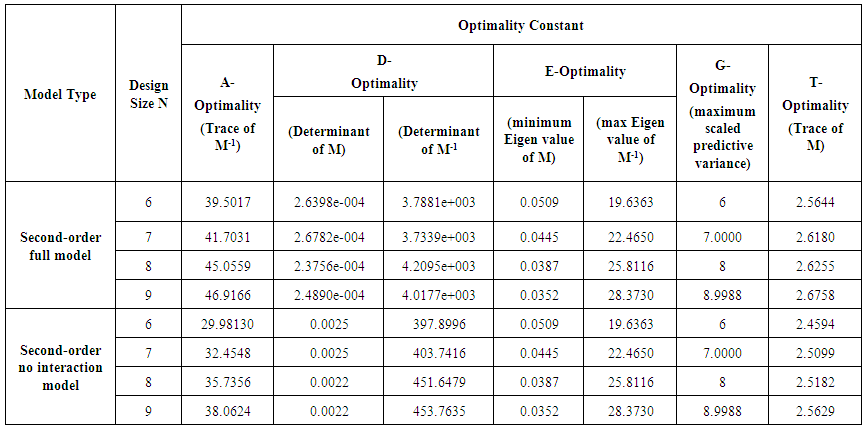 | Table 1. Optimality Constants for the Equiradial Designs |
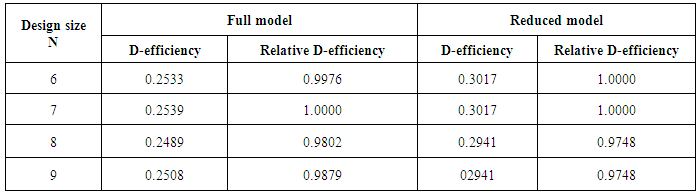 | Table 2. D-Efficiency Values and Relative D-Efficiency Values of the Equiradial Designs |
Appendix A: Computations for the Full Model
Appendix B: Computations for the Reduced Model
