-
Paper Information
- Paper Submission
-
Journal Information
- About This Journal
- Editorial Board
- Current Issue
- Archive
- Author Guidelines
- Contact Us
International Journal of Statistics and Applications
p-ISSN: 2168-5193 e-ISSN: 2168-5215
2016; 6(5): 267-275
doi:10.5923/j.statistics.20160605.01

Estimation of Proximate Variables to Achieve Required Level of Fertility in Bangladesh: Modeling Approach
 Abstract
 Reference
 Full-Text PDF
 Full-text HTML
Md. Rezaul Karim1, Md. Nurul Islam2, Md. Golam Hossain2, Md. Rafiqul Islam3, Md. Ashraful Islam4
1Research of Health Research Group, Department of Statistics, University of Rajshahi, Rajshahi, Bangladesh
2Professor, Department of Statistics, University of Rajshahi, Rajshahi, Bangladesh
3Professor, Department of Population Science and Human Resource Development, University of Rajshahi, Rajshahi, Bangladesh
4Visiting Research Fellow, Research Management Center (RMC), University of Malaya, Kuala Lumpur, Malaysia
Correspondence to: Md. Rafiqul Islam, Professor, Department of Population Science and Human Resource Development, University of Rajshahi, Rajshahi, Bangladesh.
| Email: |  |
Copyright © 2016 Scientific & Academic Publishing. All Rights Reserved.
This work is licensed under the Creative Commons Attribution International License (CC BY).
http://creativecommons.org/licenses/by/4.0/

Proximate determinants influence level of fertility in a society. The aim of this study were to estimate the total fertility rate (TFR) for a given level of contraceptive prevalence rate (CPR) and estimate the CPR, some indices and factors for achieving the target TFR. For this, data were extracted from Bangladesh contraceptive prevalence survey, Bangladesh fertility survey and Bangladesh demographic and health survey. Linear regression analysis and revised Bongaarts’ models were used to estimate proximate determinants for achieving target TFR. The regression coefficient demonstrated that TFR has been decreasing while CPR increasing during the investigated period with highly negatively associated between TFR and CPR (p<0.01). The results indicate that to achieve replacement level of fertility at 2.1 births per woman it should be increased the CPR, singulate mean age at marriage, duration of breastfeeding and amenorrhea period at 68%, 20.80 years, 37 months and 2.37 months respectively.
Keywords: Target fertility, Fetal wastage, Amenorrhea period, Breastfeeding, Bongaarts’ model
Cite this paper: Md. Rezaul Karim, Md. Nurul Islam, Md. Golam Hossain, Md. Rafiqul Islam, Md. Ashraful Islam, Estimation of Proximate Variables to Achieve Required Level of Fertility in Bangladesh: Modeling Approach, International Journal of Statistics and Applications, Vol. 6 No. 5, 2016, pp. 267-275. doi: 10.5923/j.statistics.20160605.01.
Article Outline
1. Introduction
- The study of determinants of human fertility is a very complex process. Human fertility influence population growth, which has consequences towards pressure on resource, employment situations, health and other social facilities and savings and investment, such consequences, in turn, great bearing on the demographic and socio-economic variables that affect fertility behavior. The level of fertility in a society is directly influenced by a set of variables called intermediate variable or proximate determinants [1]. In general, the biological and behavioral factors through which demographic, socio-economic, culture and environmental variables affect fertility called an intermediate fertility variable. The primary characteristics of an intermediate fertility variable are its direct influence on fertility. Bongaarts’ [2] revised the original classification and provide a simple analytical method accounting framework, which permits a quantitative assessment of the contribution of different proximate determinants to give fertility levels or change. Bongaarts’ [3] demonstrated that most of the variation in fertility is due to four intermediate variables or proximate determinants. These are proportion married, contraception, abortion and lactational infecundability. If a proximate determinant such as contraceptive use changes, then fertility necessarily changes also (assuming the other proximate determinants remain constant), though this is not necessarily the case of socio-economic determinants. As a result, fertility differences among populations and changes in fertility of a population over time can always be traced to variations in one or more of the proximate determinants.Historical studies about fertility change have shown that, as societies being to undergo the transformation from natural to deliberately controlled fertility, significant changes in the overall levels of total natural fertility, total marital fertility and total fertility being occur [4]. Such changes can be traced to one or more proximate determinants, such as, an increase in contraceptive use for stopping and spacing purposes a rise in age at first marriage, a decline in the proportion married, prolonged breastfeeding and fetal wastage [5]. To improve our understanding of the fertility change, we critically examine the effect of major proximate determinants: proportion married contraception, fetal wastage and lactational infecundability on fertility and their changing effects. Again, since fertility is the resultant of multiplicity of factors, studies have attempted to identify these factors, which have important bearing for policy intervention in altering the level of fertility [6, 7, 8]. Many developing countries like Bangladesh emphasize the importance of reducing fertility as part of her overall strategy to bring down the growth rate of population. Family planning programs at work in the country in order to achieve demographic goals through the reduction of fertility. The demographic goals of accepters of different family planning methods are to be recruited in each case. There is always been a gap between the target fertility and its achievement at the terminal year of the target period in all its plan periods. The country has never gained either the desired level of fertility or the contraceptive prevalence rate (CPR) at achieving the target fertility [9]. For example, during the plan period 1980-85 the target fertility has been 4.1 children per woman (total fertility rate: TFR) and the desired level of CPR has been 38%, the achievement have been a (TFR) of 5.55 and CPR of 25%. Similarly, TFR and CPR are also found during the plan period of 1985-90 [10]. Such gaps have raised questions about the estimation equation used to project CPR in order to achieve TFR at a desired level at the end of a plan period. It was found that all the proximate indices were showing downward trend caused by increasing the effectiveness use of contraception and in between 1997 and 2007, the amount of decrease in the total fertility rate is about 17% and about 10% from 2004 to 2007 [11].The aims of this paper are to (i) estimate the TFR for a given level of CPR, (ii) estimate the CPR for achieving the target fertility level (TFR) taking into account the trends in a few proximate determinants of fertility, (iii) estimate the indices of proportion married (Cm), non-contraception (Cc), lactational infecundability (Ci), and fetal wastage (Cfw), for achieving the target fertility and (iv) estimate the mean age at marriage, amenorrhea period, and duration of breastfeeding for desired level of fertility.
2. Data and Methods
- The study uses data available from surveys as Bangladesh Contraceptive Prevalence Surveys of 1979, 1981, 1983, 1985 [12, 13, 14, 15] and Bangladesh Fertility Surveys of 1975, 1989 [16, 17] also Bangladesh Demographic and Health Surveys of 1994, 1997, 2000, 2004 and 2007 [18, 19, 20, 21, 22]. These surveys cover the nationwide representative sample and the data provided by these surveys are taken to be of good quality.
2.1. Target Setting Model of CPR to Achieve Required TFR
- Estimate of TFR for given level of CPR is made by fitting a simple regression model of the form TFR = α + β CPR + ε, where, α and β are two parameters and ε is the error term of the model. Estimate of α and β are made by the method of Least Squares using longitudinal data of TFR and CPR from 1979 to 2007. The practice of fitting regression equation to the data of TFR and CPR of which TFR is a dependent variable is not a new one. Bongaarts` [23] examine the strength of relationship between TFR and CPR by fitting a regression line of TFR on CPR. Again, projection of CPR for the attainment of a specified level of fertility is made by means of Bongaarts` proposed [24] target setting model. The model is derived as Bongaarts` original multiplicative model relating TFR with a few proximate determinants of fertility, the model is therefore;
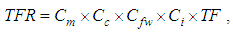 where Cm, Cc, Cfw and Ci are the indices of proportion married, non-contraception, fetal wastage and lactational infecundability respectively and TF, the total fecundity rate. Each of the four indices various from 0 to 1, the model can be applied for target setting for the target year t with respect to the base year 0. That is,
 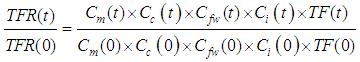 The above equation indicates that the reduction in fertility from TFR (0) to the target level depends on the trend in all of the indices of proximate variables. The base year may be the present or some recent year. Under the assumptions of no change in total fecundity, absence or negligible effect of fetal wastage and trends in the indices of
  and
and  compensate each other the equation reduces to the form,
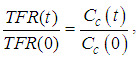
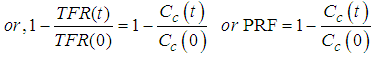 Where PRF is the proportionate reduction in fertility, i.e,
 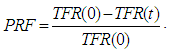 . Now, since
 where u = contraceptive prevalence rate,
  effectiveness of contraception, then
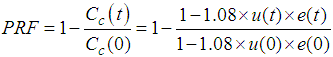
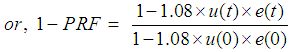 or,
or, 
 Since
Since  is the CPR among married woman at the beginning of target year t, in which we are interested, we have,
 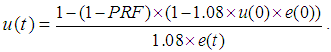 On the assumption of equal effectiveness of contraception between the base and target years, we have,
 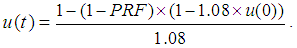 Thus, the data required for the estimation of u(t), the CPR at the target year t and u(0), the CPR at the base year and PRF. Fitting the regression line and incorporating the target-setting model for the population of Bangladesh we estimate the CPR to achieve required target fertility.
 2.2. Models of Target Cm, Ci and Cfw Indices
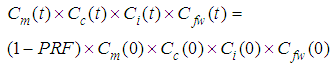
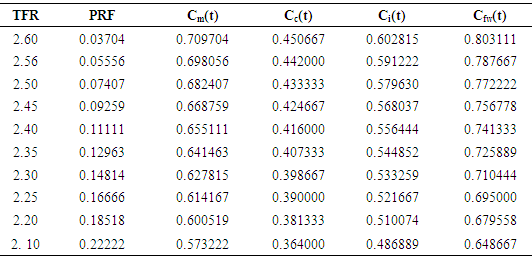
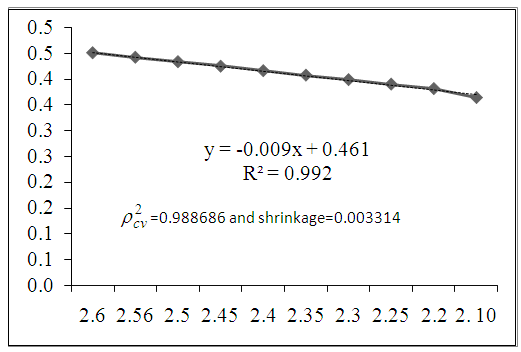
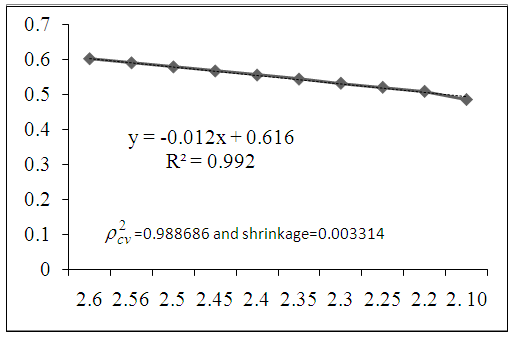
- Our proposed model can also be used to estimate the projection of indices of proportion married (Cm), lactational infecundability (Ci) and (Cfw) fetal wastage by using proportional reduction in fertility (PRF). From the proposed model it can be written as:
 | (1) |
 then the equation becomes,
  | (2) |
 | (3) |
 | (4) |
 | (5) |
 | (6) |
 | (7) |
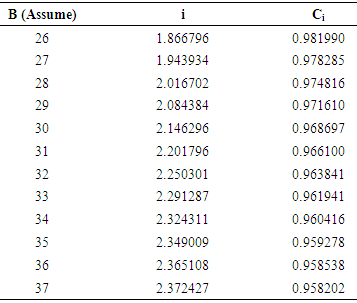
2.3. Estimated Duration of Breastfeeding (B) for Target Fertility with Given Value of Amenorrhea
- From the equation of relationship between the duration of breastfeeding and amenorrhea period, we can estimate the breastfeeding duration. The average duration of amenorrhea period is given by
 | (8) |
 | (9) |
 | (10) |
 | (11) |
 Using this solution we estimate the duration of breastfeeding and amenorrhea period.
 2.4. Model Validation Technique
- To determine the validity of the fitted models over the population, the CVPP,
 is applied. The mathematical formula for CVPP is
 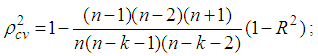 where, n is the number of classes, k is the number of explanatory variables of the model and the cross-validated R is the correlation between observed and predicted values of the dependent variables [25]. The shrinkage coefficient of the model is the positive value of
  where
where  is CVPP and R2 is the coefficient of determination of the model. The estimated CVPP akin to their R2 and shrinkage coefficients are shown in the respective figures and places which show that the fitted models are better fit due to shrinkage coefficients. It is noted that this technique is also used as validation technique of model in several studies [26-44].
 3. Results and Discussions
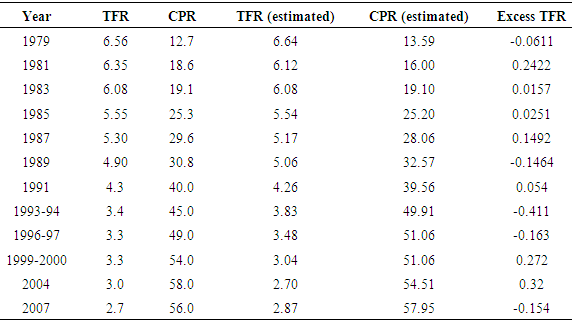
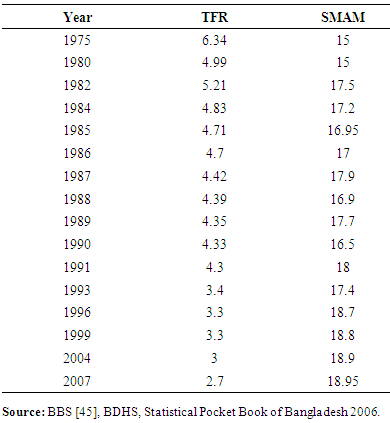
- The CPR and TFR from 1979 to 2007 are given in Table 1, yielded a regression line of
 (R2=0.96,
  and shrinkage=0.012963) or
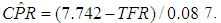
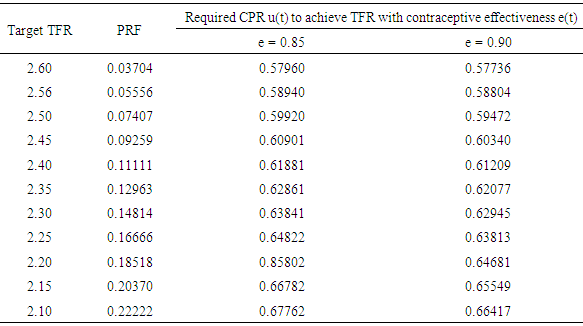
 In this case, shrinkage=0.012963 indicates the best fit of this regression model.The degrees of correlation seems to be high (r = -0.98) and significant (at 10% level of significance). Thus the temporal variation in fertility explain by CPR may be attributed to the 96%, remaining 4% of the total variation unexplained by CPR which may attributed to the effect of other socio-economic and demographic variables. Deviations from the regression line (execs fertility) are due partly to measurement errors and partly to variations in the other proximate determinants of which marriage is an important one. According to the regression, the TFR equals, on average 7.742 births per woman in the absence of contraception (CPR=0), and fertility declines at a rate of approximately 1.0 birth per woman for each 9% increment in the contraceptive prevalence rate. Under such relationship between TFR and CPR, we can assess the required contraceptive prevalence level to achieve replacement level fertility. The regression equation of TFR on CPR suggests that a TFR of 2.4 births per woman can be achieved if the level of CPR is raised to 61% and if the level of CPR is raised to 65% it is possible to achieve a target level of 2.1 births per woman (Table 1).
|
3.1. Singulate Mean Age at Marriage and Total Fertility Rate
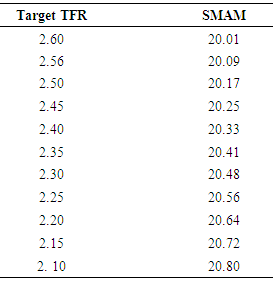
- The values of SMAM and TFR was calculated by regression equationTFR = 15.37- 0.638 SMAM (R2=0.682,
 and shrinkage=0.07186) or SMAM = (15.37 - TFR) / 0.638. In this case, shrinkage=0.07186 indicates the better fit of the model.According to this regression equation, the total fertility rate on the average is equal to 15.37 births per woman in the non-increasing of age at marriage and fertility declines at a rate of 6.3 birth per woman for each 10% increment in singulate mean age at marriage. It also indicates that singulate mean age at marriage explains about 68.20% (R2 = 68.20%) of the variation in the total fertility rate. Deviations from the regression line are partly due to measurement errors and partly to variations in other determinants. This is a statistical relationship, but in most developing countries like Bangladesh, the increase in contraceptive use also might be a factor for declining fertility. From the relation we can determine the SMAM of females for desired level of fertility (Table 3).
|
|
|
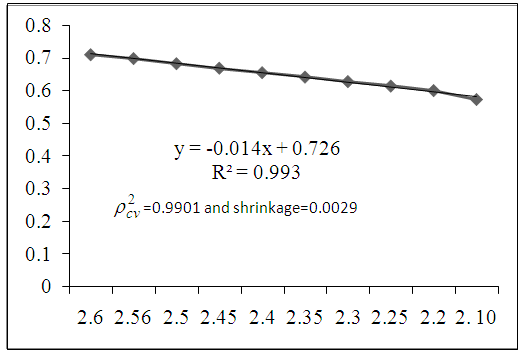 | Figure 1. The regression line of the index of proportion married with given level of target fertility |
 | Figure 2. The regression line of the index of non-contraception with given level of target fertility |
 | Figure 3. The regression line of the index of lactational infecundability with given level of target fertility |
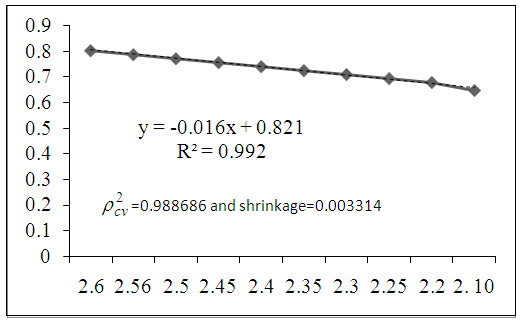 | Figure 4. The regression line of the index of fetal wastage with given level of target fertility |
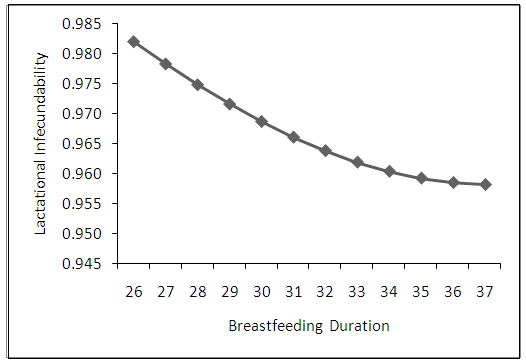 | Figure 5. The graph of the index of estimated lactational infecundability with given level of breastfeeding |
|
4. Conclusions
- The estimates of CPR to achieve certain level of fertility at a stipulated time using two models, viz., linear regression and Bongaarts’ (Proposed model) target setting models are found to be inconsistent for obvious reasons. Apart from methodological differences the estimate of CPR using linear regression model is based completely on the face values of TFR and CPR and takes into account of the trends of both the factors while the estimate made by Bongaarts’ target setting model heavily depends only on the level of contraceptive use of the most recent year and ignores the effect of the two important proximate variables of marriage pattern and lactational infecundability. There seems to be a change in marriage pattern in the country and also exists a norm of long duration of breastfeeding practice - the effects of which can not be ignored to achieve target fertility. A high degree of correlation between TFR and CPR bears the implication that it is possible to achieve a replacement level of fertility if the present pace of progress in contraceptive practice is maintained. To achieve the replacement level of fertility we have to attain a contraceptive level of around 68% with effectiveness 0.85 and 66% with effectiveness 0.90 and increase of nearly 12% and 10% respectively relative to the base year which is perhaps a far reaching target. To reach the desire level of target fertility it would be increased the use of contraceptives, duration of breastfeeding, singulate mean age at marriage and amenorrhea period. To achieve replacement level of fertility at 2.1 births per woman we should increase the CPR, SMAM, duration of breastfeeding and amenorrhea period by 68%, 20.80 years, 37 months and 2.37 months respectively.
ACKNOWLEDGEMENTS
- The authors would like to thank Bangladesh Demographic and Health Survey (BDHS), Bangladesh Bureau of Statistics (BBS), Bangladesh Contraceptive Prevalence Surveys (BCPS) and Bangladesh Fertility Surveys (BFS) for providing their nationally representative data.
References
| [1] | Davis, K., and Blake, J. (1956). Social Structure and Fertility: An Analytic Framework, Economic Development and cultural Change, Vol. 4(3):211-235. |
| [2] | Bongaarts, J. (1978). A Framework for the Analysis of the Proximate Determinants of Fertility, Population and Development Review, Vol. 2(1): 105-131. |
| [3] | Bongaarts, J. (1982). The fertility-inhibiting effects of the intermediate fertility variables, Studies in Family Planning, Vol. 13(6-7):179-189. |
| [4] | Bongaarts, J. and Potter, G.R. (1983). Fertility, Biology and Behavior: An Analysis of the Proximate determinants, Academic press, New York. |
| [5] | Karim, R. (2012). Factors Associated with Target Fertility in Bangladesh: Unpublished Ph.D dissertation, Department of Statistics, University of Rajshahi, Bangladesh. |
| [6] | Heer, David M. (1966). Negro-white marriage in the United States, Journal of Marriage and the Family, Vol. 28:262-273. |
| [7] | Cain, G.G., and Weininger, A. (1973). Economic determinants of fertility: results from cross-sectional aggregate data, Demography, Vol. 10(2):205-223. |
| [8] | Kohli, K.L. and Al. Omaim, M. (1985). Some indirect estimates of fertility from 1980 census data in Kuwait, Popul Bull U N Econ Comm West Asia, Vol. 26:39-62. |
| [9] | Abedin, S. and Islam, M.N. (1994). Implication of Contraceptive practice of future trends in fertility in Bangladesh, Jonural of Family Welfare, Vol. 40(3):37-41. |
| [10] | Islam, N. and Abedin, S. (1996). Some observation on Marriage, Contraception and Fertility in Bangladesh, GENUS, Vol. 52(1-2):201-207. |
| [11] | Islam, M. N., Hossain, M. G., Karim, M. R., Islam, M. R., Lestrel, P. E. and Islam, M. A. (2014). Fertility analysis of Bangladesh population using the revised Bongaart’s model, Advances in Life Sciences, Vol. 4(2): 44-51. |
| [12] | CPS. (1979). Bangladesh Contraceptive and Prevalence survey, 1979. Population Control and Family Planning Division, Dacca, Bangladesh. |
| [13] | CPS. (1981). Bangladesh Contraceptive and Prevalence survey, 1979. Population Control and Family Planning Division, Dacca, Bangladesh. |
| [14] | CPS. (1983). Bangladesh Contraceptive and Prevalence survey, 1979. Population Control and Family Planning Division, Dacca, Bangladesh. |
| [15] | CPS. (1985). Bangladesh Contraceptive and Prevalence survey, 1979. Population Control and Family Planning Division, Dacca, Bangladesh. |
| [16] | BFS. (1975). Bangladesh Fertility Survey 1978. Country Report, No.1; Dhaka. Ministry of Population Control and Family Planning. |
| [17] | BFS. (1989). Bangladesh Fertility Survey 1992. National Institute of Population Research and Training (NIPORT), Dhaka, Bangladesh. |
| [18] | BDHS. (1994). Bangladesh Demographic and Health Survey 1993-1994. National Institute of Population Research and Training (NIPORT), Dhaka, Bangladesh. |
| [19] | BDHS. (1997). Bangladesh Demographic and Health Survey 1996-1997. National Institute of Population Research and Training (NIPORT), Dhaka, Bangladesh. |
| [20] | BDHS. (2000). Bangladesh Demographic and Health Survey 1999-2000. National Institute of Population Research and Training (NIPORT), Dhaka, Bangladesh. |
| [21] | BDHS. (2004). Bangladesh Demographic and Health Survey 2004. National Institute of Population Research and Training (NIPORT), Dhaka, Bangladesh. |
| [22] | BDHS. (2007). Bangladesh Demographic and Health Survey 2007. National Institute of Population Research and Training (NIPORT), Dhaka, Bangladesh. |
| [23] | Bongaarts, J. (1984). A simple method for estimating the contraceptive prevalence required to reach a fertility target, Studies in Family Planning, Vol. 15(4): 184-190. |
| [24] | Islam, N. and Islam, R. (2012). Factors associated with contraceptive use among adolescent of Bangladesh, Indian Journal of Innovations and Developments, Vol. 1(10): 436-446. |
| [25] | Stevens, J. (1996). Applied Multivariate Statistics for the Social Sciences, Third Edition, Lawrence Erlbaum Associates, Inc., Publishers, New Jersey. |
| [26] | Hossain, M. S. & Islam, M. R. (2013). Age Specific Participation Rates of Curacao in 2011: Modeling Approach. American Open Computational and Applied Mathematics Journal, Vol. 1(2):08-21. |
| [27] | Islam, M. R. (2005). Mathematical Modeling of Age Specific Marital Fertility Rates in Urban Area of Bangladesh. Pakistan Journal of Statistics, Vol. 21(3): 289-295. |
| [28] | Islam, M. R., Islam, M. N., Ali, M. K. & Mondal, M. N. I. (2005). Indirect Estimation and Mathematical Modeling of Some Demographic Parameters of Bangladesh, The Oriental Anthropologist, Vol. 5(2): 163 - 171. |
| [29] | Islam, M. R. (2007a). Construction of Abridged Life Tables and Indirect Estimation of Some mortality measures of Bangladesh in 2005, Journal of Population, Vol. 11(2): 117-130. |
| [30] | Islam, M. R. (2007b). Predicting Population for Male of Rural Area in Bangladesh. Journal of Statistical Research of Iran, Vol. 4(2): 227-238. |
| [31] | Islam, M. R. (2008). Modeling Age Structure for Female Population in Rural Area of Bangladesh. Journal of Interdisciplinary Mathematics, Vol. 11(1): 29-37. |
| [32] | Islam, M. R. and Beg, A.B.M. Rabiul Alam (2009). Modeling and Predicting Population of Dhaka District of Bangladesh, International J. of Mathematics and Computation, Vol. 4(9): 69-80. |
| [33] | Islam, M. R. and Beg, A.B.M. Rabiul Alam (2010). Modeling and Predicting Urban Male Population of Bangladesh: Evidence from Census data, International e Journal of Mathematics And Engineering, Vol. 1(1): 86-95. |
| [34] | Islam, M. R. (2011). Modeling of Diabetic Patients Associated with Age: Polynomial Model Approach, International Journal of Statistics and Applications, V. 1(1): 1-5. |
| [35] | Islam, M. R. (2012a). Mathematical Modeling of Age and of Income Distribution Associated with Female Marriage Migration in Rajshahi, Bangladesh. Research Journal of Applied Sciences, Engineering and Technology, Vol. 4(17): 3125-3129. |
| [36] | Islam, M. R. (2012b). Modeling and Projecting Population for Muslim of Urban Area in Bangladesh. International Journal of Probability and Statistics, Vol. 1(1): 04-10. |
| [37] | Islam, M. R. & Hossain, M. S. (2013a). Mathematical Modeling of Age Specific Adult Literacy Rates of Rural Area in Bangladesh. American Open Demography Journal, Vol. 1(1): 01-12. |
| [38] | Islam, M. R. and Hossain, M. S. (2013b). Mathematical Modeling of Age Specific Participation Rates in Bangladesh. International Journal of Scientific and Innovative Mathematical Research, Vol. 1(2): 150-159. |
| [39] | Islam, M. R. (2013). Modeling Age Structure and ASDRs for Human Population of Both Sexes in Bangladesh. International Journal of Anthropology, Vol. 28(1): 47-53. |
| [40] | Islam, M. R., Ali, M. K. & Islam, M. N. (2013). Construction of Life Table and Some Mathematical Models for Male Population of Bangladesh. American Journal of Computational and Applied Mathematics, Vol. 3(6): 269-276. |
| [41] | Islam, M. R. and Hossain, M. S. (2014a). Some Models Associated with Age Specific Adult Literacy Rates of Urban Area in Bangladesh. International Journal of Ecosystem, Vol. 4(2): 66-74. |
| [42] | Islam, M. R. and Hossain, M. S. (2014b). Mathematical Modeling of Age Specific Adult Literacy Rates in Bangladesh. Advances in Life Sciences, Vol. 4(3): 106-113. |
| [43] | Islam, M.R., Hossain, M.S. and Faroque, O. (2014). U-Shaped Pattern of Employees’ Job Satisfaction: Polynomial Model Approach, International Journal of Ecosystem, Vol. 4(4): 170-175. |
| [44] | Islam, M.R. (2014). Modeling of ASFRs and Study the Reproductivity of Women of Urban Area in Bangladesh, Advances in Life Sciences, Vol. 4(5): 227-234. |
| [45] | BBS (2007). Bangladesh Bureau of Statistics. Statistical Pocket Book of Bangladesh, Published November 2006, Dhaka. Planning Division. Ministry of Planning, Government of the People's Republic of Bangladesh. |