Reza O. Abbasian, John T. Sieben, Amy L. Gastauer
Department of Mathematics and Computer Science, Texas Lutheran University, Seguin, USA
Correspondence to: Reza O. Abbasian, Department of Mathematics and Computer Science, Texas Lutheran University, Seguin, USA.
| Email: |  |
Copyright © 2016 Scientific & Academic Publishing. All Rights Reserved.
This work is licensed under the Creative Commons Attribution International License (CC BY).
http://creativecommons.org/licenses/by/4.0/

Abstract
In this paper, we will explore the correlation between the star ranking of a football player and his future athletic success. Specifically, we will use statistical models to determine the probability of being drafted by an NFL team, as well as earning awards such as All-American designation in college, based on an individual’s high school star ranking. We will also investigate the relationship between an athlete’s position in the NFL draft and the athlete’s star ranking and other factors such as playing in a power conference versus a less prestigious conference.
Keywords:
Star ranking, NFL draft, Logistic regression
Cite this paper: Reza O. Abbasian, John T. Sieben, Amy L. Gastauer, Statistical Modeling of Success in College and NFL for a Star-Rated Football Recruit, International Journal of Statistics and Applications, Vol. 6 No. 4, 2016, pp. 235-240. doi: 10.5923/j.statistics.20160604.04.
1. Introduction
Since about 2002, several agencies have implemented a star ranking system for graduating high school football players. Each year senior athletes are ranked on a one to five-star scale based on athletic ability. These rankings are part of the information used for recruiting by colleges. Being ranked as a five-star player signifies an extremely talented individual. Every year there are approximately 300,000 high school senior football players. On average, only about 35 players per year have the honour to be ranked as a five-star athlete. That means only about 1 in 10,000 high school football players are given this prestigious ranking. Approximately 350 athletes each year are awarded a four-star ranking, and as the star value decreases, more players receive the ranking resulting in an extremely large group of unranked individuals. On National Signing Day, just over 3,000 high school players sign letters of intent with a Football Bowl Subdivision team (FBS, also known as I-A division program). Additional players sign with Football Championship Subdivision teams (FCS, also known as the I-AA level). This division was created in 1978 when the NCAA made the decision to split Division I football into FBS and FCS. Furthermore, some individuals choose to “walk-on” and try out for a college team once pre-season starts. In the end, about 12,000 high school players (around 4% of all high school senior players) get the opportunity to play college football. With such a small portion of high school football players continuing at the collegiate and professional levels, one would assume that the majority of successful NFL teams would be comprised of highly ranked five-star players. However, the article “How each Super Bowl 2015 Starter was Rated as a High School Recruit” by Bud Elliot and Peter Berkes [1] indicates that this is not the case. The article explains that in the 2015 Super Bowl the starting line-ups on each team had an average star ranking of about three-stars. Neither team contained any five-star athletes. They did, however, have a few four-star players. It is noted that there are several athletes who could have potentially been ranked as four or five-star athletes, had the star-rating been in place when they were recruited. Is the low-star average of players participating in the Super Bowl 2015 an anomaly? A look at the starting line-up of the Super Bowl teams in the past eight years shows that the star-ratings range between 2.82 to 4.00, with an average of 3.24. The graph below shows the average star ranking for the players on both the winning and losing teams in each Super Bowl for the past four years, and clearly indicates that the star-rating of three is not unusual at all. 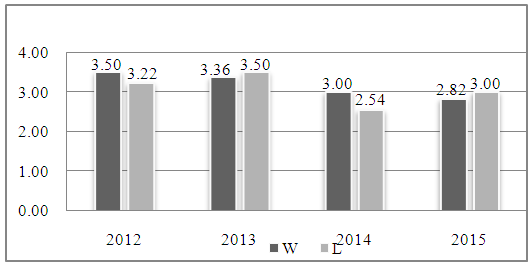 | Figure 1. Average Rank of the Starting Line-Up of Super Bowl Teams |
The article [1] was the motivation for our study. Specifically, in our work we have attempted to answer the following questions:1. Was the average three-star starting line-up for each team at the Super Bowl due to the large number of two and three-star available players and a scarcity of four and five-star players in NFL? Or were high-star players initially recruited but simply did not perform well once they were drafted and hence were not in the Super Bowl line-ups? 2. Does a high-star ranking translate into an early pick in the NFL draft? 3. How does playing in power conferences versus non-power conferences affect a player's chance of earning an All-American award and his prospects in the NFL draft? There have been some related studies about the performance of star-rated athletes in college. For example, Ghigiarelli [2] examines the anthropometric and combine performance differences between highly recruited and recruited high school football players. In another paper, Langelett [3] studies the effect of the quality of recruiting classes on the team performance in college football. However, in our literature search we found no published work that indicates any statistical analysis that predicts the probability of success for star-rated athletes in college and NFL.
2. Data Gathering and Methodology
In the following study we have considered data from ten years of high school recruits, 2003 to 2012. We chose to observe this range of years because 2002-2003 was the year in which ranking of high school athletes was first implemented. 2012 is nominally the most recent year that a current NFL player would have been a high school senior and been ranked. Using the 2003-2012 observations and a Logistic (Logit) model [4], we determined the probability of NFL draft for players at each star ranking. It must be noted that individuals change drastically between their senior year of high school and their senior year of college. This uncertainty is expressed by Steven Lassan, [5] “There is no team sport for which it is as difficult to evaluate prospects at such a young age as football. The nature of the sport provides many unknowns. Will the player put on weight or lose it? Will he stay healthy? And, when times are tough, will he respond with competitiveness and heart the coach hopes to see?” Additionally, in a college career individuals change positions. For instance, Ryan Tannehill from Texas A&M was recruited from high school as a three-star quarterback, but at the beginning of his 2010 season he started as a receiver. He then finished his season as the starting quarterback for Texas A&M [6] and eventually was able to land the eighth overall pick in the 2012 NFL draft. This shows that an individual who is assigned a certain rank for a given position could, during college, change positions to one for which he is better suited. For additional discussion about athletes changing positions see [7]. However, accommodating ourselves to available data, this study considers the likelihood that a certain star recruit will be able to make it into the NFL, ceteris paribus. Later, other factors such as conference affiliation or being chosen for the All-American team are given further consideration. Currently there is not a complete database available to the public concerning high school football athletes and their general statistics. Our information was gathered from rivals.com [8]. Rivals.com had the most complete set of information available to a non-subscription user. The site offered information on approximately 2,000 players per recruiting year from the pool of 300,000 high school players [9]. The data for each of our years contained information on the five, four, and most three-star recruits as well as information on some two, one, and unranked players. The site, however, did not contain information on all 300,000 individuals per recruiting year, so we used an approximation method to estimate the number of players ranked at two, and one-star, as well as the number of unranked players. To estimate the number of unranked, one, and two-star players, we relied on the available ten years of information from rivals.com. Figure 2 is a time series representation of the number of five, four and three-star players in the past ten years. As the figure indicates, since 2002 the number of three-star rankings has increased moderately, though the numbers of four and five-star players has remained relatively constant. 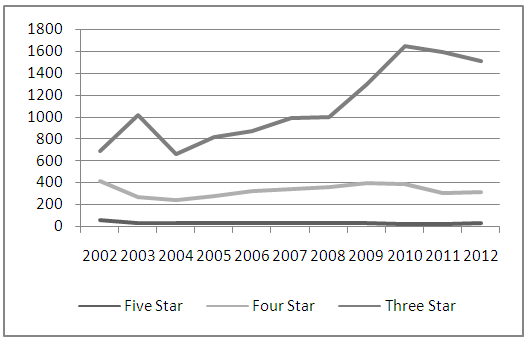 | Figure 2. Time Series Representation of Star-Rated High School Players |
A reliable ten year average was then calculated for the five, four, and three-star players. Using these data points (33, 354 and 1202 for ten year averages of five, four and three-stars) and least squares approximation, an exponential model was created: 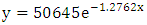 | (2.1) |
We used a decreasing exponential model,  with
with  because as the star value increases there is a drastic decrease in the number of players awarded this star. From the exponential model we estimated the number of one and two-star players. Unranked players were calculated by subtraction of the numbers of ranked players from the pool. Figure 3 illustrates the prestige of being considered a five-star athlete. Less than 1% of high school seniors are ranked as three-stars or greater, and less than .02% of high school seniors nationwide have the honour of being considered a five-star athlete. The mean for this distribution is 0.43. Note that “ur” refers to the zero and unranked players.
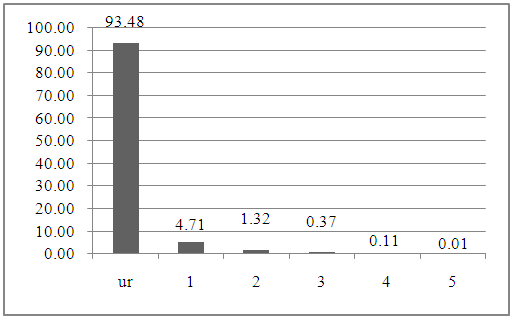 | Figure 3. Distribution of Star Ranking for High School Football Players |
For information on individuals who were NFL draftees, the data gathered from rivals.com was then cross referenced with information gathered from NFL.com [10]. Additionally, NFL.com provided information concerning individuals who were selected to play in the Pro-Bowl, which is essentially an “All-Star” game for the National Football League. From the gathered information Figure 3 was created, which provides a general overview of the population of high school athletes and their subsequent careers in the NFL. Taking a look at the distribution of NFL draftees (Figure 4) we see that, as expected, compared to the population of high school athletes, two to five-star individuals are over represented in the NFL Draft. This is particularly notable for five-star draftees who comprise 0.01% of high school senior players, but 8.21% of players selected in the NFL Draft. The mean for the distribution is 3.21, which closely follows the average star-rating of the teams competing in Super bowl. 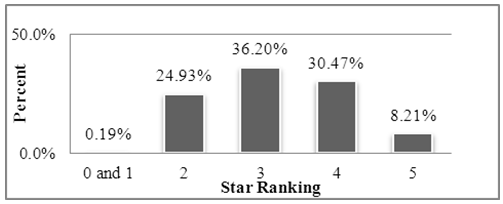 | Figure 4. Distribution of Star Ranking for NFL Draft |
There are about 12,000 individuals that play college football in a given year. With rivals.com providing information on just 2,000 individuals, 10,000 college players were left unaccounted for. To try to account for these athletes, a method very similar to the one used to estimate unranked, two, and one-star players was employed here. The data on five, four, and three-star players was used to create an estimate for the distribution of lower ranked players. In this case, the exponential model has a small slope and resembles a linear model. A linear model is reasonable, because as athletes rise to the collegiate level a smaller percentage of the “less talented” individuals decide to continue forward in their athletic career. Using the linear model: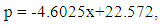 | (2.2) |
with p as the percentage and x the number of stars, we estimate the number (and percentage) of two-star players to be 1604 (13.37%) and one-star plus unranked (ur-1) players to be 8898 (74.15%). This linear equation helps account for the smaller number of lower-starred individuals moving forward. Our results are summarized in Figure 5. The mean for this distribution, based than our model, is 0.86.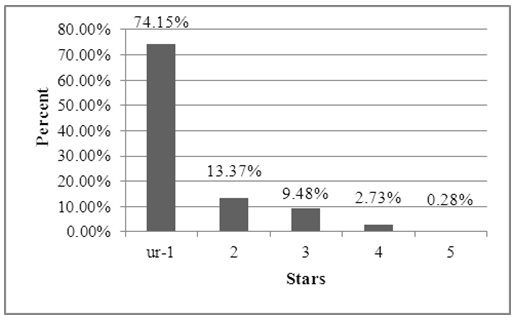 | Figure 5. Distribution of Star Ranking for College Players |
Summary of our findings, from the available and estimated data, is represented in Figure 6. The graph clearly shows the increase mean star ranking of the players as we move from high school (mean=0.43) to college (mean =0.86) to NFL (mean= 3.21). | Figure 6. Comparing the Distribution of Star Ranking for High-School, College and NFL |
3. NFL Career Determined By Star Ranking
In this section we use a Logistic binary model to estimate the probability that a player with a given star ranking, will be drafted and play in the NFL. Code “becoming an NFL player” as a 1, and “not becoming an NFL player” as 0. To find the probability function we considered two approaches:1. In the first model we used ten years of data gathered from rivals.com. Using Minitab for data on approximately 20,000 individuals (which uses least squares to determine parameters in 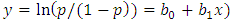 , resulted in the following Logistic model, where
  is the probability of becoming an NFL player and
  is the player’s star-rating:
 | (3.1) |
2. In the second model we used a direct approach. We calculated the percentage, p (probability), of making it into the NFL for a given star from the available data, and then we used a quadratic interpolation for  where
where 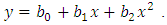 Solving for p, we arrive at the following model:
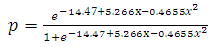 | (3.2) |
Figure 7 demonstrates both models. The dark line represents the probability using model (3.1) and the light line shows the probabilities using model (3.2). Both methods indicate that as the star value of a player increases, so does the probability of making it into the NFL. The first model gives an optimistic probability of NFL draft for zero, one, and two-star players, most likely due to the lack of complete information on the given stars. It predicts a larger portion of the low-star players making it into the NFL than what happens in reality. We believe the second model is a more realistic representation of probability of success for star-rated players.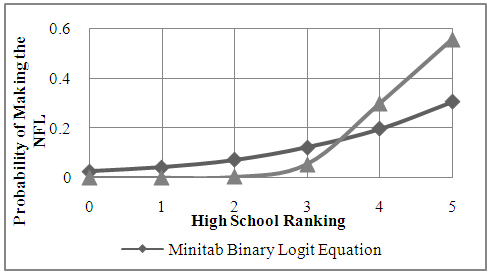 | Figure 7. Probability of NFL Draft for Star-Rated Players |
4. Average Pick Number and Star Rating
From the data gathered on the individuals who were drafted into the NFL, there is a clear trend showing that as the ranking of the recruit increases (number of stars), the average pick number tends to drop. A linear regression analysis (where y = average pick number and x=star-rating) gives us a coefficient of determination of r2 = 0.58 (r2 = 0.65 for a quadratic fit), which shows a strong negative correlation between the average pick number and the star-rating. We think the correlation is even stronger. Considering that there were so few data points for the zero and one-star players, averaging the pick for the players was thought to create a more accurate representation of where the individual would be picked at when they were ranked at a lower-star. The new regression: 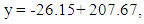 | (4.1) |
with y as the pick number and x as the star-rating, yields a coefficient determination of r2 = 0.955, which suggests an almost perfect correlation between the star ranking value and the number at which an individual is selected in the NFL draft.  | Figure 8. Overall Average Pick Number (0 and 1 combined) vs. Star-Rating |
5. Power Conferences, Non-Power Conferences and NFL Draft
Many occurrences that impinge on the future of an athlete are beyond their control. For example, a sprained ankle, growth spurt, or a family issue are not things that could easily be controlled by the athlete. A five-star athlete does, however, have the ability to control which school they attend (usually to a high degree if not completely), which means they decide whether or not they play in a power conference. A power conference school is a school located in the Power Five Conference (P5), which is where the highest level of collegiate football in the United States is played. Typically, most five-star athletes would decide to compete at a P5 school in order to improve their chances of being able to compete in the NFL. The P5 include the ACC, Big-10, Big-12, Pac-12, and SEC conferences.We have already discussed the overall probability of star-rated players making it to NFL (Figure 7). Those probabilities may change based on whether or not an individual in his collegiate career plays for a school located in the P5. So let us compare a Logit model for the probability of NFL success for players in P5 versus those who attend non-P5 universities. Looking at these numbers will show whether or not going to a P5 school is imperative for being drafted into the NFL.A technique very similar to the one we used to estimate the probability of making it into the NFL based only on the high school ranking was used to calculate the probability of being drafted into the NFL predicting from a player’s star rating and the conference he played for in college (really long sentence). The darker grey (Figure 9) depicts the probability of NFL draft for players coming from P5 schools. The lighter grey depicts the probability of NFL draft given that the athlete had chosen to attend a non-P5 college. At first glance the results might seem surprising. For example, it shows that players at non-P5 schools who are three or four-star individuals have slightly larger probability of making into the NFL than their counterparts in P5 conferences. However, even though P5 schools have lower probability (other than at the five-star rating), the number of drafted players in the P5 schools is much larger than the non-P5 schools. In fact, in the past 10 years a total of 163 five-star players from P5 schools have been drafted into the NFL versus a mere 9 five-star players from Non-P5 schools. 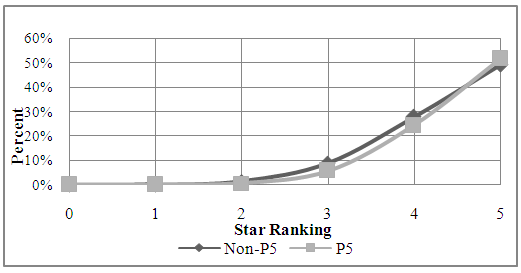 | Figure 9. Probability of NFL Draft for Players from P5 and Non-P5 Schools |
To look further into the dynamics of choosing a P5 school over a non-P5 school, let us look at the average draft pick number for the two groups. Results are presented in Figure 9. On average, non-ranked players and players with one through four-stars at P5 schools are selected earlier in the draft, whereas five-star players from non-P5 are picked earlier. However, as we mentioned earlier, at the five-star level there is a huge difference in the number of drafted five-star players from non-P5 schools in the same period. Therefore, a reasonable approach in comparing the pick numbers for P5 and non-P5 conferences would be to consider results at all levels (0 to 5) in a multivariable model.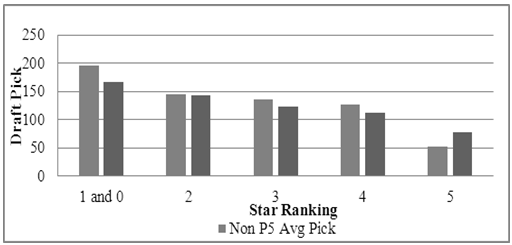 | Figure 10. Average Draft Pick Number for P5 and Non-P5 Schools |
Using a multiple linear regression model where star-rating, P5 and non-P5 schools, are predictors of pick number, we obtained the equation:  | (5.1) |
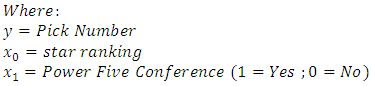 The p-value for the coefficient of
  is less than 0.0001 (95% confidence interval between -21.78 and -14.16). This implies a very strong correlation between y and
  and as the star ranking of a player increases by one, the pick value will decrease by 17.87 places (the higher the star the earlier one gets drafted). For the coefficient of
  p-value is 0.22 (95% confidence interval between -13.4 and 3.0). The large p-value for this coefficient implies that statistically there is little difference in the pick number for athletes from P5 schools versus their non-P5 counterparts. In short, star ranking is the determining factor for a better pick number.
6. Stars and First Team All American
A strong indicator of success in college football is being selected for the First Team All-American game. Being picked for this team is a recognized honour for collegiate athletes. Those are considered the best players at their position for a given season. Using our data gathered in starting the project, we have created a multivariate Logistic model for P5 and non-P5 schools, with x=number of stars and y= “1” for P5 and “0” for non-P5, to estimate the probability of becoming an “All-American”:  | (6.1) |
The p-values for the coefficients of equation (6.1) are all less than 0.0001, indicating a statistically significant correlation for all parameters. Figure 11 shows that as the star value of an individual increases their probability of becoming an All-American increases as well. Furthermore, an athlete competing in a P5 conference has a higher probability of being selected as an “All-American”.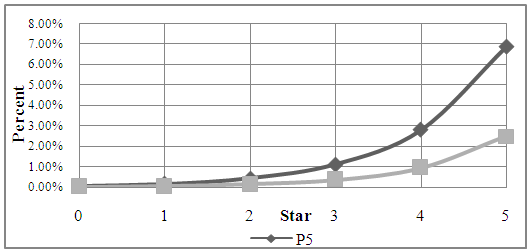 | Figure 11. Probability of First Team All-American for P5 and Non-P5 Athletes |
7. Conclusions
It was shown through this study that the likelihood of success in college and NFL draft increases with a player’s star ranking. Higher-star players are drafted with a higher probability and are selected earlier in the draft. Our study did not find any statistically significant evidence that the choice of a conference affects the probability of the draft. However, we found that playing for a school in a power conference generally results in a higher probability of being selected as an All-American.
ACKNOWELEDGEMENTS
We would like to thank the Texas Lutheran University Research and Development Fund which partially supported this research.
References
| [1] | Elliott, B. and Berkes, P. (2015) How each Super Bowl 2015 Starter was Rated as a High School Recruit available at: http://www.sbnation.com/college-football-recruiting/ (Accessed: 12 May 2015). |
| [2] | Ghigiarelli, Jamie J, “Combine Performance Descriptors and Predictors of Recruit Ranking for the Top High School Football Recruits from 2001 to 2009: Differences between Position Groups”, Journal of Strength & Conditioning Research, Vol. 25 (5), pp 1193-1203, May 2011. |
| [3] | Langelett G., “The Relationship between Recruiting and Team Performance in Division 1 A College Football”, Journal of Sports Economics, Vol 4(3), pp 240-245, August 2003. |
| [4] | A. Agresti, An Introduction to Categorical Data Analysis, 2nd ed., Hoboken, New jersey: Wiley publishing, 2007. |
| [5] | Lassan, S. (2012, July 12). College Football Recruiting Rankings: Do They Matter available at http://athlonsports.com/college-football/ [Accessed July 13, 2015]. |
| [6] | Daughters, A. and 24, F. C. F. (2015). CFB Players Who Should Change Positions. Bleacher Report, Bleacher Report. [Online]. Available at: http://bleacherreport.com [Accessed: 2 August 2015]. |
| [7] | Donaldson, A (2015, September 22) Changing Positions can be Difficult but can also Launch Careers, Bolster Teams [online], available at:http://www.desertnews.com/article/865637388/Changing-positions-can-be -difficult-but-can-also-launch-careers-bolster-teams.html?pg=all [Accessed 7 July 2016]. |
| [8] | Anon. (n.d.). Rivals.com Search Results-Yahoo Sports. [Online]. Available at:http://sports.yahoo.com/ncaa/football/recruiting/[Accessed: 25 May 2015]. |
| [9] | Hilton, A. (2014). NFL Dreams, Collegiate Reality. Recruit 757, Recruit 757. [Online]. Available at: http://www.recruit757.com/nfl/ [Accessed: 23 June 2015]. |
| [10] | NFL.com Draft 2015 - NFL Draft History: Full Draft Year (no date) Available at: http://www.nfl.com/draft/history/ [Accessed: 7 July 2015]. |

 Abstract
 Reference
 Full-Text PDF
 Full-text HTML