-
Paper Information
- Previous Paper
- Paper Submission
-
Journal Information
- About This Journal
- Editorial Board
- Current Issue
- Archive
- Author Guidelines
- Contact Us
International Journal of Statistics and Applications
p-ISSN: 2168-5193 e-ISSN: 2168-5215
2016; 6(4): 223-234
doi:10.5923/j.statistics.20160604.03

Zero Inflated Regression Models with Application to Malaria Surveillance Data
 Abstract
 Reference
 Full-Text PDF
 Full-text HTML
Kehinde P. Akinpelu1, Oyindamola B. Yusuf1, Onoja M. Akpa1, Abass O. Gbolahan2
1Department of Epidemiology and Medical Statistics, Faculty of Public Health, College of Medicine, University of Ibadan, Nigeria
2State Ministry of Health, State Secretariat, Nigeria
Correspondence to: Oyindamola B. Yusuf, Department of Epidemiology and Medical Statistics, Faculty of Public Health, College of Medicine, University of Ibadan, Nigeria.
| Email: |  |
Copyright © 2016 Scientific & Academic Publishing. All Rights Reserved.
This work is licensed under the Creative Commons Attribution International License (CC BY).
http://creativecommons.org/licenses/by/4.0/

Monthly reports of malaria cases are usually presented as count data potentially with excess zeros. The standard Poisson and negative binomial regression used for modeling such data cannot account for excess zeros and over-dispersion. Hence, this study was designed to model the annual trends in the occurrence of malaria among under-5 children using the zero inflated negative binomial (ZINB) and zero inflated Poisson regression (ZIP). The study also determined the effects of month, year and geographical location on the occurrence of malaria. Malaria surveillance data were obtained from the Integrated Disease Surveillance and Response (IDSR) of Oyo State Ministry of Health, Nigeria from 2010 – 2014. Descriptive statistics were conducted to check for the presence of over-dispersion. Model comparisons were performed between ZINB and ZIP and the best model was selected using Vuong z-statistic criteria. Incidence rate ratios and 95% CI were determined. There were slight variations in the incidence of malaria cases; 35.81 per 1000 in 2011, 35.64 per 1000 in 2013 and 35.72 per 1000 in 2014. The highest risk of malaria was in the year 2014 (IRR = 3.59, 95% CI: 3.05, 4.23) and lowest in 2012 (IRR =2.56, 95% CI: 2.31, 2.83). The risk of malaria was highest in October (IRR = 1.47, 95% CI: 1.15, 1.88) and lowest in January (IRR = 0.80, 95% CI: 0.69, 0.94). The highest risk of malaria was reported in Saki West (IRR= 4.77, 95% CI: 3.58, 6.35) and lowest in Ogbomoso South (IRR = 0.73, 95% CI: 0.55, 0.97). The Vuong z-statistic for the ZINB and ZIP models was -17.079 (i.e. V < -1.96), indicating that ZINB fits the data better. The zero inflated negative binomial regression is the best model to determine the factors that predict the number of cases of malaria, when there is an indication of over dispersion and excess zeros. Zero inflated negative binomial model is suggested for researchers dealing with similar data.
Keywords: Malaria, Over dispersion, Zero inflated count models
Cite this paper: Kehinde P. Akinpelu, Oyindamola B. Yusuf, Onoja M. Akpa, Abass O. Gbolahan, Zero Inflated Regression Models with Application to Malaria Surveillance Data, International Journal of Statistics and Applications, Vol. 6 No. 4, 2016, pp. 223-234. doi: 10.5923/j.statistics.20160604.03.
Article Outline
1. Introduction
- Modeling count data in the health sciences continues to pose a challenge even for the most experienced researchers. The standard methods for explaining the relationship between outcome variables and a set of explanatory variables typically involve Poisson and negative binomial modeling techniques. However, the basic Poisson regression model forces the conditional variance of the outcome to be equal to the conditional mean. The negative binomial regression can be written as an extension of Poisson regression and this allows greater flexibility in modeling the relationship between the conditional variance and the conditional mean compared to the Poisson model. In addition, an often encountered characteristic of count data is that the number of zeros in the sample can exceed the number of zeros predicted by either Poisson or negative binomial model [1]. Zero-inflated models are interpreted as a mix of structural and sampling zeros from two processes; the process that generates excess zeros from a binary distribution which are the structural zeros, and the process that generates both non-negative and zero counts from Poisson or Negative Binomial (NB) distributions which are the sampling zeros [2]. However, these seemingly simple and straightforward approaches to modeling may not be appropriate when observations include excess number of zeros [3] such as the number of cases of malaria in under-5 children. Zero-inflated models have been developed for the Poisson model [3], the Negative Binomial model [4] and other models which are used in different fields such as econometrics, demography, medicine, public health, epidemiology, biology etc. One of their main features is that they adjust well to data from a particular mixture of two populations: one that has only zero counts and another in which the counts are the realizations of a discrete distribution. The main motivation for zero-inflated count models is that real-life data frequently display over-dispersion and excess zeros [3], [5].The zero inflated Poisson model deals with heterogeneity associated with excess zeros. It uses a Poisson distribution that has been mixed with a point mass at zero to allow for the inclusion of additional structural zeros but does not handle over-dispersion [6], [7], [3]. The ZIP regression model was first introduced by Lambert who applied it to manufacturing detects [3]. Lambert provided a motivation application of these models and discussed the case of zero-inflated Poisson. In a study by Ridout et al. (1998), ZIP regression models were applied to apple shoot propagation data. The ZIP models were inadequate for the data as there was evidence of over dispersion. Other contemporary applications for the ZIP regression model can be found in dental epidemiology [8], occupational health [9], and children’s growth and development [10]. In practice, after accounting for zero-inflation, the non-zero part of the count distribution is often over-dispersed. In this regard, Greene (1994) had described an extended version of the negative binomial model for excess zero count data, the Zero-Inflated Negative Binomial (ZINB). The ZIP parameter estimates can be severely biased if the non-zero counts are over-dispersed in relation to the Poisson distribution.The zero inflated negative binomial model deals with both over-dispersed and zero-inflated data [11], [4]. It assumes there are two distinct data generating processes. The result of Bernoulli trial is used to determine which of the two processes is used. For observation i, with probability πi the only possible response of the first process is zero counts, and with probability (1-πi) the response of the second process is governed by a negative binomial with mean λi. The zero counts are derived from the first and second processes, where a probability is estimated for whether zero counts are from the first or the second process. The overall probability of zero counts is the combined probability of zeros from the two processes [1]. The ZINB regression model was also applied to human microbiota sequence data with random effects. The results revealed that the simulation study used indicated that the method of estimation gave unbiased results for both fixed effects and random effects [1].
1.1. Application to Malaria Surveillance Data
- Disease surveillance is the continuous scrutiny of occurrence of disease and health-related events to enable prompt intervention for the control of diseases. It includes the ongoing systematic collection, collation, analysis and interpretation of data on disease occurrence and public health related events and dissemination of the information obtained from such data for prompt public health action [12]. Incidence is a measure of the number of new cases of a disease or other health outcomes that develop in a population of individuals at risk, during a specified time period. Malaria is the most prevalent tropical disease in the world today. The disease affects approximately 650 million people and kills between one and three million, most of them young children in Sub-Saharan Africa. Malaria is endemic throughout Nigeria with seasonal variation in different geographic zones of the country; the 2011 US Embassy Nigeria Malaria Fact Sheet established that an estimated 65% of the Nigerian population live in poverty which has been linked with malaria. The disease is regarded as a major limitation to economic development in tropical and subtropical regions because rainfall, warm temperatures, and stagnant waters provide habitats ideal for mosquito larvae [13]. Malaria infection during the crucial first five years of life is a major public health problem in tropical and subtropical regions throughout the world [14]. About 97% of the population are at risk of malaria and the remaining 3% live in the malaria free highlands (Southern Jos, the plateau state). The prevalence among children aged 6 - 59 months in south-west Nigeria was 50.3% while the least prevalence, (27.6%), was observed in children aged 6 to 59 months in the south-east region [15]. This is important to note because Oyo State, as the focus of this study, is located in south western Nigeria and has been the recipient of several initiatives to combat the disease in under 5 children. The Roll Back Malaria (RBM) Partnership converged in Abuja in 2000 to develop strategies for appropriate and affordable treatment for affected persons in malaria-endemic communities [16]. In 2005, Nigeria adopted artemisinin-based combination therapies (ACTs) as first-line therapy for uncomplicated malaria. It was determined that by 2010, 80% of persons with malaria would be effectively treated [17]. Furthermore, intermittent preventive treatment for prevention of malaria in pregnancy (IPTp) is a key component of malaria control strategy in Nigeria and sulfadoxinepyrimethamine (SP) is the drug of choice. However, despite the evidence of the effectiveness of IPTp strategy using SP in reducing the adverse effects of malaria during pregnancy, the uptake and coverage in Nigeria is low [18]. It is important to note in studies analyzing incidence / prevalence rates, that the year / timing of introduction or intensification of these intervention strategies in different populations may affect the observed incidence rates in those years.In 2013, the ITN ownership programme in Nigeria recorded coverage of 20.3% in the southwest [19]. In addition to the direct impact of malaria, there are also severe social and economic burdens on communities and the country as a whole, with about 132 billion naira lost to malaria annually in form of treatment costs, prevention, [20] [21]. One of the most recent of these intervention policies, the Affordable Medicines Facility-malaria, is a product of the Roll Back Malaria Partnerships and was developed to correct low access to ACTs as well as to prevent the development of resistance to artemisinin based therapies. Distribution of Affordable Medicine Facility-malaria Artemisinin Combination Therapies (AMFm-ACTs) started in Nigeria in 2011; however a recent study by [22] to assess the level of awareness and utilization of this facility uncovered a very low level of awareness with about 9.1% of respondents aware of its availability. Such lack of awareness greatly hampers the effectiveness of such intervention programmes because these heavily subsidized drugs usually do not get to the target under-5 population and this significant finding may influence the observed pattern of malaria incidence, among other factors. [22]It is important to take into account the effect of seasonal variations in Malaria transmission in Africa. Although no standard way of defining malaria seasonality currently exists [23], several studies have demonstrated that the seasonality of rainfall, minimum temperature and irrigation are important determinants of the seasonality in the entomological inoculation rate (EIR) of malaria [24]. Furthermore, environmental factors have been shown to modify malaria transmission with clear differences documented between the patterns of transmission in rural versus urban areas [25]. For example, [26] working in Sokoto in northern Nigeria, demonstrated that the highest prevalence rate was recorded in the month of August with 59.5% positive cases and the month of March had the least infection rate of 9.18%. The age group of 0 - 5 years was also found to have the highest infection rate of 43.77%. Similarly, in Benin city, [27] who investigated the seasonal variation of malaria parasitaemia in an urban tropical city from January to December 2001, found that the highest malaria incidence (56.7%) were in the months of July, August and September and the lowest was found in the month of June. The study revealed that the peak of malaria incidence coincided with the height of the rainy season and low incidence in dry season which is between November and April and accounted for 43.3%.The rate of malaria infection across space depends on dynamic processes involving complex climatic, environmental, physical, and social variables operating differently in space [28]. In a study by [29] working among symptomatic patients who sought medical attention in Minna, Nigeria, it was demonstrated that the mean annual malaria incidence rates were significantly different over the 4-year study period with a drastic decline in malaria cases from 2005 through 2007. The monthly/seasonal climatic results revealed that malaria incidence rates were higher in the months of June to August and the highest malaria incidence rate of 170.75 ± 131.86 was recorded in August and this was not significantly different from the relatively lower rates recorded in September and October. There was therefore distinct seasonality in the monthly mean hospital attendance and malaria rates. Higher numbers of cases were recorded in the rainy than dry season. The study concluded that malaria incidence rates decreased over the 4 years and that malaria transmission in the area is highly seasonal and strongly influenced by rainfall and relative humidity.Another study on malaria in the Highlands of Obudu cattle ranch Cross River state, Nigeria, recorded the highest cases of malaria (34.6%) in 2010 with prevalence rate of 82.29/1000 and lowest cases (16.0%) in 2008 with a prevalence rate of 39.61/1000. Incidence was highest among children aged between 5 and 14 years while children under-5 years contributed 24.69%. Varying incidence rates were observed in the years within the period with 102 cases (31.5%) reported in the dry season and 222 cases (68.5%) in the wet season. The study concluded that further studies are needed in order to assess the influence of climate change on the transmission pattern [30]. The magnitude of the burden of the disease in under-5 children remains high [31], because children of this age group are more susceptible [32], [33]. The number of cases of malaria contains excess zeros and failure to account for excess zeros in a count dataset may subsequently result in biased parameter estimates and wrong inferences. The knowledge of the proportion of excess zeros in the number of cases of malaria will help to improve the inference thereby providing valuable information for policy makers. Hence this study was designed to model annual trends in the incidence of malaria in under-5 children in South-Western Nigeria using the Zero inflated Poisson regression and Zero inflated negative binomial regression models.
2. Methodology
2.1. Study Area
- The study area comprised of the health facilities in all the 33 local government areas of Oyo state. With a land area of 27,148km2 and a population of 6 million, Oyo state is the second largest state in the South-west, Nigeria. The state was carved out of the former Western region of Nigeria in 1976. Administratively, the state consists of 33 local government areas predominantly inhabited by the Yoruba tribe (but comprising of selected distinct Yoruba dialects in the four corners of the state). The dry season lasts from November to March while the wet season starts from April to October annually. Average daily temperature ranges between 25 °C (77.0 °F) and 35 °C (95.0 °F), almost throughout the year. The vegetation pattern of Oyo State is that of rain forest in the south and guinea savannah in the north. The state operates three-tier health care services; primary, secondary and tertiary health care facilities across urban and rural areas. There are 1,648 health facilities disaggregated into 631 Primary Health Centres (PHCs), 46 Secondary Health Facilities (SHFs), 5 Tertiary Health Centres (THCs) and 968 registered private health facilities [34].
2.2. Study Design
- A malaria longitudinal surveillance data (2010 to 2014) of under-5 children was obtained from the database of the Integrated Diseases Surveillance and Response (IDSR) of Oyo State Ministry of Health, Nigeria.
2.3. Study Population and Data Extraction
- Outpatient and inpatient records from the 764 health facilities in 33 local government areas in Oyo state were used. For the purpose of the present study, data were extracted and re-entered into excel sheet. A total number of 1,980 observations of children aged 0-59 months who were infected with malaria from 2010 to 2014 were used. Information on the LGA of domicile, month and year of infection were also extracted as explanatory variables in the analysis.
2.4. Data Management
- Descriptive statistics including mean and standard deviation (SD) were computed to check for the presence of over-dispersion. The pattern of infectious disease among under-5 children over the years in the 33 local government areas was examined using descriptive statistics. The zero inflated negative binomial and zero inflated Poisson models were used to determine the effect of season (defined as month of reporting) years and the geographical location (determined by the 33 local government areas) on the occurrence of malaria. Incidence rate ratio (IRR), 95% CI and their p-values were reported. Maximum likelihood technique was used to estimate the parameters of the two models using the logit function. Model comparisons were performed between ZINB and ZIP using Vuong z-statistic selection criteria and the best fitting model for the number of cases of malaria was selected.
2.5. Statistical Models
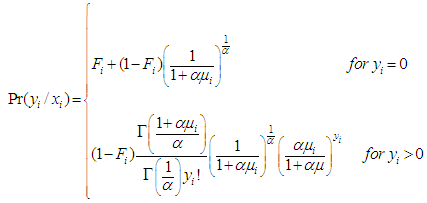
- The number of reported cases of malaria among under-5 children in Oyo state would be zero-inflated by those months when no child was infected with malaria or those months when though children were infected with malaria, cases were not reported in any health facility in the given LGA. In this situation, the zero-inflated Poisson (ZIP) or the Zero-inflated Negative Binomial (ZINB) models are more plausible due to the zero-inflated problems inherent in the data. The ZIP employs two component models that correspond to two zero generating processes. The first process is governed by a binary distribution that generates structural zeros while the second process is governed by a Poisson distribution that generates counts, some of which may be zero [3]. Let the response variable
 be the reported cases (number of children) of malaria at a given time point
  Assuming
  is the probability that the response
  for the
  point in time is necessarily 0 and
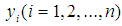
  is the expected value of the count response, then the two component models are described as follows:The probability of observing a zero (0) count is
  | (1) |
 is
is 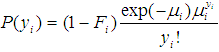 | (2) |
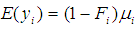 and
and 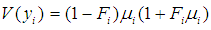 as conditional expected values and variance of
  respectively [35].Combining equations (1) and (2) above and assuming that
  is the matrix of covariates or independent variables in the model, we have a stage equation for the ZIP model as follows:
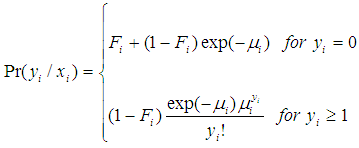 | (3) |
 | (4) |
2.6. Model Comparison
- 2.6.1. The Vuong’s TestIn the present study, model comparison was achieved using the Vuong test [36] [2]. A comparison between two non-nested models with probability mass functions
 and
and  can be performed using Vuong test [36], [2]. Briefly, using the maximum likelihood estimation procedures, the Vuong test specifically tests the null hypothesis that the two models fit the dataset equally well and model comparison was based on the predicted probabilities of the two competing models [36].Let
  be the predicted probability of an observed count for case
  from the model
  Given a sample of size
  and defined
  as:
as: 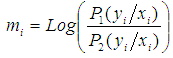 | (5) |
 is given by:
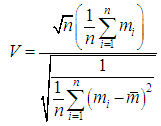 | (6) |
3. Results
3.1. The Distribution of Reported Cases of Malaria in Under-5 Children
- The amount of zero in the reported cases of malaria in under-5 children in Oyo state is about 27% and although more than one thousand cases of malaria had been reported at some points, reported cases never reached 10% at any point (Figure 1).
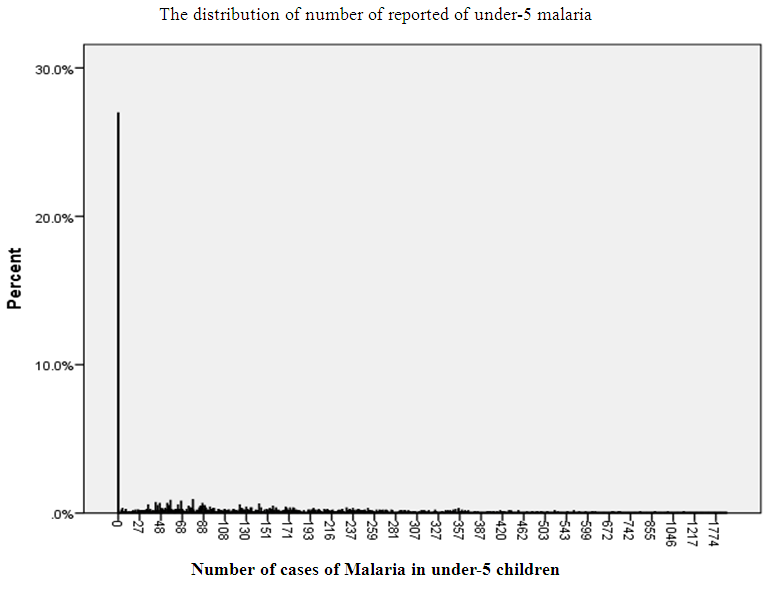 | Figure 1. The distribution of number of reported of under-5 malaria |
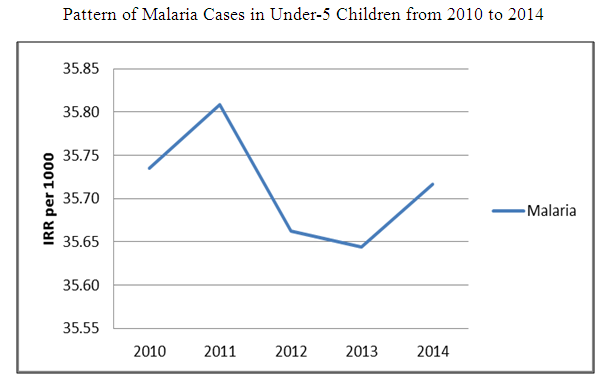 | Figure 2. Pattern of malaria cases in under-5 children from 2010 to 2014 |
3.2. Assessing the Effect of the Explanatory Variables (Month, Year and Local Government Area) on the Occurrence of Malaria among Under-5 Children in Oyo State using the ZINB Model
- Table 2 shows the regression parameters for the zero inflated negative binomial regression and zero inflated Poisson regression models. The risk of malaria among under-5 children was higher by 166.6% in the year 2011 compared to year 2010 (IRR = 2.166, 95% CI: 1.953, 2.403). In 2012, there was an excess risk of 155.5% compared to year 2010 (IRR =2.555, 95% CI: 2.307, 2.829) and in 2014, there was an increase of 258.9% compared to year 2010 (IRR = 3.589, 95% CI: 3.045, 4.232). For the months of reporting in the ZINB model, the risk of malaria among under-5 children increased by 28.7% in August (IRR = 1.287, 95% CI: 1.087, 1.523), 32.2% in July (IRR = 1.322, 95% CI: 1.117, 1.564) and 46.8% in October (IRR = 1.468, 95% CI: 1.145, 1.883) compared to the risk in the month of April. However, the risk of malaria decreased in the reporting months of February (IRR= 0.824, 95% CI: 0.701, 0.970) and January (IRR = 0.804, 95% CI: 0.685, 0.944) compared to the risk in the month of April (Table 2).For the local government areas, the risk of malaria was higher by 366.6% in Atiba (IRR = 4.665, 95% CI: 3.518, 6.186), 204.9% in Egbeda (IRR = 3.049, 95% CI: 2.291, 4.060), 304.7% in Ibadan North (IRR = 4.047, 95% CI: 3.022, 5.420) and 376.8% in Saki West (IRR= 4.768, 95% CI: 3.582, 6.348) compared to the risk in Afijio LGA. However, the risk of malaria was lower by about 44% in Ibarapa North (IRR = 0.558, 95% CI: 0.418, 0.744), 30.9% in Irepo (IRR = 0.691, 95% CI: 0.539, 0.886) and 27% in Ogbomoso South (IRR = 0.727, 95% CI: 0.546, 0.968) compared to the risk in Afijio local government area (Table 2).For the zero inflated group, in 2011, the odds of a malaria case being in the certain zero group was 6 times higher compared to year 2010. (IRR = 5.954, 95% CI: 2.243, 15.801). In 2013, the odds of a malaria case being in the certain zero group was 3 times higher (IRR =3.421, 95% CI: 2.641, 4.431) compared to year 2010. However, in year 2012, the odds of a malaria case being in the certain zero group was lowered (IRR = 0.005, 95% CI: 0.000, 0.115) compared to year 2010 (Table 2).
 | Table 1. Descriptive statistics of number of cases among under 5 children in 2010 to 2014 |
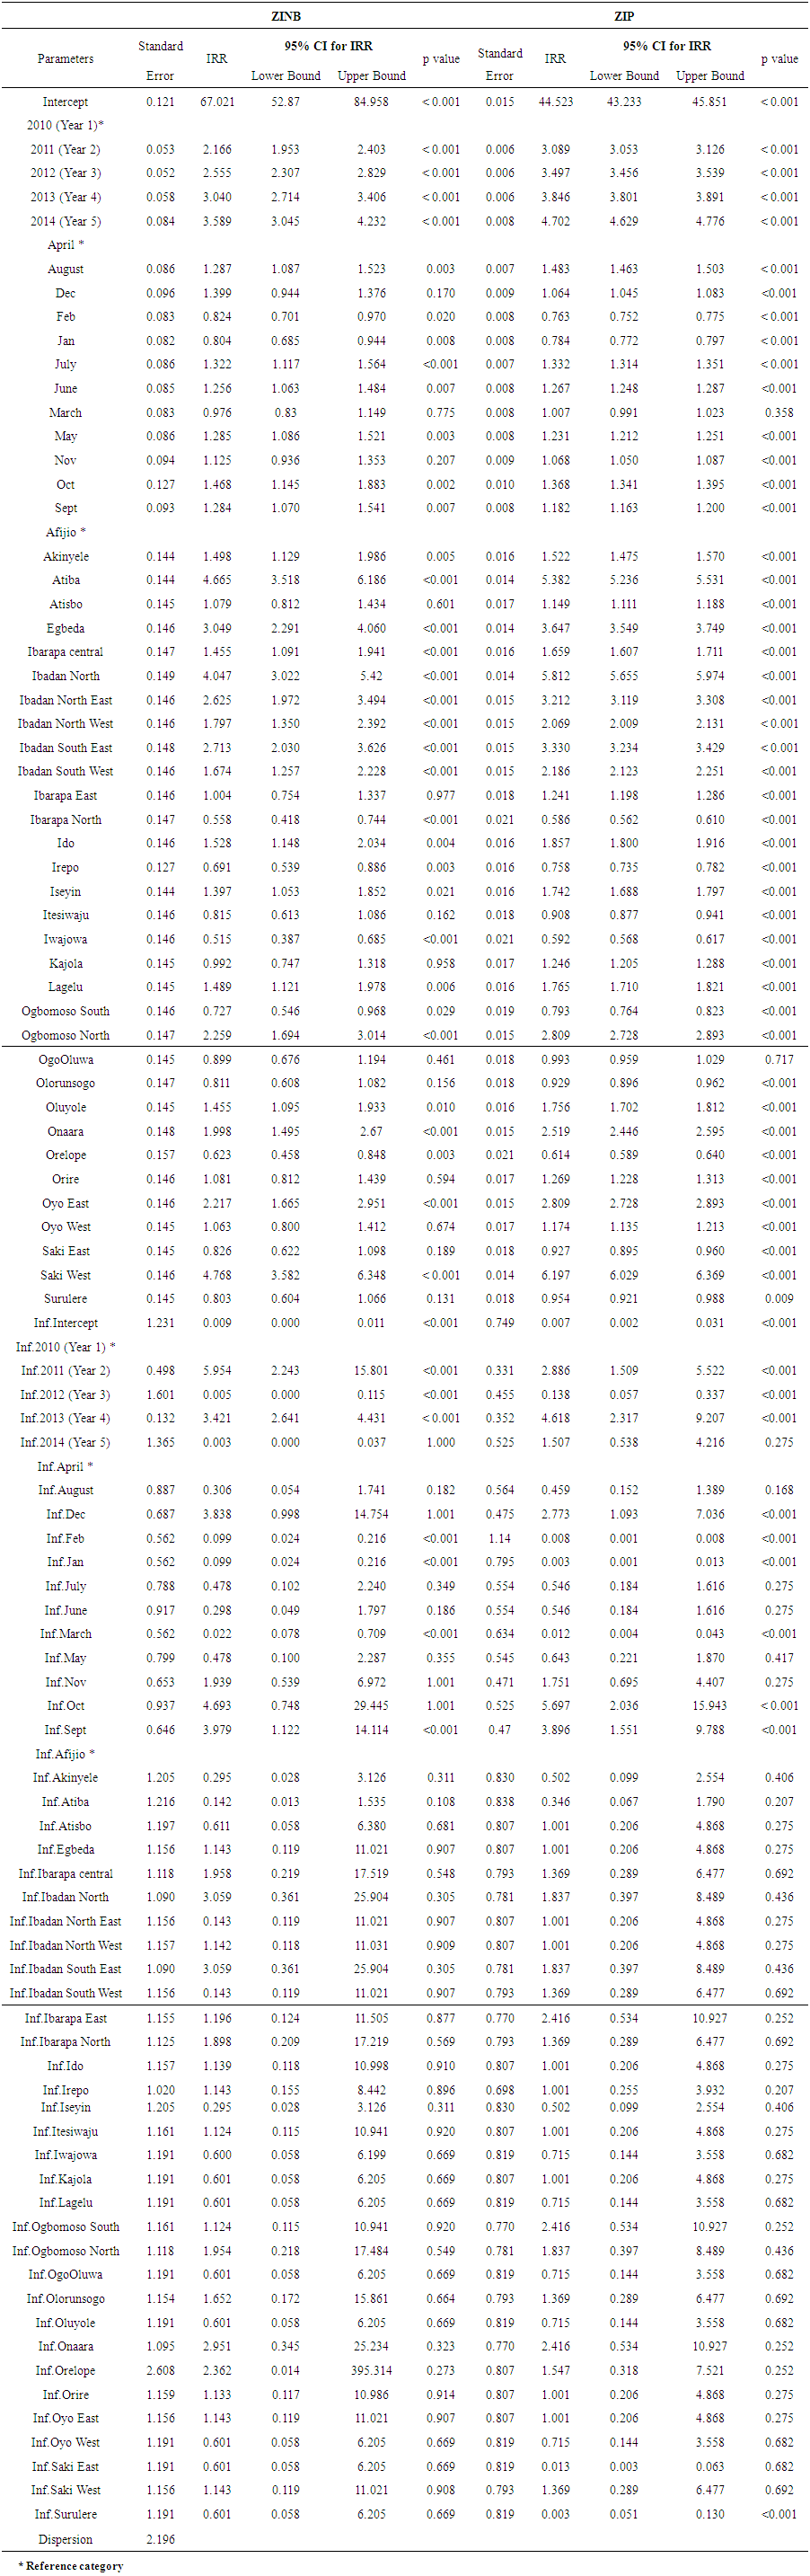 | Table 2. Parameter Estimates in the Zero Inflated Negative Binomial and Zero Inflated Poisson Regression Model for Malaria Among Under-5 Children |
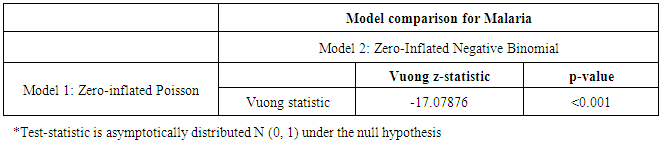 | Table 3. Comparison Tests for the Under-5 Malaria Models (ZIP nd ZINB) |
3.3. Comparison of ZINB and ZIP Regression Models
- The Vuong z-statistic of the ZINB and ZIP models was -17.07876; a large negative value less than -1.96 i.e. V < -1.96 indicating that the ZINB had better fit to the data than the ZIP model.
4. Discussion
- This study examined the performance of the ZINB regression and the ZIP regression models in the presence of over-dispersion. The malaria surveillance data showed excess zero cases and over-dispersion (the variance was greater than the mean). The result implies that the zero inflated negative binomial regression model (ZINB) will be preferred since it accommodates over-dispersion in the outcome data than the zero inflated Poisson regression model (ZIP) [4]. The finding is in line with a study by Ridout et al. (1998) who considered various ZIP regression models for an Apple shoot propagation data and concluded that the ZIP models were inadequate for the data as there was still evidence of over dispersion and then fitted zero-inflated negative binomial models to the data. The test criteria established that ZINB regression model was the best model to determine the effects of the season, year of reporting and geographical location on the number of cases of malaria among under-5 children. The finding agrees with a study conducted by Muniswamy et al who used Wald score and likelihood ratio tests to compare ZINB and ZIP models in the number of death notices [37].The incidence of malaria among under-5 children from 2010 - 2014 appears to have a fluctuating pattern. This pattern may be affected by level of reporting of new cases and the health-seeking behaviour of the caregivers of the affected children as well as inconsistencies in the use of malaria preventive strategies [29]. This pattern is similar to findings in a study conducted among symptomatic patients who sought medical attention in Minna and demonstrated that the mean annual malaria incidence rates were significantly different over a 4 year study period (2004 – 2007) with a drastic decline in malaria cases recorded from 2005 through 2007 [29]. In addition, Ukpong et al (2015) in Obudu cattle ranch, Nigeria, recorded varying incidence rates of malaria within the years of study. Finally, the pattern of malaria infection rate across space in Nigeria depends on dynamic processes involving climatic, environmental, physical and social variables operating differently in space [28].In the ZINB model, the incidence of malaria among under-5 children increased from year 2011 to 2014. The years under review had a significant effect on the occurrence of malaria among under-5 children. This finding is strongly supported by the study of [29] in Minna, Niger state, who demonstrated that the mean annual malaria incidence rates were strongly correlated with the amount of rainfall and relative humidity measured in the individual years of study. This influence of climatic change on the transmission pattern was also identified in another study in Cross River, Nigeria [30]. The increased incidences of malaria in the months of May, June, July, August, September and October have also been documented in another study in Benin City, Nigeria. Highest malaria incidences were reported in the months of May, July, August, September and October and lowest in the month of June [27]. The study attributed the observed increase in incidence of malaria to the height of the rainy season in Nigeria which lasts from May to October and additionally reported low incidence of disease in the dry season beginning from November to April.The LGAs were also found to be significant predictors of the occurrence of malaria among under-5 children. The increased incidences observed in some of the local government areas may be due to closeness to rural areas [38]. The effect of geographical location on the occurrence of malaria has also been reported in a study by Onwuemele, 2013. The rate of malaria infection across space depends on dynamic processes involving complex climatic, environmental, physical and social variables [28]. The highest incidence was found in Saki-West (an agricultural and relatively more rural community) while the lowest incidence was observed in Ogbomoso South. This is in line with the findings of Kalu and Oladeinde who highlighted higher transmission rates of malaria in rural than urban environments [39], [40].The certain zero group predicts the odds of a case of malaria among under-5 children, it predicts the likelihood of being in the “always 0” group. The year of reporting, month and the local government areas were found to be predictors for non-cases of malaria. The non-cases of malaria in the month may be due to the onset of dry season with reduced malaria transmission. This finding is in line with a study by [27] who documented that in the dry season, malaria transmission and infection are relatively low between November to April. The non-cases in the years may be explained by the Roll Back Malaria initiative programmes to combat the disease among under-5 children which was implemented in 2011 to correct low access to ACTs and to prevent the development of resistance to artemisinin based therapies. Also the distribution of Insecticide treated nets (ITNs) in 2013 may have influenced the non-cases among under-5 children [19].
5. Conclusions
- There was an overall increase in the incidence of malaria over the five year study period. Although there was an initial reduction in the incidence of malaria for the year 2012, subsequent years showed a sustained increase in incidence. The year of reporting and month were predictors of the occurrence of the disease. The study suggests that the Roll Back Malaria initiative should be intensified in the rural areas particularly where the risk was highest. Our findings showed that the zero inflated negative binomial regression is the best model to determine the factors that predict the number of cases of malaria, when there is an indication of over dispersion and excess zeros. In addition, researchers dealing with count data having excess zeros and over-dispersion should consider zero inflated negative binomial regression model.