-
Paper Information
- Paper Submission
-
Journal Information
- About This Journal
- Editorial Board
- Current Issue
- Archive
- Author Guidelines
- Contact Us
International Journal of Statistics and Applications
p-ISSN: 2168-5193 e-ISSN: 2168-5215
2016; 6(3): 177-187
doi:10.5923/j.statistics.20160603.11

An Alternative Modified Item Count Technique in Sampling Survey
 Abstract
 Reference
 Full-Text PDF
 Full-text HTML
Farid Ibrahim
Department of Statistics, Benha University, Egypt
Correspondence to: Farid Ibrahim , Department of Statistics, Benha University, Egypt.
| Email: |  |
Copyright © 2016 Scientific & Academic Publishing. All Rights Reserved.
This work is licensed under the Creative Commons Attribution International License (CC BY).
http://creativecommons.org/licenses/by/4.0/

In this study we have proposed an alternative modification to the usual item count technique (ITC) to estimate the proportion of a sensitive characteristic in some of the fields such as health care. This technique produces two estimators to estimate the proportion. The first proposed estimator has been proven to be more efficient than the second one. Efficiency comparisons of the first proposed estimator with the estimator of Doitcour et al.’s (1991) ICT, and with the estimator of Hussain et al.’s (2012) ICT are performed. It is found that the first proposed estimator uniformly performs better than the other estimators. The optimal sample size n, in the case of minimizing the variance of the estimator, assuming that the cost of conducting the survey is fixed, will be determined.
Keywords: Health surveys, Randomized response, Item count technique, Lagrange multipliers, Relative efficiency, Minimal variance
Cite this paper: Farid Ibrahim , An Alternative Modified Item Count Technique in Sampling Survey, International Journal of Statistics and Applications, Vol. 6 No. 3, 2016, pp. 177-187. doi: 10.5923/j.statistics.20160603.11.
Article Outline
1. Introduction
- In sampling surveys, it is easily conceivable that many respondents may not give truthful answers to direct questions on illegal behaviors such as habitual gambling, shoplifting, induced abortion, tax evasion, addiction to drugs, rash driving, history of past involvement in crimes, embarrassing or socially undesirable opinions and prejudices, … , etc. Measurement error in answers to previous sensitive topics may be reduced by some choices in survey design, such as open-ended questions, asking about behavior over long reference periods, tolerantly loaded introductions, and self-administration of the sensitive questions (see Tourangeau and Yan (2007)). An ingenious alternative approach to direct questioning is the randomized response technique (RRT) that was introduced by Warner (1965). In RRT the respondents employ a randomizing device to add probabilistic misclassification to their responses and conceal their true answers from the interviewer. Then several RR models have been proposed in the last decades as a valuable way for performing surveys on these sensitive topics. For details one can refer to Greenberg et al. (1969), Moors (1971), Mangat (1994), Mangat et al. (1997), Saha (2007), Singh and Tarray (2013), Barabesi et al. (2014), Adebola and Johnson (2015), and Blair et al. (2015). Chaudhuri and Christofides (2007) gave a criticism on the randomized response technique in the sense that it demands the respondent’s skill of handling the device and also asks respondents to report the information which may be useless or tricky. A clever respondent may also think that her/his reported response can be traced back to her/his actual status if she/he does not understand the mathematical logic behind the randomization device. Some of the alternatives to the randomized response technique are the Item Count Technique (ICT), the Nominative Technique and the Three Card Method. Details can be found in Droitcour et al. (1991), Droitcour and Larson (2002) and Miller (1985) respectively. These alternatives are designed because, in general, respondent evade sensitive questions especially regarding personal issues, socially deviant behaviors or illegal acts. Chaudhuri and Christofides (2007) also added that in these three alternatives to RRT respondents know that what they are revealing about themselves and that they do not need to know about any special estimation technique. Also respondents provide answers which make sense to them.ICT has an impression, mainly, on sensitive fields such as health care. This Technique consists of selecting two independent samples (control and treatment groups). Each respondent in the control sample is presented with a list of innocuous items (control items), say
 with possible answers of “Yes” or “No” and is asked to report the total number of items that are applicable to her/him. Each respondent in the treatment sample, from the same population, is provided with the same list to which one sensitive item is added and is requested to report the total number of items that are applicable to her/him. The respondents are randomly assigned to either the control group or treatment group. Compared ICT to the classical RRT, the ICT has the advantage of avoiding the potentially distracting act of randomization by the respondents themselves during the interview. Potential disadvantages of the ICT are that only the treatment group provides any information about the item of interest, and that the inclusion of the control items complicates the survey design and adds uncertainty to the estimation (see Kuha and Jackson (2014)).Dalton et al. (1994) named ICT as the unmatched count technique and applied it to study the illicit behaviors of the auctioneers and compared to direct questioning they obtained higher estimates of six stigmatized items. Wimbush and Dalton (1997) applied this technique in estimating the employee theft rate in high-theft exposure business and found higher theft rates. Tsuchiya (2005) proposed two new methods, referred to as the cross-based method and the double cross-based method, by which proportions in subgroups or domains are estimated based on the data obtained via the item count technique. In order to assess the precision of the proposed methods, Tsuchiya conducted simulation experiments using data obtained from a survey of the Japanese national character. The results illustrated that the double cross-based method is much more accurate than the traditional stratified method, and is less likely to produce illogical estimates. Tsuchiya et al. (2007) conducted an experimental web survey in an attempt to compare the direct questioning technique and the ICT. Compared with the direct questioning technique, the ICT yielded higher estimates of the proportion of shoplifters by nearly 10 percentage points, whereas the difference between the estimates using these two techniques was mostly insignificant with respect to innocuous blood donation. Imai (2011) proposed new nonlinear least squares and maximum likelihood estimators for efficient multivariate regression analysis with the ICT.Kuha and Jackson (2014) analyzed item count survey data on the illegal behavior of buying stolen goods. The analysis of an item count question was best formulated as an instance of modeling incomplete categorical data. They proposed an efficient implementation of the estimation which also provides explicit variance estimates for the parameters. Walter and Laier (2014) compared the methodological pros and cons of ICT to direct questioning (DQ). They presented findings from a face-to-face survey of 552 respondents who had all been previously convicted under criminal law prior to the survey. The results showed, first, that subjective measures of survey quality such as trust in anonymity or willingness to respond were not affected positively by ICT with the exception that interviewers feel less uncomfortable asking sensitive questions in ICT format than in DQ format. Second, all prevalence estimates of self-reported delinquent behaviors were significantly higher in ICT than in DQ format. Third, a regression model on determinants of response behavior indicated that the effect of ICT on response validity varies by gender. Overall, their results were in support of ICT. Hussain and Shabbir (2010) and Hussain et al. (2012) proposed two modifications to the usual ICT that was proposed by Droitcour et al. (1991), and they showed that their estimators are always more efficient than the estimator of the usual ICT.Since the two main problems of the randomized response models and their alternative techniques are the respondent’s privacy and the efficiency of the estimators of these models, so in this paper we have proposed an alternative modification to the usual ICT that produces two estimators of the parameter of the item count model, and their properties are studied. The first proposed estimator, which has been proven to be more efficient than the second one, is more efficient than the estimators of the other models of ICT. Also this alternative modification provides full protection to the respondent’s privacy. So the remainder of the present research is organized as follows; Section 2 presents the usual ICT that was proposed by Droitcour et al. (1991) and Hussain et al.’s (2012) modification of the usual ICT. An alternative modification of the usual ICT, and the two estimators of the parameter of the model of ICT and their properties are presented in Section 3. The relative efficiency, of the two proposed estimators, is performed in section 4. Efficiency comparisons of the first proposed estimator, that has more efficiency compared to the other one, with the estimator of Droitcour et al.’s (1991) ICT and the estimator of Hussain et al.’s (2012) ICT are performed in section 5. The optimal sample size n, in the case of minimizing the variance of the estimator, assuming that the cost of conducting the survey is fixed, is determined in Section 6. Section 7 is devoted for conclusions and discussions.
2. The Usual ICT and Its Modification
- This section presents the usual ICT which was proposed by Droitcour et al. (1991) and its modification was proposed by Hussain et al. (2012).
2.1. The Usual ICT
- The usual ICT was introduced by Droitcour et al. (1991). It consists of selecting two independent samples of sizes
 and
and  The
The  th respondent in the first sample is given a list of
  innocuous items and asked to report the total number, say
  of items that are applicable to her/him. Similarly, the
  th respondent in the second sample is provided another list of
  items including the sensitive item and asked to report a total number, say
  of the items that are applicable to her/him. The
  innocuous items may or may not be the same in both the samples. Unbiased estimator of proportion of the sensitive item in the population is given by
 | (2.1) |
 | (2.2) |
2.2. A Modification of ICT
- This modification was suggested by Hussain et al. (2012). Each respondent in a sample of size
 is provided a questionnaire (list of questions) consisting of
  questions. The
  th question consists of queries about an unrelated item
  and a sensitive characteristic
  The respondent is requested to count 1 if she/he possesses at least one of the characteristics
  or
or  otherwise, count zero, as a response to the
  th question, and to report the total count based on entire questionnaire. And they assumed that
  denote the total count of the
  th respondent, and then mathematically they wrote it as
 | (2.3) |
 takes the values 1 and zero with probabilities
  and
and  respectively.
 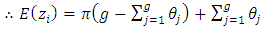 | (2.4) |
 as
as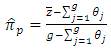 | (2.5) |
 | (2.6) |
3. The Proposed Alternative Modification of the Usual ICT
- Let a random sample of size
 be selected using simple random sampling with replacement (SRSWR). The
  th respondent is provided a list consists of
  items that including
  innocuous items and one sensitive item and asked to:- Firstly; count a number, say
  of the items that are applicable to her/him based on the entire list.- Secondly; report how far away the produced number
  is from
  if she/he has the sensitive item, or report the produced number
  if she/he doesn’t have it. It is to be mentioned that this idea is due to Christofides (2003).The survey procedures are performed under the assumptions that the sensitive and innocuous items are unrelated and independent. The
  items are arranged randomly in the list. This technique improves the privacy protection of the respondents.
3.1. The First Proposed Estimator
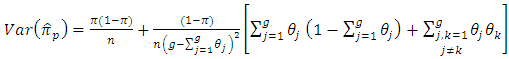
- Let
 the true proportion of the population with the sensitive item.
 the true proportion of the population without the sensitive item. Since the
  th item may be innocuous or sensitive item, and
  be the total number produced by the
  th respondent using the ICT.
 can be written as follows
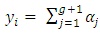 | (3.1) |
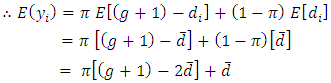
 Then, the expected value of
  can be written as
  | (3.2) |
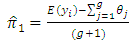 | (3.3) |
 is
is
 is an unbiased estimator of
  Also,
Also,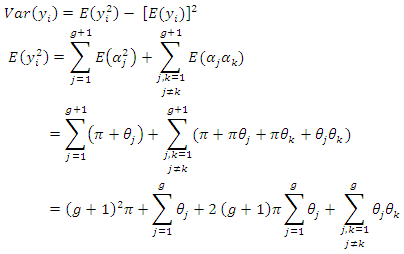
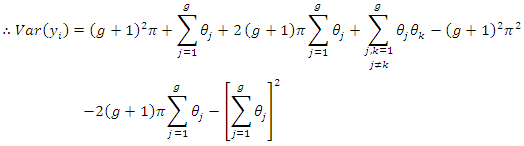
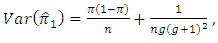
 | (3.4) |
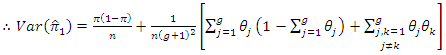 | (3.5) |
3.2. The Second Proposed Estimator
- Let
 the total number reported by the
  th respondent in the sampleand
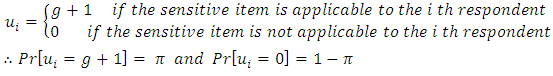 and
and | (3.6) |
 the probability that the produced total number by the
  th respondent is
 the probability that the produced total number by the
  th respondent is
 the proportion of the respondents that report
  For the
  th respondent
 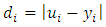 and similarly
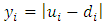
 | (3.7) |
 | (3.8) |
 is
is
 is an unbiased estimator of
  Also
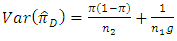
Also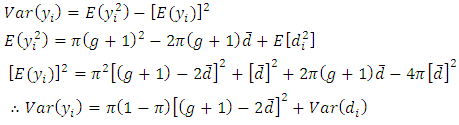 | (3.9) |
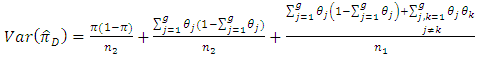
 | (3.10) |
 | (3.11) |
 | (3.12) |
 is the proportion of the respondents that report
  in the sample. From equations, of
  (3 - 2) and (3 - 7) we find
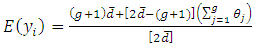 | (3.13) |
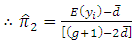
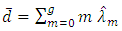
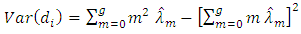
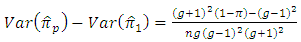
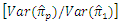
4. The Relative Efficiency of the Proposed Estimators of 
- In this section we present efficiency comparison of the proposed estimator
 with the proposed estimator
  From equations (3 - 5) and (3 - 10), the relative efficiency of the two unbiased estimators
  and
and  is
is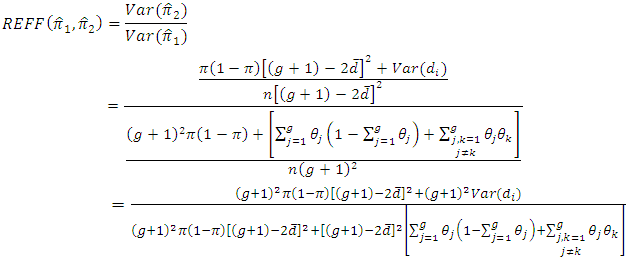 | (4.1) |
 all are less than a positive real number
  and there are
  positive weights
  such that
  then
then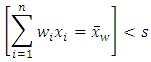 The Prove:

 Which is always true for all values of
  and
and  and
and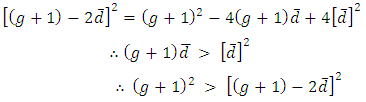 | (4.2) |
 and
and  Also, from equation (3 - 9) we find
 | (4.3) |
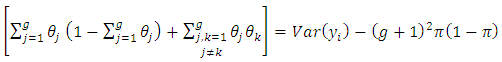 | (4.4) |
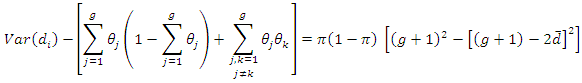 According to equation (4 - 2)
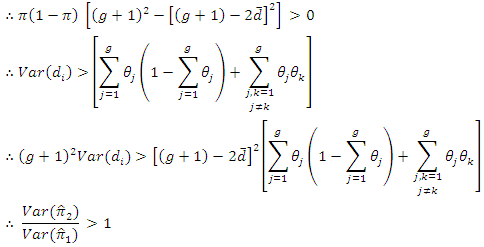
 has smaller variance than
  is less efficient than
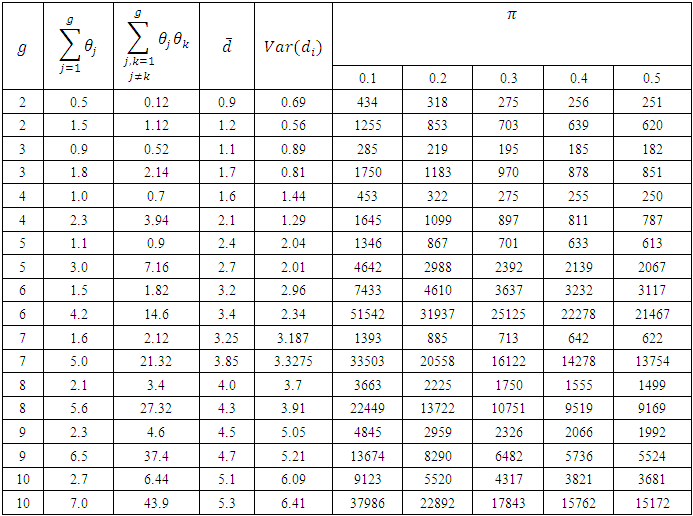
  We have calculated
  and the relative efficiency of the proposed estimator
  relative to the proposed estimator
  for
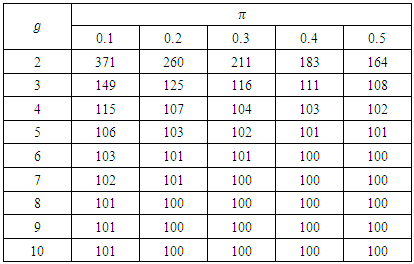
for 
 and for
  and
and  at each value of
  The results are provided in Table (1) in Appendix. From table (1) it is indicated that;- The proposed estimator
  is more efficient than the proposed estimator
  - The sample size
  does not have significant effect on the relative efficiency of the two proposed estimators.
 5. Efficiency Comparisons
- In this section we present efficiency comparisons of the estimator
 of the proposed ICT with the estimator
  of the usual ICT and with the estimator
  of Hussain et al.’s ICT.
 5.1. Proposed Estimator  Versus the Estimator
- We compare the relative efficiency of the proposed estimator
 with the estimator
  in both cases of having and not having unequal
  In the case of having unequal
  the proposed estimator
  would be more efficient than the estimator
  if
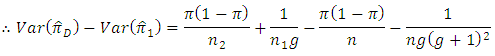
if From equations (2 – 2) and (3 – 5), we have
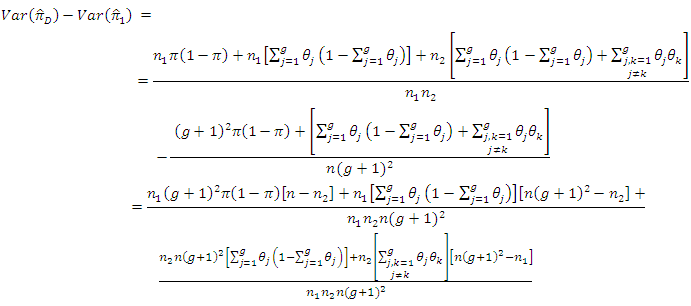 | (5.1) |
 and
and  which are always true for all values of


 Moreover, in the case of having
  (which is difficult/impossible case), we find
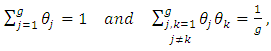 | (5.2) |
 | (5.3) |
 | (5.4) |
 since
since and
and 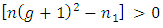 which is always true for all values of
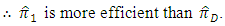
  Then
Then

 is more efficient than
5.2. Proposed Estimator  Versus the Estimator
- We compare the relative efficiency of the proposed estimator
 with the estimator
  in both cases of having and not having unequal
  In the case of having unequal
  the proposed estimator
  would be more efficient than the estimator
  if
if From equations (2 - 6) and (3 – 5) we find,
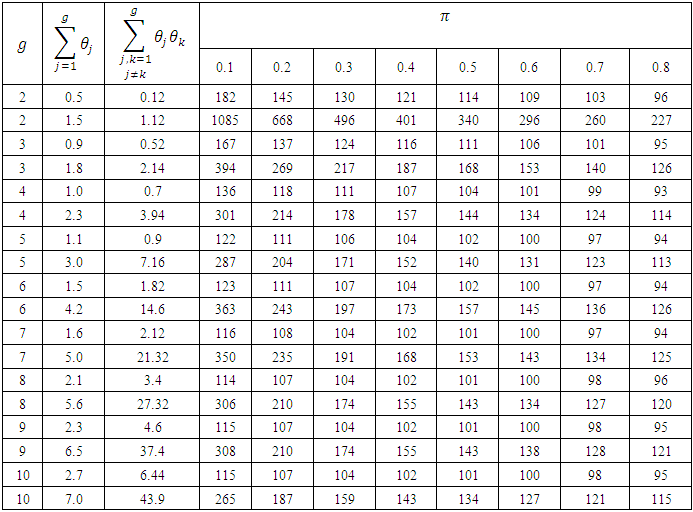
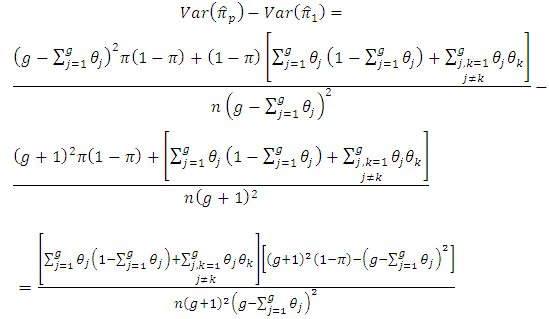 | (5.5) |
 relative to the estimator
  for
for 


 and for
  and
and  at each value of
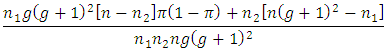
  The results are arranged in table (2).Moreover, in the case of having
 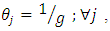 (which is difficult/impossible case), we find,
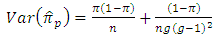 | (5.6) |
 | (5.7) |
 relative to the estimator
  in the case of having
 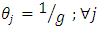 for
for 
 and for
  and
and  at each value of
  The results are arranged in table (3).From tables (2) and (3), it is indicated that;- For
  the proposed estimator
  is more efficient than the estimator
  for all values of
  - For
- For  the proposed estimator
  is less efficient than the estimator
  for all values of
  - For
- For  the proposed estimator
  is more efficient than the estimator
  for all values of
  - The sample size
  does not have significant effect on the relative efficiency of the proposed estimator
  relative to
  - In the case of having
 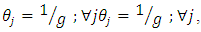 the relative efficiency of the two estimators
  and
and  is approximately equivalent for all values of
  and
and 
6. The Optimal Sample Size 
- In the sampling surveys it is necessarily to find the values of n, so that the variance of the estimator is minimum under fixed cost, or the cost is minimized under assumption that the variance of the estimator is predetermined (see Christofides (2005)). Consider the case of minimizing the variance of the estimator assuming that the cost of conducting the survey is fixed. Suppose that we have the following linear cost functions
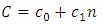 | (6.1) |
 the general (fixed) cost of the survey,
 the cost of interviewing an individual in the sample,
  the total cost of the survey.Then we want to find the optimal values of
  which minimize the variance of
  subject to a fixed cost. Thus, we have the following optimization problem
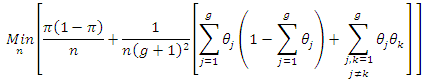 subject to
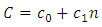 | (6.2) |
 where
where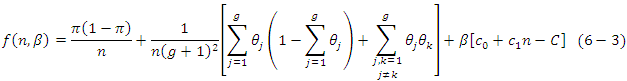 Taking partial derivatives, we find
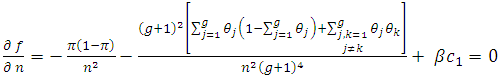 | (6.4) |
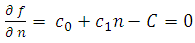 | (6.5) |
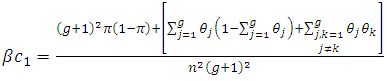 | (6.6) |
 | (6.7) |
 | (6.8) |
 as follows;
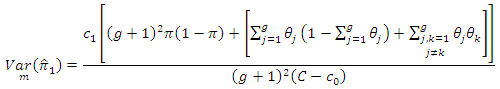
7. Conclusions and Discussions
- The aim of this article was to provide an alternative modification of the usual ICT to estimate the proportion of a sensitive characteristic in some of the fields such as health care. The main features of this alternative modification are that, first of all it does not need to select two subsamples of sizes
 and
and  Therefore, we do not require to worry about the optimal values
  and
and  as is the usual ICT estimator
  Secondly the first estimator of this alternative modification has been proven to be more efficient than the estimators of the other ICT techniques. Thirdly this technique provides full protection to the respondent’s privacy since the reported number by the respondent may differ from the produced number and each reported number falls in the range
  and means that the respondent may have or may not have the sensitive item. This technique produced two estimators to estimate the proportion. We proved that the first proposed estimator to be more efficient than the second one. Also we proved that the first proposed estimator of the proposed item count technique is more efficient than the estimator of the usual ICT
  Also, it has been observed that the first proposed estimator performs better than the estimator
  of Hussain et al.’s (2012) ICT when
  (which is the logical event). We determined the optimal sample size n, in the case of minimizing the variance of the estimator, assuming that the cost of conducting the survey is fixed. In summary, based on the findings of Sections 4 and 5, and the concluding discussion above we recommend the use of the proposed ICT with the first proposed estimator in surveys about sensitive items instead of the usual ICT and Hussain et al.’s item count technique.
ACKNOWLEDGMENTS
- The author is especially appreciative for Dr. Tasos, C., Chistofides of Cyprus University, Nicosia, Cyprus. Dr. Zawar Hussain of Faculty of Sciences, King Abdul-Aziz University, Jeddah, Kingdom of Sudia Arabia. Dr. Ejaz Ali Shah and Dr. Javid Shabbir of Quaid-I-Azam University, Islamabad, Pakistan.Also, the author is grateful to the Editor-in-Chief and to the learned referee for their valuable suggestions regarding improvement of the paper.
 in the case of not having
 in the case of having