-
Paper Information
- Next Paper
- Previous Paper
- Paper Submission
-
Journal Information
- About This Journal
- Editorial Board
- Current Issue
- Archive
- Author Guidelines
- Contact Us
International Journal of Statistics and Applications
p-ISSN: 2168-5193 e-ISSN: 2168-5215
2016; 6(3): 163-167
doi:10.5923/j.statistics.20160603.09

A Probability Model for Measuring Fecundability of Migrant and Non-Migrant Couples
 Abstract
 Reference
 Full-Text PDF
 Full-text HTML
C. B. Gupta1, Sachin Kumar1, Brijesh P. Singh2
1Department of Mathematics, Birla Institute of Technology and Science Pilani, Pilani Campus, India
2Faculty of Commerce & DST-CIMS, Banaras Hindu University, Varanasi, India
Correspondence to: Sachin Kumar, Department of Mathematics, Birla Institute of Technology and Science Pilani, Pilani Campus, India.
| Email: |  |
Copyright © 2016 Scientific & Academic Publishing. All Rights Reserved.
This work is licensed under the Creative Commons Attribution International License (CC BY).
http://creativecommons.org/licenses/by/4.0/

In this paper, an attempt has been made to develop a new probability model for measuring fecundability under some assumptions. This model has been applied in measuring the fecundability of migrant and non-migrant couples of western Uttar Pradesh which is untouched so far. Parameters of the model have been estimated by the method of moments. The level of fecundability of migrant couple has been found to be larger than non-migrant couple of the region. We have tried to find some possible explanation for this difference.
Keywords: Contraception, Fecundability, Migrant, Married, Ovulation etc
Cite this paper: C. B. Gupta, Sachin Kumar, Brijesh P. Singh, A Probability Model for Measuring Fecundability of Migrant and Non-Migrant Couples, International Journal of Statistics and Applications, Vol. 6 No. 3, 2016, pp. 163-167. doi: 10.5923/j.statistics.20160603.09.
Article Outline
1. Introduction
- Fecundability is a biological capacity to bear a conception and defined as the probability of conception during a lunar month by a biologically fit couple having unprotected cohabitation provided the female has not conceived in the immediate previous cycle ([7], [16]). Fecundability is different from the fecundity in the sense that latter refers to the natural capacity to produce offspring. Only the human fecundability is studied in demography, which depends on several behavioural and biological traits of a female. The importance of the fecundability study lies in the fact that it is one of the most prominent determinants of fertility rates. Since, there exists an inverse relationship between the mean fecundability and mean waiting time to conception, fecundability influences the completed fertility of a female through its relation to mean time to conception in a heterogeneous population ([19]). Therefore, the fecundability can be considered as playing the same role in fertility studies as Mendellian transition theory in population genetics.In practice, fecundability is estimated for those females, who have a regular ovulation pattern. Non-ovulating, sterile, pregnant or postpartum females are automatically excluded from the study. Fecundability includes all form of conception, without giving regard to the outcome. It is composed of two components (a) recognizable fecundability (b) effective fecundability. Effective fecundability refers to only those conceptions which results in a live birth ([4], [9]). All throughout this study, fecundability stands for the effective fecundability.During the past few decades five different methods have been developed to estimate the fecundability of a population ([4]) which are as follows:(i). Estimating the proportion of women conceiving during a one month period ([2], [3], [7], [9], [15]).(ii). Calculating fecundability from coital frequency and the duration of viability of sperm and ovum ([8], [14], [24]).(iii). By fitting models to the distribution of waiting time to conception ([10], [11], [18], [19]).(iv). Fitting models to birth interval distribution ([6], [23]).(v). Fitting models to the distribution of number of births within a specific period of time by a group of females ([5], [12], [21], [22].The number of births by a female during a specified period has motivated the demographers to study and develop the model which can successfully explain the event during the last four decades. But in all these models, researchers have assumed parameter homogeneous over time and due to this fact these models can be applied on the number of births for the shorter duration of time. But due to increasing age at marriage and continued reducing total fertility rate (TFR), such models have gained importance in recent past. Historically, the estimates of mean fecundability have been very inconsistent, varying from 0.05 to almost 1 ([4]). This wide variation in the estimates of fecundability might be attributed to the difference in conception rates of different population due to geographical, behavioural, economic and cultural reasons.The main objective of this paper is to develop a new method of estimating the mean fecundability and then to compare the mean fecundability of migrant and non-migrant couple to investigate the fertility behaviour of two different kind of population. In developing countries, particularly, India, rural-urban migration has played an important role in determining the socio-economic and cultural behaviour of the people residing in rural areas, which may have an important bearing on the fertility behaviour of the population. Actually in rural areas, males migrate singly to the cities leaving their wife and children behind in the villages and visit them frequently at regular interval of time. Thus, the females of such migrated males have less exposure time to the risk of conception and hence the fertility performance of such females is affected. In the wake of all these factors, it has become pertinent to demographers, social scientist and Biostatistician to conduct a detailed study of migration and fertility.
2. Model
2.1. Assumptions
- (a). Let X, number of conceptions of a couple during a time interval (0, T), be a random variable which follow a Poisson distribution i.e;
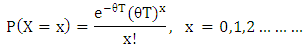 In the absence of any clinching evidence on the distribution of number of conceptions, we have assumed that it follows Poisson distribution, because of its ability as a count distribution and wide variability. θ is called as the mean fecundability per cycle.(b). After each conception, there is a rest period of h time unit, in which no further conception is possible. The rest period is defined as the duration of time from one conception to the start of next menstrual cycle. For any given female, the change in h is almost negligible, so, h is considered as the constant during (0, T).(c). θ varies among couples as per Beta distribution.(d). There are two kind of females during (0, T), one is exposed to the risk of conception or she is not exposed to this risk. Let 1-α and α be the respective proportion of such females. The first group consists of either the sterile female or those who wish not to conceive during (0, T). In sterile females, conception is not possible due to biological and medical complications. A sterile couple is not able to conceive, while the couples belonging to the second group may have zero, one, two or more conceptions during the time interval (0, T). Under the above assumptions the model is developed as follows:
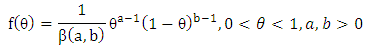 where
where 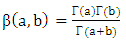 and the conditional distribution of number of conception X is given by:
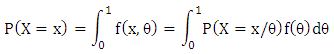 Therefore, X, the number of conceptions, will be represented by:
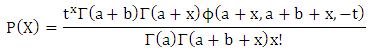 where x=0, 1, 2….., and a, b>0 ……………... ……..(i)and
 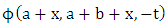 is the confluent hypergeometric function defined by [1] as follows:
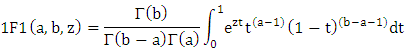 which can be represented in hypergeometric series form as:
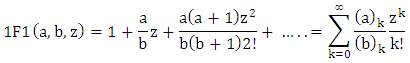 The factorial moments of X will be:
 The mean E(X) and variance V(X) are given by:
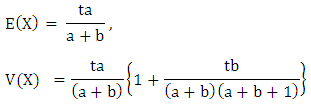 Now, by assumption (d), (i) is modified as follows;
 and
and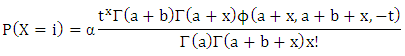 where i=1,2…, 0<α<1 ……………………... ……(iii b)The mean and variance for the above model defined by iii (a & b) are respectively:
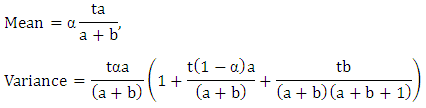
2.2. Estimation of Parameters
- With the help of (ii), we get the following three moments:
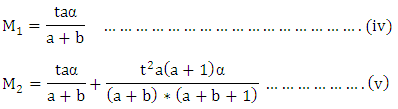 and
and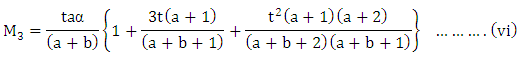 By solving (iv), (v) and (vi), we get the values of α, a, and b.
2.3. Justification of the Model
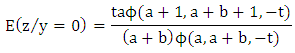
- Let (y, z) be the number of births by the same female in the successive period of length t. We assume that for each female
 remains the same in the second period as it was in the first, now applying Bayes’ theorem;
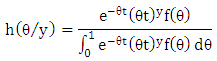 Hence
Hence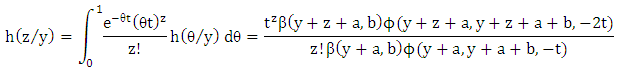 and
and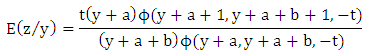
 i.e. the mean fecundability in the second period is reduced by the factor
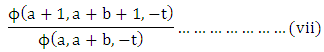 which is less than unity and this can be verified by applying the first theorem of [13] in numerator as well as in denominator. This fact justifies the suitability of Poisson-Beta distribution for estimating the fecundability of females. We can observe this numerically in the table 1.
|
3. Description of Data
- The data used in the present study have been collected from the rural area of district Meerut (UP). There has been a rapid spurt of industrial development in and around the city during the past decades and it has become a major hub for various economic, cultural, educational and developmental activities over the years. The baseline survey of nearly 3600 households was undertaken to get the reliable and relevant data pertaining to the problem under study. Following the guidelines from [20], data were collected from three types of villages through a stratified clustered sampling method. These three types of village have been identified as semi-urban, remote and growth centres. The villages from district Meerut are divided into two groups as per their distance from the boundary of Meerut Nagar Nigam, to constitute two strata. The first stratums consists of the villages less than 8 km. of distance, and are termed as semi-urban villages, while the rest are called as remote villages and belonged to second stratum. For the selection of growth centres, villages, which are located nearby industrial areas and sugar mills, are taken into consideration.
|
4. Application of the Model
- Actually, we do not have data on the number of conceptions per couple, so, it is assumed that there is a one to one correspondence between the number of conceptions and the number of births. Therefore, this model can be viewed as a first approximation to the number of conceptions per couple. This model is successful for small duration of time T and homogeneous population. Because of all these limitations, we need to make some adjustment in the model. Only those females were considered for the study, who had been residing together for last five years from the reference date. First of all, we subtract 9 months from five years (60 months), which is the approximate interval from the conception to birth. Further, we assume that rest period is 10 months for five years. In case of migrated couples 10 more months are subtracted, as it is assumed that on an average husband is away from home for 2 months each year. In table 3, time is taken as the weighted arithmetic mean of both the population.
|
|
|
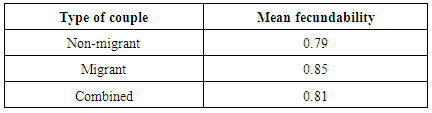
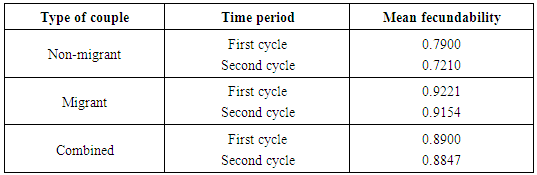
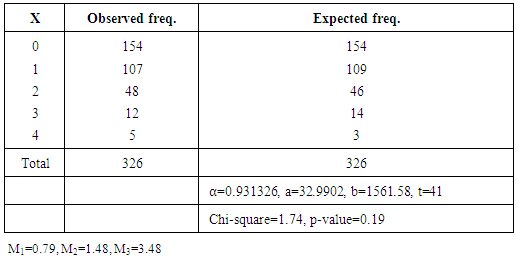
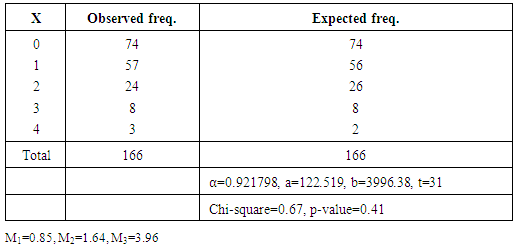
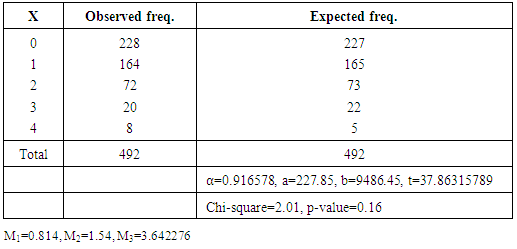
5. Discussion and Conclusions
- The observed and expected frequencies are shown in table 2, 3 and 4. It is evident from the p-value that the proposed new model fits the data satisfactorily. The estimates of proportion of couples falling in the second group are 0.9313,0.9218 and 0.9165 for non-migrant, migrant and combined couples respectively, which indicates that about 7, and 8 percentages females are either sterile or use some form of contraception. Table 5 displays the fecundability estimates of different kind of couples of the region under study. We can observe a clear difference between the fecundability of migrated and non-migrated couple. Migrated couple have the higher fecundability than their non-migrant counterparts, indicating the higher fertility in former. Naturally, when the husband is away from home for some time, then they ought to have high coition rate after meeting. While, in case of non-migrated couple coition rate is comparatively lower due to prevalence of many customs, taboos and festivals in this part of the region during early few years of marriage. Our findings are in agreement with the previous results ([25]). The proposed model is plagued by the limitation that it does not take into account the foetal wastage, intrauterine mortality and female foeticide. By considering these facts with suitable data, this model can further be extended to have a more in depth study of the fertility performance of the region. Still the present model is useful from the application point of view that it can be utilized at different age group to compare the fertility performance of females in different age segments. This study can be quite informative for the policy maker and health workers working in the family planning programme, as the study gives them a clear insight of high fertility group of the region and they can frame their policy accordingly. All these calculations were done with the help of R-3.2.2 version (R-Core team) on a Window 10 platform.
ACKNOWLEDGEMENTS
- One of the authors (Sachin Kumar) is highly indebted to UGC (BSR), who provided us with the financial assistance through their reference letter number F.7-293/2010(BSR) as dated on November 2013 for carrying out this work.