N. V. Chandrasekara1, C. D. Tilakaratne2, M. A. Mammadov3
1Department of Statistics & Computer Science, University of Kelaniya, Kelaniya, Sri Lanka
2Department of Statistics, University of Colombo, Colombo, Sri Lanka
3School of SITE, Federation University, Ballarat, Australia
Correspondence to: N. V. Chandrasekara, Department of Statistics & Computer Science, University of Kelaniya, Kelaniya, Sri Lanka.
| Email: |  |
Copyright © 2016 Scientific & Academic Publishing. All Rights Reserved.
This work is licensed under the Creative Commons Attribution International License (CC BY).
http://creativecommons.org/licenses/by/4.0/

Abstract
Stock market forecasting models attract many parties in the financial world as they provide vital information for making appropriate decisions. Financial indices play a major role in controlling dynamics of the recent financial world predictions. Many forecasting models including stock market forecasting models consider other financial indices as predictors. Return distributions of predictors of forecasting models exhibit immense interest nowadays. With reference to literature, it can be identified that the financial indices Oil, Gold and Cocoa are associated with stock indices. The objective of this study is to identifying the return distributions of three financial indices: Oil index, Gold index and Cocoa index. Five years daily data of Amex Oil index, Amex Gold index and World Cocoa index were considered for the study. The results obtained illustrate that the return distributions of all three financial indices deviates from the normal distribution, meanwhile the Scaled tdistribution can be recommended as the most suitable distribution to model these three return series.
Keywords:
Distribution, Oil index, Gold index, Cocoa index, Scaled tdistribution
Cite this paper: N. V. Chandrasekara, C. D. Tilakaratne, M. A. Mammadov, Return Distributions of Selected Financial Indices that Associated with Stock Indices, International Journal of Statistics and Applications, Vol. 6 No. 3, 2016, pp. 156-162. doi: 10.5923/j.statistics.20160603.08.
1. Introduction
Forecasting is a vital activity in the financial sector. Stock market predictions attract many researchers as they provide important information for many parties in the financial world. World’s major financial indices influence most of the financial sector predictions as they play a major role all over the world. Therefore, it is imperative to consider the influence from different financial indices when constructing models for stock market predictions.In 2012, Patel [1] investigated the effect of macroeconomic determinants on the performance of Indian stock market and found that the Oil price and Gold price are among the factors that influence the stock market indices. Another researcher [2] found that there is a co-integration between Oil price, Consumer price index, Exchange rate, Treasury bill rate and Ghananian stock market index by considering the Dow Jones Sustainability and Dow Jones Wilshire 5000 indices. Further, [3] found that the Oil price affect the US Dow Jones Sustainability index. Gilmore et al., in 2009 [4] examined the dynamic relationships between Gold prices (morning and afternoon fixing in London), stock price indices of gold mining companies (CBOE gold index and Amex gold bugs index) and broad stock market indices (S&P 500, S&P midcap 400 and S&P smallcap 600) and found an evidence for co-integration relationship between these variables. The research, carried out by [5], examined the relationships between the stock exchange prices and macroeconomic variables with particular attention of recent global financial crises in the context of USA, Japan and China stock indices and found that Oil index has significant relationship with considered stock indices. In 2012, Certi et al., [6] proved that the Cocoa index influence the stock market index in their study. Consequently, literature provides evidence for the influence from Oil index, Gold index and Cocoa index on stock market indices.Identifying the return distributions of influential factors used in financial forecasting models depicts great interest among researchers nowadays. A study [7] in 2009, suggested the normal distribution to model the return series of Oil index. However it is hard to accept that normal distribution suites for the return distribution of financial markets as they show fat tails. Another research [8] recommended that the Student's t distribution is appropriate as the return distribution of Gold index. Scaled t distribution is proposed as the most suitable distribution to model return series of stock indices by [9] and [10]. However no researches attempted to find the return distribution of Oil index and Cocoa index were found in the literature. Furthermore, very few research which attempted to find return distribution of Gold index were found. Identifying most suitable return distributions for the three financial indices: Oil, Gold and Cocoa which are related to world’s major stock indices, is the main objective of this study. Finding of the most suitable distributions to model Oil index, Gold index and Cocoa index will help many researches, in modelling world’s major stock indices and hence enhance the forecasting accuracy.The rest of the article is organized as follows: Section 2 describes the methodology of the study. The results obtained and discussions are provided in the next section. Section 4 consists of conclusions of the study.
2. Methodology
Data used for the study, data pre-processing, theory of correlation calculation and theory used for distribution identification describes in this section.
2.1. Data Collection and Data Pre-Processing
Three financial indices: Oil index, Gold index and Cocoa index were considered for the study. The study period covers five years daily data of Amex Oil index, Amex Gold index and World Cocoa index from 1st August 2007 to 31st July 2012 which consist of 1261 observations for each of the three indices.Daily returns of each series were calculated using following formula: | (1) |
where Rt- return of the day t, Pt - closed price of the day t and Pt-1 - closed price of the day t-1.
2.2. Identifying Correlations
Even though literature provide evidence for association between Oil index, Gold index and Cocoa index with world’s major stock indices, correlation analysis was carried out to confirm those associations. One highly volatile market (an US Market), stable market (Australian market) and emerging market (Sri Lankan market) were considered to verify the relationships with three financial indices under the study. Daily data of GSPC index of USA stock market, AORD index of Australian stock market and ASPI index of Sri Lankan stock market for the same time period were used for the correlation analysis. Specifically the data sets consist with daily data from 1st August 2007 to 31st July 2012 and have 1261 observations in each series. Correlations between return series at day t-1 of Oil, Gold and Cocoa indices with return series at day t of GSPC, AORD and ASPI were studied as the current day values of stock market indices have influence from previous day value of financial indices.Since financial indices exhibit non-linear correlations in nature, Spearman's cross correlations (rs) were calculated using Equation 2 to find the significant correlations. Fisher’s r to z transformation for Spearman’s correlation [11, 12] was used to calculate pertinent lower and upper confidence levels.  | (2) |
where k-lag and n-number of observations.
2.3. Identifying Return Distributions
The distributions of return series of three indices were tested for normal distribution and Scaled t distribution. Probability-Probability plots (p-p plots) were used to evaluate the adequacy of fitted distributions for the return series of each financial index. As it is better to assess the adequacy using two techniques, cumulative plots were employed to confirm the suitability of fitted distributions.1) Normal DistributionThe normal distribution or the Gaussian distribution is an important and popular distribution which can be used to model many natural phenomena. This continuous distribution is a symmetric bell shaped curve and the probability density function is given by following formula: | (3) |
where μ is the mean or expectation of the distribution and σ is the standard deviation [13].2) Scaled t DistributionThe Scaled t distribution has three parameters location parameter, scale parameter and shape parameter. This distribution is useful for modeling data distributions with fat tails. Smaller values of the shape parameter yield fat tails. The probability density function of the Scaled t distribution is given in Equation 4.  | (4) |
where Γ(•) symbolize the gamma function, µ is the location parameter, σ is the scale parameter and  is the shape parameter where
  and
and  [9].3) Probability-Probability plots (p-p plots)Probability-Probability plot is a probability plot that can be used to assess how closely two data sets agree to each other. p-p plots are most often used to assess the shape of a distribution of data. The cumulative percentage of the distribution (empirical distribution) against the cumulative percentages of a reference distribution (theoretical distribution) displays in a p-p plot [14].4) Cumulative plotsAn empirical cumulative distribution function (cdf) shows the proportion of data less than or equals to each x value, as a function of x and the plot of cumulative distribution function (Cumulative plot) can be used to examine the distribution of a sample of data. The theoretical cdf can overlay on the same plot to compare the empirical distribution of the sample to the theoretical distribution [15].5) Random Walk ModelFinancial time series including stock prices are often considered as total or "near-to" total random walk. Definition of the random walk process is as follows:
 | (5) |
where yt - value at time t, yt-1 - value at time t-1 and zt - value of the error tern at time t.In Equation (5), the term z is called as the error term which follow a white noise series with zero mean and constant variance. In addition, the first difference of the original series represent the error terms [16-18].
3. Results and Discussion
This section describes results obtained from the study along with a discussion.
3.1. Correlation Analysis
Spearman's cross correlations along with their lower and upper confidence levels (LCL and UCL) were calculated for the three financial indices under the study: Oil index, Gold index and Cocoa index with considered three stock market indices. Table 1 displays results. The hypothesis H0: rs = 0 vs. H1: rs ≠ 0 was used to find the significant correlations.Table 1. Cross Correlations with confidence levels
 |
| |
|
By referring Table 1 it can be seen that all the cross correlations are significant. Therefore it provide evidence to say that the financial indices Oil, Gold and Cocoa are associated with current day’s values of considered three stock market indices GSPC, AORD and ASPI. It comply with the fact found from the literature which is that the Oil, Gold and Cocoa are important financial indices associated with stock market indices.
3.2. Distribution Identification
The traditional belief is that the financial return series follow the normal distribution. Therefore normality of Oil, Gold and Cocoa index returns were examined. Figure 1 illustrates the normal probability plots.Figure 1 (a), (b) and (c) clearly show that the three graphs deviate from the straight line. Therefore, it can be concluded that the return series of Oil index, Gold index and Cocoa index are deviate from the normal distribution.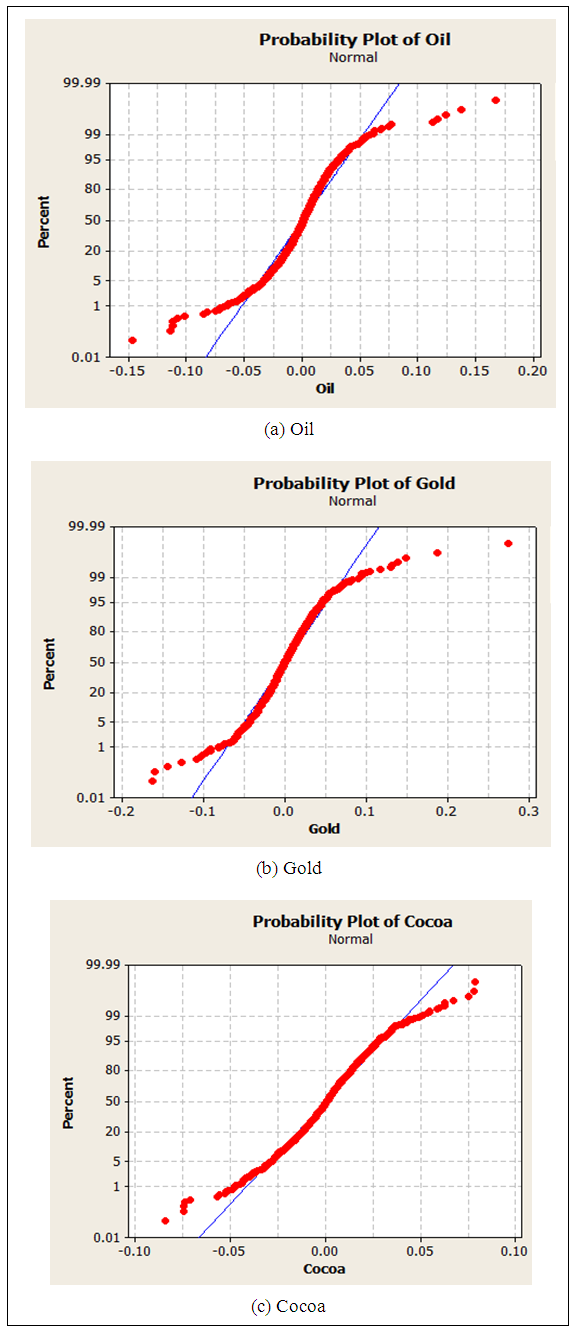 | Figure 1. Normal Probability plots of return series |
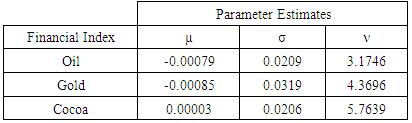
With the evidence from literature, Scaled t distributions were fitted to the return series of Oil, Gold and Cocoa indices. Three parameters which are associated with the Scaled t distribution: location parameter (µ), scale parameter (σ) and shape parameter (ν) were calculated and the suitability of fitted distributions were evaluated using p-p plots and cumulative plots. Fitted Scaled t distributions and calculated parameters are displayed in Figure 2 and Table 2 respectively.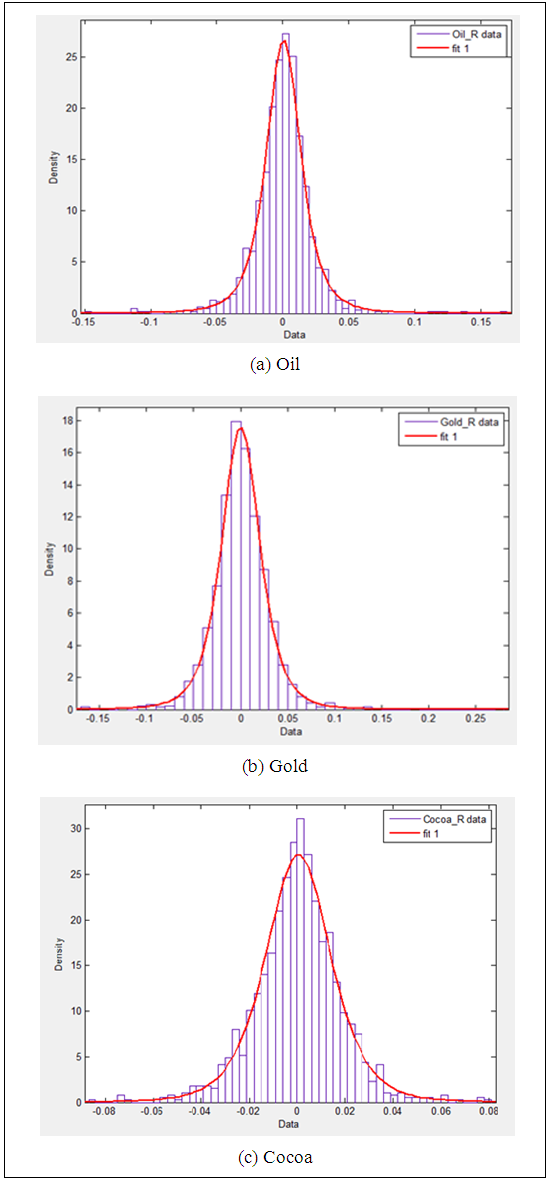 | Figure 2. Fitted Scaled t distributions for return series of Oil, Gold and Cocoa indices |
Table 2. Estimated parameters of the fitted Scaled t distributions for the three return series
 |
| |
|
The shape parameter ν of the Scaled t distribution can capture the fat tails in the fitted distributions. Smaller ν parameter estimates between 2 to 5 for all three indices in Table 1 indicates that the fat tails of the distributions are well captured by the fitted distributions.According to Figure 2 (a), (b) and (c), it seems that the Scaled t distributions are well fitted to the return distributions of Oil index, Gold index and Cocoa index respectively.
3.3. Adequacy of Fitted Distributions
Probability-Probability plots (p-p plots) were used to access the suitability of fitted distributions. When testing adequacy of fitted Scaled t distributions, empirical cumulative distributions were calculated using data series and theoretical cumulative distributions were calculate using Matlab software. Figure 3 illustrates p-p plots drawn to examine the suitability of fitted distributions for return series of Oil, Gold and Cocoa indices. | Figure 3. p-p plots of fitted distributions of return series of Oil, Gold and Cocoa indices |
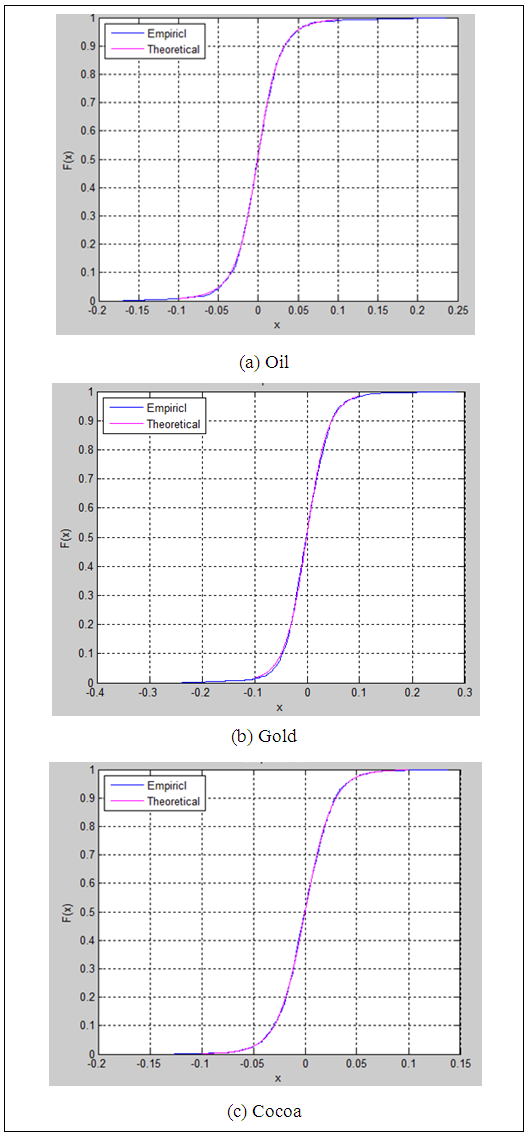
With reference to (a), (b) and (c) plots of Figure 3, it is apparent that all the graphs exhibit straight lines. It implies that the empirical distributions coincide with the theoretical distributions in all three financial return series. Therefore, it can be concluded that the Scaled t distributions with above mentioned parameters fit well on the return series of Oil index, Gold index and Cocoa index.Another technique, cumulative plots were used to confirm the suitability of fitted distributions and Figure 4 illustrates results.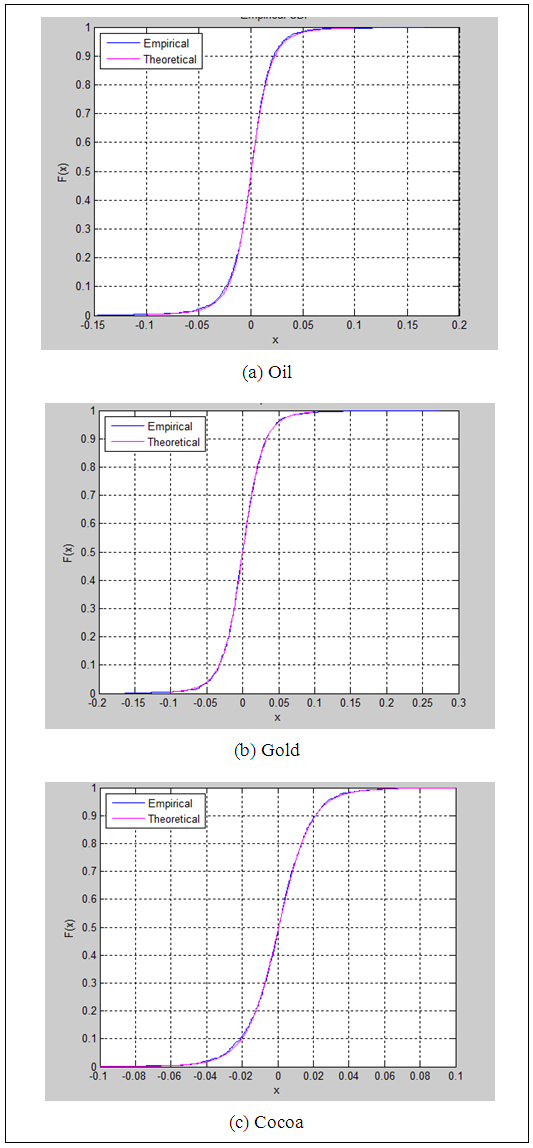 | Figure 4. Cumulative plots of fitted distributions of return series of Oil, Gold and Cocoa indices |
By referring three plots in Figure 4, it can be clearly seen that the two lines in each graph are overlay each other and it emphasis the fact that the theoretical cumulative distribution and the empirical cumulative distributions are similar. This result confirms that the fitted Scaled t distributions are appropriate to model return series of three financial indices Oil, Gold and Cocoa.
3.4. Random Walk Model
For simplicity, the random walk model was used for further investigations. The first difference of each return series of the three financial indices: Oil, Gold and Cocoa were employed in the analysis. Figure 5 and Table 3 represent fitted Scaled t distributions and estimated parameters for the first difference of each return series respectively.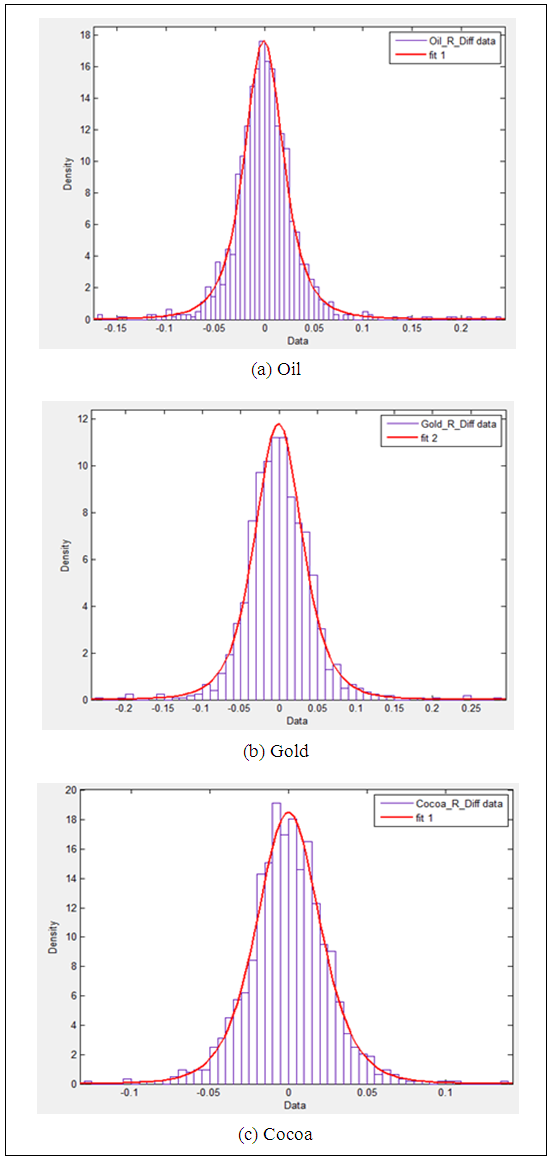 | Figure 5. Fitted Scaled t distributions for the first difference of return series of Oil, Gold and Cocoa indices |
Table 3. Estimated parameters of the fitted Scaled t distributions for the first difference of three return series
 |
| |
|
With reference to Figure 5, it can be said that Scaled t distributions with respective parameters are suitable to model the first difference of return series of Oil, Gold and Cocoa indices.Table 3 depicts that all the location parameters are approximately zero and it comply with the theory of random walk model. By comparing Table 2 and Table 3, it can be observed that the estimated scale parameters and shape parameters of first difference of return series of all the three financial indices are slightly higher than the corresponding parameters estimated for the return series of each index.p-p plots and cumulative plots were used to evaluate the suitability of fitted distributions for the first difference of three return series and present in Figure 6 and Figure 7 respectively.By referring Figure 6, it can be observed that all the three plots follow straight lines which emphasis that the fitted distributions are adequate to model first difference of the return series of three financial indices under the study.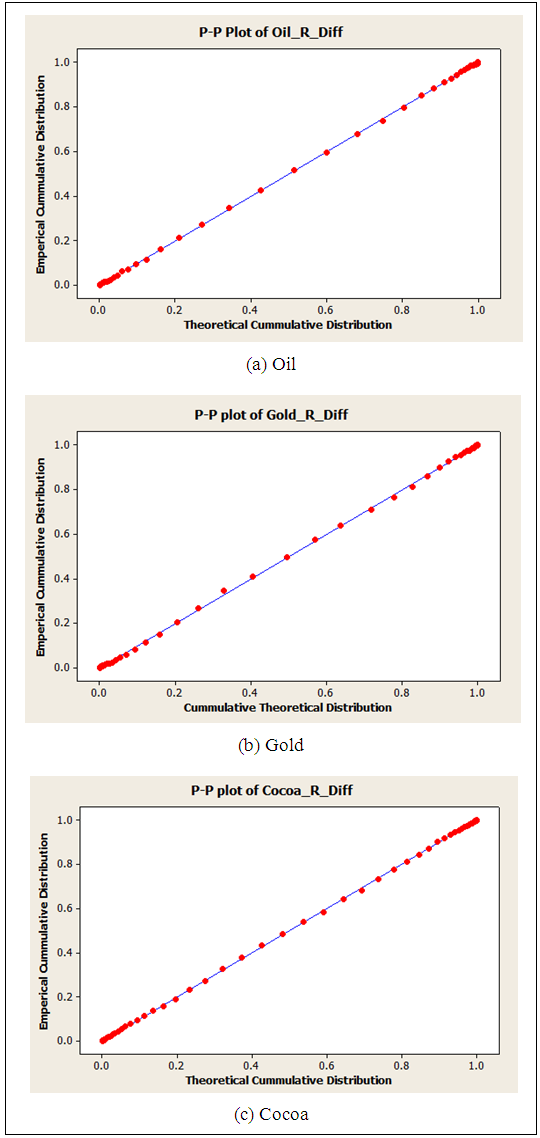 | Figure 6. p-p plots for fitted distributions of first difference of three return series |
 | Figure 7. Cumulative plots for fitted distributions of first difference of of three return series |
Figure 7 (a), (b) and (c) clearly exhibit that the two lines are concur each other in each plot. Results obtained from p-p plots and cumulative plots confirm that the fitted distributions with respective parameter in Table 3 are well fitted to the first difference of return series of Oil index, Gold index and Cocoa index.These results verifies that the return distributions of Oil index, Gold index and Cocoa index are distributed as Scaled t distributions. Therefore, it can be concluded that the fitted Scaled t distributions in Figure 2 with respective parameters in Table 2 are suitable to model the return series of considered three financial indices: Oil, Gold and Cocoa.Financial indices associated with stock markets are not limited to considered three indices: Oil, Gold and Cocoa in the study. This study can be extended to identify return distributions of other financial indices relating to stock markets such as exchange rates, interest rates, Treasury bill rates, etc. The study can be improved by providing evidence of association between Oil, Gold and Cocoa indices with stock markets by considering data of some other stock markets.
4. Conclusions
Distributions of the return series of Oil index, Gold index and Cocoa index deviate from the normal distribution by contradicting the traditional belief. Scaled t distribution can be recommended as the most suitable distribution to model the return distributions of three financial indices Oil index, Gold index and Cocoa index. Identified distributions can be used to build stock market prediction models with higher accuracy.
References
| [1] | Patel, S. "The effect of Macroeconomic Determinants on the performance of the Indian Stock Market". NMIMS Management Review, 22, pp 117-127. 2012. |
| [2] | Kuwornu, J.K.M. "Effect of Macroeconomic Variables on the Ghanaian Stock Market Returns: A Co-integration Analysis". Agris on-line Papers in Economics and Informatics. 4, vol. 2. 2010. |
| [3] | Sariannidis, N., Giannarakis, G., Litinas, N., and Konteos, G. "A GARCH Examination of Macroeconomic Effects on U.S. stock Market: A Distinction between the Total Market Index and the Sustainability Index". European Research Studies, 20, vol. 1. pp 129-142. 2010. |
| [4] | Gilmore, C.G., McManus, G. M., Sharma, R. and Tazel, A. "The Dynamics of Gold Prices, Gold Mining Stock Prices and Stock Market Prices Co-movements". Research in Applied Economics. 1, vol. 1. 2009. |
| [5] | Bellalah, M. and Habiba, U. "Impact of Macroeconomic Factors on Stock Exchange Prices: Evidence from USA, Japan and China". Thema Working Paper n°2013-15 Université de Cergy Pontoise, France. 2013. |
| [6] | Certi, A., Joets, M. and Mignon, V. "On the links between stock and commodity markets' volatility". CEPII. No 2012-20. 2012. |
| [7] | Shih, T.L. and Yu, H.C. "Probability Distribution of Return and Volatility in Crude Oil Market". The Journal of Global Business Management. 4, vol. 2. 2009. |
| [8] | Kumari, S.N. and Tan, A. "Asset Return distribution and Its application to Gold Future Index". Journal of Mathematics, Statistics and Operations Research, 2, vol. 1, pp 72-76. 2013. |
| [9] | Aparicio, F. and Estrada, J. "Empirical Distributions of Stock Returns: European Securities Markets, 1990-95". Business Economics Series 02, Universidad Carlos de la Empresa, Spain. 1997. |
| [10] | Peiro, A. "The Distribution of Stock Returns: international evidence". Applied Financial Economics, 4, pp 431-439. 1994. |
| [11] | Caruso, J.C. and Cliff, N. "Empirical size, coverage and power of confidence intervals for Spearman's Rho". Educational and Psychological Measurement, 57, vol. 4. pp 37-54. 1997. |
| [12] | Shen, D. "Computation of Correlation Coefficient and Its Confidence Interval in SAS". Proceedings of the SAS SUGI Forum 2006. Paper 170-31. 2006. |
| [13] | Mood, A. M., Graybill, F. & Boes, D. C. Introduction to the theory of statistics. Singapore: Mc-Graw-Hill. 1974. |
| [14] | Howell, D. C. Encyclopedia of Statistics in Behavioral Science. John Wiley & Sons, Ltd. 2005. |
| [15] | Cox, D. R., and D. Oakes. Analysis of Survival Data. London: Chapman & Hall, 1984. |
| [16] | Taylor, H. M. and Karlin, S. An Introduction to Stochastic Modeling. 3rd Edition. Academic Press. 1998. |
| [17] | Hellstrom, T. A Random Walk through the Stock Market. Thesis of Umea University, Sweden. 1998. |
| [18] | Lawler, G.F. and Limic, V. Random Walk: A Modern Introduction. Cambridge University Press. 2010. |

 Abstract
 Reference
 Full-Text PDF
 Full-text HTML