-
Paper Information
- Previous Paper
- Paper Submission
-
Journal Information
- About This Journal
- Editorial Board
- Current Issue
- Archive
- Author Guidelines
- Contact Us
International Journal of Statistics and Applications
p-ISSN: 2168-5193 e-ISSN: 2168-5215
2016; 6(3): 145-155
doi:10.5923/j.statistics.20160603.07

Psychometric Properties and Confirmatory Structure of the Strengths and Difficulties Questionnaire in a Sample of Adolescents in Nigeria
 Abstract
 Reference
 Full-Text PDF
 Full-text HTML
Onoja M. Akpa , Rotimi F. Afolabi , Kayode R. Fowobaje
Department of Epidemiology and Medical Statistics, College of Medicine, University of Ibadan, Nigeria
Correspondence to: Onoja M. Akpa , Department of Epidemiology and Medical Statistics, College of Medicine, University of Ibadan, Nigeria.
| Email: |  |
Copyright © 2016 Scientific & Academic Publishing. All Rights Reserved.
This work is licensed under the Creative Commons Attribution International License (CC BY).
http://creativecommons.org/licenses/by/4.0/

s Though the SDQ has been used in selected studies in Nigeria, its theoretical structure has not been fully and appropriately investigated in the setting. The present study employs Exploratory Factor Analysis (EFA) and Confirmatory Factor Analysis (CFA) to investigate the theoretical structure of the self-reported version of the SDQ in a sample of adolescents in Benue state, Nigeria. A total of 1,244 adolescents from different categories of secondary schools in Makurdi and Vandekya Local government areas of Benue state participated in the study. Preliminary data analyses were performed using descriptive statistics while the theoretical structure of the SDQ was assessed using EFA and CFA. Model fits were assessed using Chi-square test and other fit indices at 5% significance level. Participants were 14.19±2.45 (Vandekya) and 14.19±2.45 (Makurdi) years old. Results of the EFA and CFA revealed a 3-factor oblique model as the best model for the sample of adolescents studied 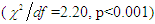 with all fit indices yielding better results. A correlated 3-factor model fits the present data better than the 5-factor theoretical model of the SDQ. The use of the original 5-factor model of the SDQ in the present setting should be interpreted with caution.
Keywords: Adolescents, Exploratory factor analysis, Confirmatory factor analysis, Strengths and difficulties questionnaire, Factor structure
Cite this paper: Onoja M. Akpa , Rotimi F. Afolabi , Kayode R. Fowobaje , Psychometric Properties and Confirmatory Structure of the Strengths and Difficulties Questionnaire in a Sample of Adolescents in Nigeria, International Journal of Statistics and Applications, Vol. 6 No. 3, 2016, pp. 145-155. doi: 10.5923/j.statistics.20160603.07.
Article Outline
1. Introduction
- The Strengths and Difficulties Questionnaire (SDQ) developed by Goodman (1997) has often been used as a screening instrument for child and adolescent mental health and behavioral problems in clinical and public health investigations (Giannakopoulos, Tzavara, Dimitrakaki, Kolai- tis, Rotsika, & Tountas, 2009). With 25-item, the SDQ is used to generate scores for five domains of psychological adjustment among children and adolescents: hyperactivity-inattention, emotional symptoms, prosocial behavioral, conduct problems, and peer problems (Dickey & Blumberg, 2004; Goodman, 1997; Mellor & Stokes, 2007). The SDQ is generally considered to be an instrument with good psychometric properties and the construct validity has been supported in the literature (Björnsdotter, Enebrink, & Ghaderi, 2013; Dickey & Blumberg, 2004). For instance, the SDQ generated scores are highly correlated with Child Behavior Check List (CBCL) and it is significantly better than the CBCL in detecting inattention and hyperactivity when they both are compared to a semi-structured interview (Björnsdotter et al., 2013; Dickey & Blumberg, 2004; Goodman and Scott, 1999). In addition, Dickey and Blumberg (2004) reported that significant relationships were observed between the SDQ self-report questionnaire and the Youth Self-Report. Besides, the SDQ contains several positively worded items assessing children’s strengths similarly to that of the Youth Self-Report. The inclusion of these items increased the acceptability of the instrument to parents (Dickey & Blumberg, 2004).Furthermore, as noted by Goodman (1999) and many other literatures (Björnsdotter et al., 2013; Dickey & Blumberg, 2004; Mellor & Stokes, 2007), there are several competitive advantages of the SDQ instrument over related instruments. Its brevity and free access features couple with its ability to focus not only on difficulties but also on strengths is exceptional, and the acceptability of the instrument to parents, mental health professionals, and epidemiologists is highly commendable. Apart from that, its adoption for and inclusion to use in institution such as the National Health Interview Survey in the United States (Dickey & Blumberg, 2004) is a great pointer to its potential. Multi-informant SDQs have been found to be relatively good screeners for conduct, hyperactivity, depressive, and anxiety disorders in a community sample (Goodman, Ford, Simmons, Gatward, & Meltzer, 2000; Mullick & Goodman, 2001) in certain population setting. Exploratory and confirmatory Factor Analysis has been previously used to assess the structure of the SDQ (Björnsdotter et al., 2013; Dickey & Blumberg, 2004; Giannakopoulos et al., 2009; Mellor & Stokes, 2007). However, the theoretical structure has not been fully and appropriately investigated (Mellor & Stokes, 2007) in some relevant population settings where the SDQ has been applied. In fact, though the SDQ has been used in some studies in Nigeria (Bakare, Ubochi, Ebigbo, & Orovwigho, 2010; Adeosun, Ogun, Adegbohun, Jejeloye, & Ogunlowo, 2014; Akpa & Bamgboye, 2015; Akpa, Bamgboye, & Baiyewu, 2015; Adeosun, Adegbohun, Jejeloye, Oyekunle, Ogunlowo, & Pedro, 2015), its theoretical structure and other psychometric properties have not been comprehensively investigated in the Nigerian setting.To this end, the present study investigated the theoretical structure of the self-reported version of the SDQ in a population of adolescents attending secondary schools in Benue state, Nigeria. In addition to the theoretical structure, relevant hypothesis were tested using 6 other competing models. In order to ensure a more comprehensive report, both EFA and CFA including other relevant psychometric properties of the SDQ were also investigated. The intention was to provide scientific bases (back-up by data) as well as relevant cautions in the application of the SDQ in the Nigerian and similar settings.
2. Methods
- Participants and ProceduresIn 2012/2013, a state wide survey covering a Local Government Area (LGA) from each of the three Senatorial districts (including the state capital) was conducted in Benue state, Nigeria. The focus of the study was among others, to assess the psychosocial wellbeing of adolescents in the selected LGAs. Further details on the study location and sampling strategies have been described in previous studies (Akpa et al, 2015; Akpa & Bamgboye, 2015).Participants were (684 boys and 560 girls) adolescents age 10-19 years (M = 14.7, SD =1.34) drawn from secondary schools, selected for large student’s population, ownership (private or public) and gender (Boys-only, Girls-only and Gender-mixed). After reading through the consent form, every consenting student from a randomly selected class filled the self-administered questionnaire in the English language. In order to enhance the scope of the study findings, adolescents who are out of side were also captured through a household survey. Ethical approval for the survey was obtained from both the University of Ibadan Institutional Review Board (IRB) with the approval number UI/EC/12/0235 and the Benue state Ministry of Health’s ethical committee with the reference number MED/261/VOL.1/56. Further permission was obtained from the authorities of each selected school prior to the conduct of the study. The school principals or designated officers of the institutions stood in as guardians for the participants (Akpa et al, 2015; Akpa & Bamgboye, 2015).For the present analysis, data for the State capital (325 boys and 182 girls) and one randomly selected (Vandekya) LGA (359 boys and 378 girls) was extracted from the database. The combined data consisted of 54.98% boys and 45.02% girls aged 10-19 years (M = 14.7, SD = 1.34).MeasuresThe SDQ includes 25 items for measuring behavior and emotional problems among children and adolescents (Doku, 2009; Goodman, 1997; Mullick & Goodman, 2001; Zhou, 2012). Already translated into over 60 languages, the SDQ has been used to assess children's psychosocial outcomes in over 40 countries (Akpa et al., 2015; Doku, 2009, Giannakopoulos et al., 2009). The SDQ items were initially selected and reported in a previous study (Goodman, 2001), on the basis of relevant concepts as well as factor analysis. The SDQ is a multimethods instrument consisting of a parent and a teacher form available for children aged 3–16 years, and a self-reported form available for the age 11-16 years.In general, each version of the SDQ contains 25 items divided into five subscales of five items, namely; Emotional Symptoms Scale (ESS), Conduct Problems Scale (CPS), Hyperactivity-Inattention Scale (HAS), Peer Problems Scale (PPS), and Prosocial Behavior Scale (PBS). Items are scored on a 3-point Likert-type scale indicating how each attribute applies to the responded (0=not true, 1=somewhat true, 2=certainly true). A high score on the PBS reflects strength, while high scores on the other four subscales of the SDQ reflect difficulties. Subscale total scores are summed (for all subscales except (PBS) together to generate the Total Difficulties score (TDS). Possible total scores ranges from 0 to 10 for subscales and from 0 to 40 for the TDS with varying cut-off scores for distinguishing normal, borderline, and abnormal symptoms.Statistical AnalysisPreliminary analysis of the responses at the item level was carried out to assess pattern of responses and the rate of missing values in the data. Participants who deliberately left a large proportion of the questionnaires unfilled and those found to endorse the same response for all items in the questionnaire were completely removed from the database prior to analysis (resulting in a 0% missing values).Descriptive statistics including mean, standard deviations and percentages were used to describe the distributions of the respondents, SDQ subscales and items. The Pearson’s moment correlation coefficient was used to assess the strength of the interrelationships between the subscales of the SDQ. Cronbach’s Alpha (α) was used to assess the internal consistency of the instrument. Given the ordinal nature of the response format (3 points only), Polychoric ordinal alpha (αp) (Gadermann, Guhn, & Zumbo, 2012) was calculated to further investigate the estimates of the internal consistency obtained using Cronbach’s alpha. Polychoric correlations between the items in each subscale were first obtained from R package (Fox, 2010). The average correlation
 was entered into the following formula (Björnsdotter et al., 2013; Gadermann et al., 2012), where k is the number of items in the scale:
 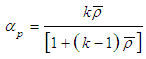 Using the data extracted for Vandekya LGA, two Exploratory Factor Analyses (EFA) were conducted using IBM SPSS Statistics, version 20. The first was to assess the SDQ measurement model and how each item loaded onto their respective subscales and the other was to investigate the EFA model suggested by the data. Prior to EFA, the Kaiser-Meyer-Olkin measure of sampling adequacy and the Bartlett’s test of sphericity were conducted to indicate if the data were appropriate for EFA (Akpa et al., 2015; Liau, et.al, 2011; Pinterits et.al, 2009). Exploratory Factor Analysis was conducted using Principal-axis factoring extraction with a direct oblimin rotation. The factor pattern coefficients for the SDQ items were computed along with their communalities, eigenvalues and the percentage of variance explained by the extracted factors. In the second EFA, the scree plot, eigenvalues, the factor pattern coefficients, and the percentage of variance explained by the extracted factors were used to determine the number of factors that best fits the data. Items should preferably load ≥0.40 (in absolute value) on the relevant factor and <0.40 on all other factors (Akpa et al., 2015; Liau et.al, 2011; Yang & Montgomery, 2011).Subsequent on the outcome of the first EFA, the fit of the Goodman’s (five factors) theoretical model of the SDQ (5-factor) was investigated using series of confirmatory factor analysis (CFA) models in AMOS version 21. The Goodman’s (5-factor) theoretical model of the SDQ was tested against a 5-factor orthogonal model; a one-factor model having all 25-items loading on a single factor and a 5-factor second-order model having all factors (except the Prosocial Behavior scale) subordinated to a single second-order factor. Consequent on the outcome of the second EFA, another series of CFA models of the SDQ was also investigated. A 3-factor oblique model, a 3-factor orthogonal model and a 3-factor second-order model having the first two factors (consisting of only items from the four subscales constituting difficulties) subordinated to a single second-order factor model were investigated. In each CFA model, multiple indices and their respective cut-off were used to evaluate the global model fit to the data. In particular, the Chi-square test divided by the degrees of freedom (df) should be less than
 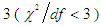 and the Root Mean Square Error of Approximation (RMSEA) is ≤ 0.06. The Goodness of Fit Index (GFI), the Tucker-Lewis Index (TLI), the Comparative fit index (CFI), the Incremental Fit Index (IFI) is greater than 0.8 while the Normed Fit Index (NFI) is greater than 0.7. Also, the Consistent AIC (CAIC), the Bayesian Information Criterion (BIC) and the Expected Cross Validation Index (ECVI) were as well used for model comparisons, with smaller values indicating a better fit (Akpa et al., 2015; Akpa & Unuabonah, 2011; Yang & Montgomery, 2011). All analysis was carried out at 95% confidence level.
3. Results
- Participants’ characteristicsParticipants were 14.19±2.45 years in Vandekya LGA and 14.19±2.45 years in Makurdi LGA (results not in Tables) with 67.1% and 86.0% of them being age 13-17 years in Vandekya and Makurdi LGAs respectively. More than half of the participants in Vadekya LGA are female while over 60% of them in Makurdi LGA are male (Table 1).
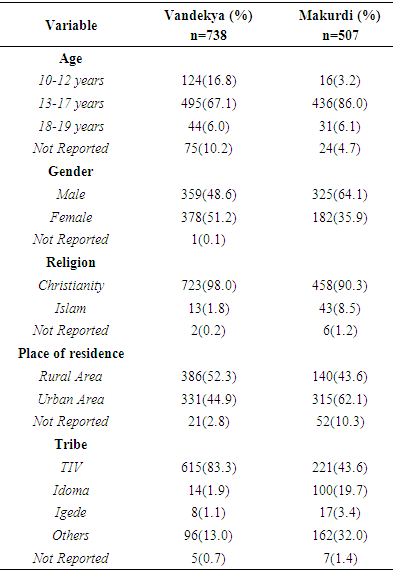 | Table 1. Socio-demographic characteristics of respondents |
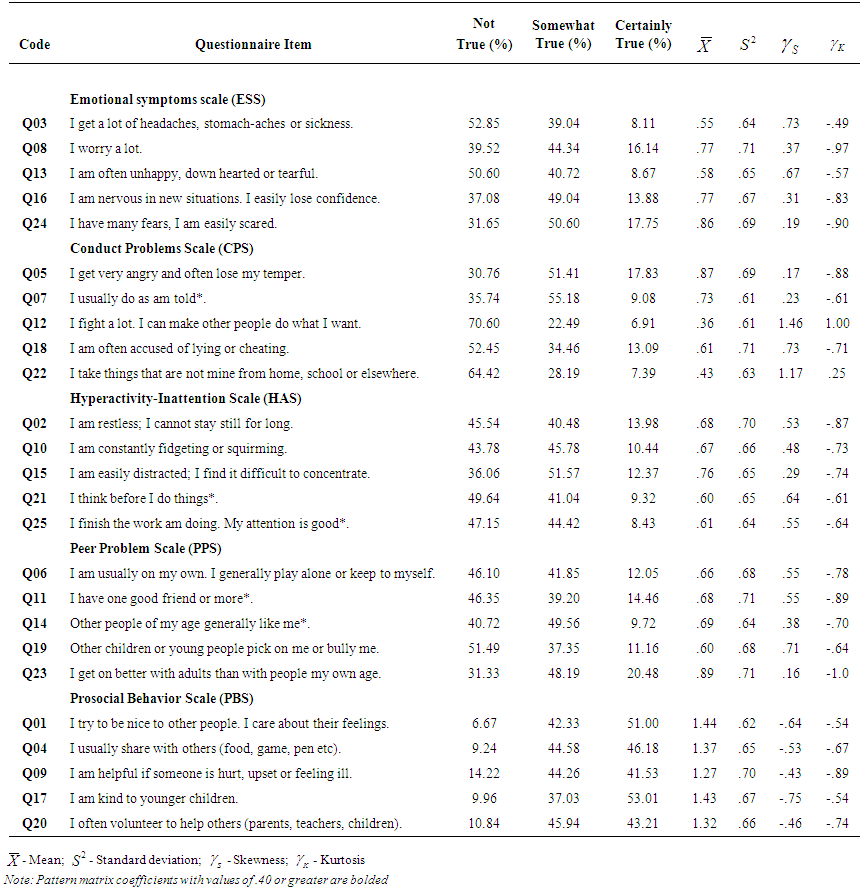 | Table 2. Response distribution and descriptive characteristics at item level |
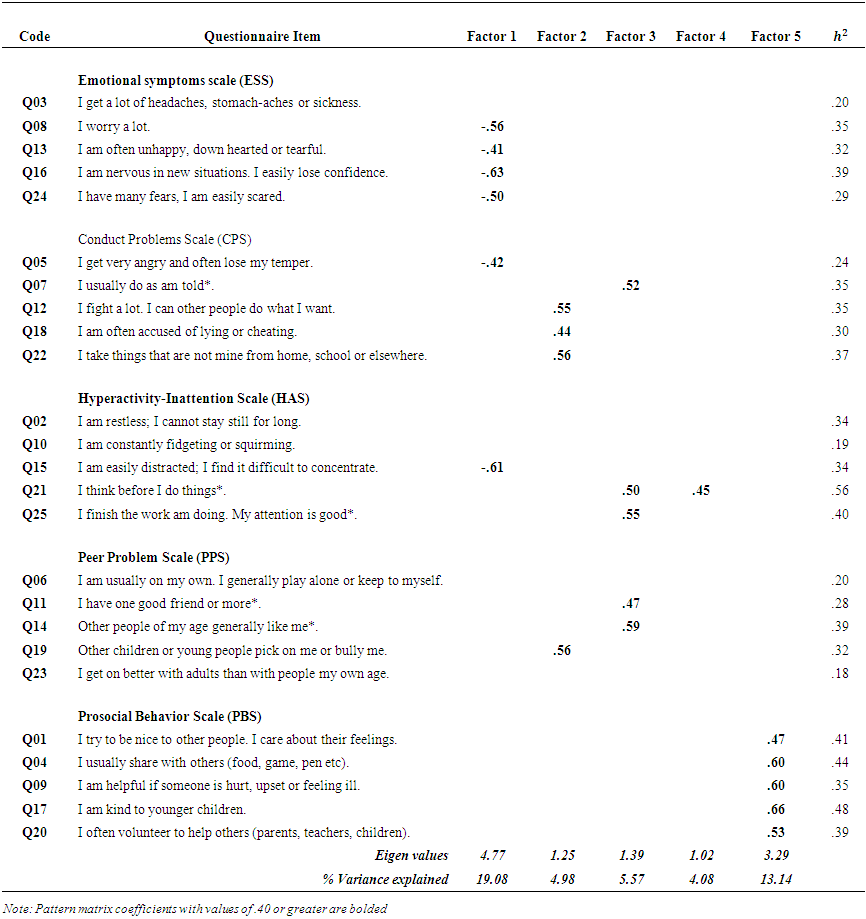 | Table 3. Communalities, Pattern Matrix for the Theoretical 5-Factor structure of the SDQ |
 | Table 4. Communalities, Pattern Matrix of the 3-Factor (oblique) structure of the SDQ |
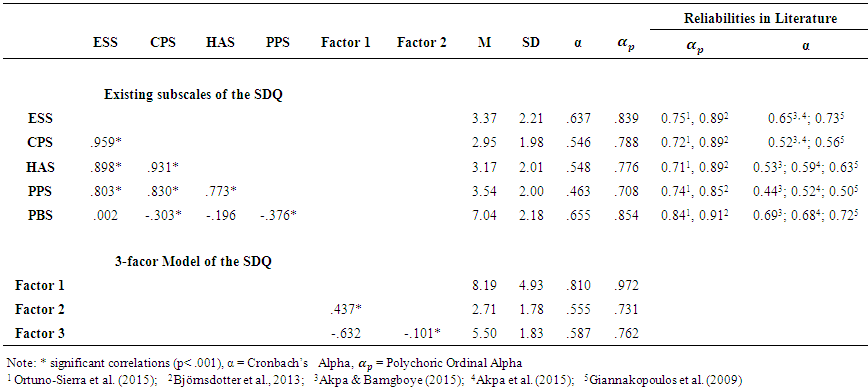 | Table 5. Factor Correlations, Descriptive statistics and Reliabilities coefficients of the 5 Subscales and 3-factor model of the SDQ |
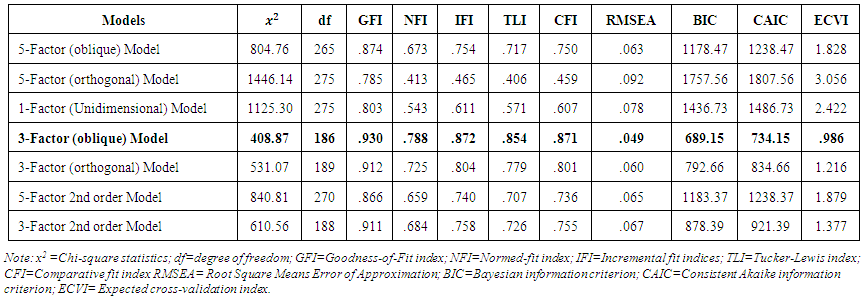 | Table 6. Summary of Fit Indices of the Confirmatory Factor Analyses |
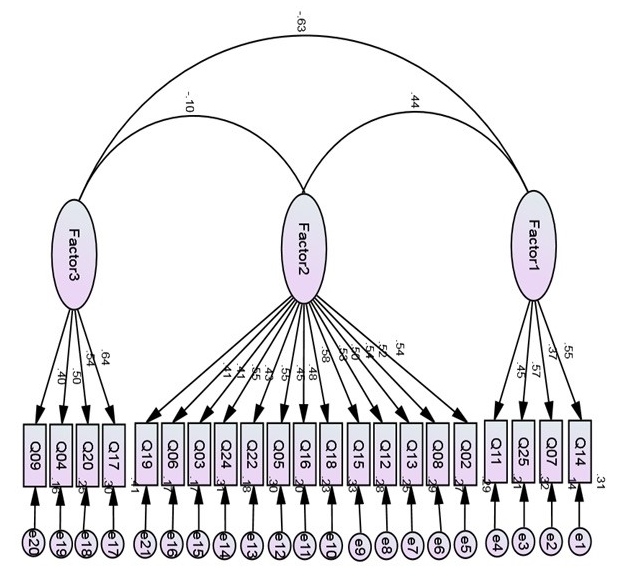 | Figure 3. Standardized estimates for the competing 3-factor (21-item SDQ) |
4. Discussion
- The strength and difficulty questionnaire (SDQ) was designed, as both clinical and epidemiological research tool, to investigate children and adolescent’s attention or concentration, peer relations, prosocial behaviors, emotional symptoms and conduct or behavioral disorders (Akpa, et al., 2015; Dickney & Blumberg, 2004; Goodman, 1994; 1997). In the present study, we present a comprehensive report on the factor structure of the SDQ in a sample of adolescents (age 10-19 years) in Nigeria. Other psychometric properties of the SDQ including the Cronbach’s and the polychoric alphas (investigating the internal consistency of the instrument) were presented for each subscale of the SDQ. We also reported results for seven different CFA models as well as item response analysis that explicitly described the distribution properties of the SDQ items. Thought all items have skewness and kurtosis within acceptable range (-2 to +2) for normality assumptions, polychoric ordinal alphas in addition to the Cronbach’s alpha was used to investigate internal consistency due to the ordinal nature of the response scores. The internal consistency of the SDQ theoretical measurement (5-factor) model using Cronbach’s alpha was found to be relatively good (except for the Peer problems scale). And using the Polychoric alpha, the internal consistency was found to be high for all subscales. This suggests that the Cronbach’s alpha may have under estimated the reliability coefficient due to the ordinal nature of the response scores. However, even the estimate obtained using the polychoric alpha is slightly lower compare with the reported value obtained for the SDQ subscales in former studies (Bjornsdotter et al., 2013; Giannakopoulos et al., 2009; Mellor & Stokes, 2007; Stone et al., 2010). Estimate of the internal consistencies observed in the present study notwithstanding, the pattern of results is somewhat similar to what was previously reported in related studies. Specifically, the Peer problems scale has the weakest reliability while the Prosocial behavior scale has the strongest reliability coefficient (Bjornsdotter et al., 2013; Giannakopoulos et al., 2009; Mellor & Stokes, 2007; Stone et al., 2010).The theoretical measurement (5-factor) model of the SDQ has been supported in part by selected studies. D'Acremont and Linden (2008) reported a reliable factor organization of the French version of the teacher-report version of the SDQ with estimate of the internal consistency ranging from acceptable (0.64) to very good (0.90) reliability for the five subscales. Also, among parents and teachers in a community sample of young children in Flanders, Netherland, van Leeuwen, Meerschaert, Bosmans, De Medts, & Braet (2006) reported that the five-factor model of the SDQ as outlined by Goodman fitted moderately well, whereas the model with three latent variables (externalising behavior, internalising behavior, and prosocial behavior) did not show better fit indices. Apart from that, related studies have also provided support for the Goodman's five-factor structure via confirmatory factor analytic techniques (Capron, Therond, & Duyme, 2007; Giannakopoulos et al., 2009; Muris et al., 2003; Smedje, Broman, Hetta, & von Knorring, 1999). In a sample of 1,194 school children, Giannakopoulos et al. (2009) suggested that the original component scales of the SDQ, as described by Goodman, may be appropriate for a sample of Greek adolescents. However, a scoring procedure that better reflects some modifications in the factor structure of the instrument was suggested in order to improve the ability of school practitioners and clinicians to screen for emotional and behavioral problems among Greek adolescents.Unfortunately, when a confirmatory factor analysis was used, the 5-factor model does not provide suitable indices to support a good fit in the present study. Although the internal consistency for the five-factor model shows promise, a correlated 3-factor model appears to fit the behavioral pattern of adolescents in the present setting better compared to a 5-factor model. Not only was the 5-factor model not reproduced in the present study, only the prosocial behavior (Factor 2 in Table 4) was relatively stable with one item “I try to be nice to other people. I care about their feelings” intended for the subscale not loading on any factor. The remaining two extracted factors had items from the SDQ subscales loading on them haphazardly but one of the factors (Factor 1 in Table 4) comprised of all items in the emotional symptom scale and other selected (internalising) items from conduct problems and inattention. The other factor (Factor 3 in Table 4) contains few externalising items such as “I usually do as am told” etc and is more related to externalising problems. Although reasons for such loading pattern are unclear, it is possible that some studies reproduced the 5-factor model because of the similarities in settings between the study areas and where the SDQ scale was constructed. Many other past studies (even in similar settings) have been unable to reproduce the 5-factor model when the SDQ was administered to study subjects. For instance, in previous research examining the factor structure of the SDQ with children aged 6 to 10 years (in the UK) and adolescents ages 4 to 17 years (in the USA), the predicted five-component structure was not entirely confirmed. Among children aged 6 to 10 years, Curvis, McNulty, & Qualter (2014) found that a correlated two-factor structure comprising of ‘externalizing and peer problems’ and ‘internalizing problems’ fit the data well and identified two-factor model mapped broadly onto the constructs of externalizing and internalizing behavior. On the other hand, among adolescents studied in the USA, the results of both exploratory and confirmatory factor analysis show a distorted items loading pattern. Some items intended to assess conduct problems loaded more on the hyperactivity, and some items intended to assess peer problems were more strongly related with emotional or prosocial problems (Dickey & Blumberg, 2004). Also, Dickey & Blumberg (2004) found that a stable three-factor model consisting of externalization problems, internalization problems, and a positive construal factor. In the present study however, though a three-factor model was obtained, the distortion in the items loading pattern grossly affected the stability of factors, except for the prosocial construct. Worse results than those of the present investigations have been obtained for SDQ in an earlier study conducted in Australia (Mellor & Stokes, 2007). Using the parent and teachers’ versions of the SDQ in a large community sample of 7–17 years-olds, Mellor and Stokes (2007) found that the reputed 5-factor structure of the SDQ was not supported and none of the subscales was unidimensional. It is important to note that these results may not be unrelated to differences in the way SDQ items are construed by respondents from different settings (Akpa et al., 2015; Dickey & Blumberg, 2004).However, it is hasty to conclude that these findings invalidate the use of the SDQ in the present setting. In the first place, the instrument is designed for use as a screening tool, rather than a diagnostic test, and its validity has been documented in several study settings with different study populations (Goodman et al., 2000; 2003; Klasen, Woerner, Wolke et al., 2000; Mellor & Stokes, 2007; Muris, Meesters, & van den Berg, 2003). Consequently, rather than suggesting modifications, Mellor and Stokes (2007) suggested that the SDQ should be used cautiously, within the confines of its intent.
5. Strength and Limitations
- Though the SDQ has been used to investigate behavioral problems among adolescents in selected studies originating from Nigeria (Adeosun, et al., 2014; Adeosun et al., 2015; Akpa & Bamgboye, 2015; Akpa et al., 2015; Bakare et al., 2010), the present study is, to the best of our knowledge, the first comprehensive attempt to report the factor structure of the SDQ in this setting. The inclusion of the polychoric alpha and the CFA in the present study is a further step on what may have been reported in some important studies on the SDQ. Notwithstanding, the study suffers some important limitations worth reporting. For instance, when the SDQ’s self reported and parent/teacher’s reported versions are used together in a study, it allows from comparison of results as well as assessment of convergence and discriminant validity. The use only the self-reported version of the SDQ in the present study is an important limitation. A part from that, a study covering at least a state from each of the six geopolitical zones of Nigeria would have provided a more robust and report with wider applicability.
6. Conclusions and Recommendations
- The present study is the first to provide data on the factor structure and psychometrics properties of the self reported version of the SDQ in Nigeria. The 5-factor theoretical model of the SDQ does not fit the data obtained from the present study; a correlated 3-factor model fits the data better. Except for the prosocial behavior, none of the original subscale of the SDQ is unidimensional in the present study. The results suggest that in the present settings, the items on the SDQ may not provide a good fit to the reputed 5 subscales of its measurement model. It is therefore suggested that the use of the original 5-factor model of the SDQ in the present setting be interpreted with caution.However, further large factor analytic studies are needed in the setting in order to accurately identify an alternative structure that would force a rearrangement of items onto alternative subscales that better represent the situations of adolescents in this area (Mellor & Stokes, 2007).
ACKNOWLEDGEMENTS
- We acknowledge Medical Education Partnership Initiative in Nigeria (MEPIN) for funding this project. The project described in this study was supported by Award Number R24TW008878 from the Fogarty International Centre. The content is solely the responsibility of the authors and does not necessarily represent the official views of Fogarty International Centre or the National Institute of Health.