-
Paper Information
- Next Paper
- Paper Submission
-
Journal Information
- About This Journal
- Editorial Board
- Current Issue
- Archive
- Author Guidelines
- Contact Us
International Journal of Statistics and Applications
p-ISSN: 2168-5193 e-ISSN: 2168-5215
2016; 6(3): 105-112
doi:10.5923/j.statistics.20160603.03

Comparative Model Analysis of Road Traffic Accidents in Ghana
 Abstract
 Reference
 Full-Text PDF
 Full-text HTML
Agyemang Boakye 1, Godfred K. Abledu 1, Samuel Kwofie 1, Justine K. Gbang 1, Silas A. Gyimah 1, Daniel Mbima 2
1Koforidua Polytechnic, Applied Mathematics Department, Koforidua, Ghana
2Koforidua Polytechnic, Store Department, Koforidua, Ghana
Correspondence to: Agyemang Boakye , Koforidua Polytechnic, Applied Mathematics Department, Koforidua, Ghana.
| Email: |  |
Copyright © 2016 Scientific & Academic Publishing. All Rights Reserved.
This work is licensed under the Creative Commons Attribution International License (CC BY).
http://creativecommons.org/licenses/by/4.0/

Road traffic accidents of varying degrees that have occurred in Ghana both in the past and present have resulted in several road fatalities. These has led to the loss of lives, property, broken homes, and as well as leaving behind shattered families and communities, among others despite the indispensable role the road transport sector plays in the economy. This paper sort to explore the most parsimonious and robust linear model for the estimation and forecasting road traffic accidents statistically. This was achieved through the examination of the relationship between road traffic accidents, human and vehicular population in Ghana using linear regression models. Empirical results showed the existence of significant positive relationship between road traffic accidents, vehicle population and human population, with respective correlation coefficients as R1=0.855, R2=0.853, and R3=0.855 indicating a very strong positive association between them. The simple linear regression model between road traffic accidents and vehicle population was adjudged the most robust and parsimonious model based on model diagnostics (residual analysis with plots) coupled with tests of hypothesis. The paper therefore concludes that vehicular population is a very key variable that should not be left out in the policy formulation that would deal with curbing road traffic accidents in Ghana based on available statistics and results.
Keywords: Robust, Parsimonious, Model, Regression model, Correlation coefficient
Cite this paper: Agyemang Boakye , Godfred K. Abledu , Samuel Kwofie , Justine K. Gbang , Silas A. Gyimah , Daniel Mbima , Comparative Model Analysis of Road Traffic Accidents in Ghana, International Journal of Statistics and Applications, Vol. 6 No. 3, 2016, pp. 105-112. doi: 10.5923/j.statistics.20160603.03.
Article Outline
1. Introduction
- The road transport sector plays a key role in the socio-economic development of every economy. Not only does it facilitate the smooth transportation humans, goods and services from source(s) to respective destination(s), but also serve as a huge source of employment which is a critical economic indicator to development. The sector has been bedevilled with quite a number of goring tendencies through the occurrence of traffic accidents in Ghana. The spate increase in these forms of road traffic accidents has therefore become a worrying and growing concern to most Ghanaians in recent times. This is as a result of the tremendous negative effects of road traffic accidents on human lives, properties and the environment. The National Road Safety Commission (NRSC) was therefore established by an Act of Parliament (Act 567) in 1999 with the mission of promoting best road safety practices for all categories of road users through the vision of making Ghana a country with the safest road transportation system in Africa. Despite the existence of these powerful institutions and other regulatory bodies globally, statistics relating to road traffic accidents are very disheartening. WHO (2010), available statistics shows that at least 1.3 million people are killed every year through road crashes, with some 20-50 million suffering from various forms of disability; 90% of these road casualties are in low and middle income countries; at current rates, it is estimated that road traffic crashes will be the 3rd leading cause of death worldwide by the year 2020 if rigorous actions are not taken. Furthermore, 1,800 lives are lost in Ghana annually through road crashes with 14,000 injuries from an average of 11,000 road traffic crashes; road traffic crashes cost the nation 1.6% of GDP which translates to US$ 165 million in 2006 and US$ 288 million in 2009; 42% of these crash victims are pedestrians; 60% of all crash victims are people within the productive age group (NRSC, 2010). According to a World Health Organization (WHO) & World Bank (1999) report on deaths from non-communicable diseases are expected to climb from 28.1 million a year in 1990 to 49.7 million by 2020 (an increase in absolute numbers of 77%). Road traffic crashes will contribute significantly to this rise. According to the report, road traffic injuries are expected to move from ninth place to take third place in the rank order of disease burden by the year 2020.In assessing the magnitude of the problem of road traffic crashes, according to WHO, 1.2 million people die through road traffic crashes annually. On the average, in the industrialized countries, and also in many developing countries, one out of every ten hospital beds is occupied by a road traffic crash accident victim (NRSC 2010). The 1999 WHO publication on "," reports that road traffic crashes are the major cause of severe injuries in most countries and the leading injury-related cause of death among people aged 15-44 years. Globally, the WHO reports that 38,848,625 people were injured through motor vehicle crashes in 1998. Out of the 5.8 million people who died of injuries, 1,170,694 (20%) died as a direct result of injuries sustained in motor vehicle crashes.The above facts reveal unacceptable levels of road traffic accidents and casualties and therefore have global, national, social and economic burden, especially in Ghana as quite a substantial amount of the nation’s GDP is channelled into the management of road traffic accidents rather than real investments and development. To best of our knowledge, enough work has been done on road traffic accidents globally and as well as in Ghana, however, a comprehensive database about the menace especially regarding other variables which affect road traffic accidents such as the road network, educational or qualification status of drivers type of vehicles used and involved in traffic accidents, among others are currently not existence. This therefore makes it impossible for the need for interventions and strategies to be put in place based on empirical research outcomes to deal with the menace especially by reducing it by 50% by the end of 2020 as recommended in the United Nations (UN) Global Plan for the Decade of Action for Road Safety 2011- 2020. This paper therefore attempts to further explore available statistics through a continuation of the works of Boakye, A. etal (2013 and 2014) on ‘‘Regression Analysis of Road Traffic Accidents and Population Growth in Ghana’’ and ‘‘Modelling the Relationship between Road Traffic Accidents and Vehicle Population; Empirical Evidence from Ghana’’ respectively. The main objective of this paper was to explore the most parsimonious and robust linear model for the estimation and forecasting road traffic accidents statistically based on three quantitative variables namely the road traffic accidents, vehicular population and as well as the human population.
2. Methodology
2.1. Type and Source of Data
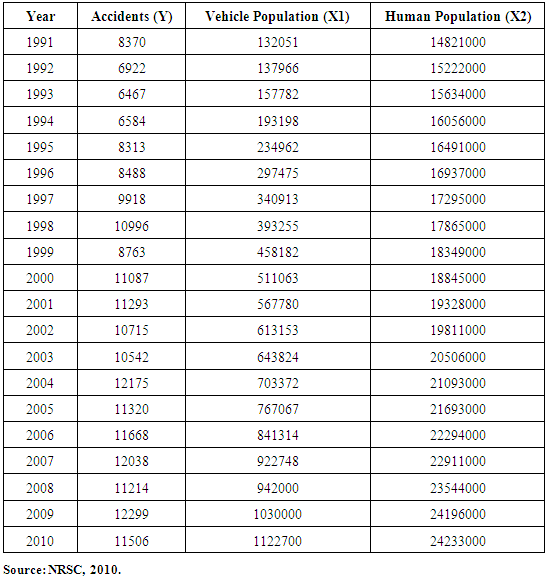
- The type of data used in this research was purely quantitative obtained from secondary sources. The data specifically relates the set of observations on the three main variables that are being studied. These are road traffic accidents, human population or simply population and vehicular population in Ghana covering a twenty (20) year period from 1991 to 2010, with road traffic accidents being the predictor or dependent variable whilst the remaining two being the explanatory or independent variables.Fay (1997), concluded that the key point of secondary data is that it should be relevant, accurate and available. For this reason and purpose, the time series data relating to road traffic accidents, the population and vehicular population covering the period 1991 to 2010 were collected from National Road Safety Commission of Ghana for the analysis.
2.2. Method of Data Analysis
- Exploratory data analysis, descriptive and inferential data analysis were performed. The data was first explored through the use of graphical displays to help identify and analyse trends and patterns in the data. These included line graphs and frequency polygons. Where the two or more variables were looked at concurrently, scatter plots was used to establish the relationship between them. With respect to the descriptive analysis, correlation coefficients, standard errors, have also been computed and interpreted. Linear regression model which attempts to model the relationship between the variables by fitting both the simple and multiple linear regression equations to the observed data was subsequently developed. In addition to linear regression analysis, multivariate times series analyses were also performed since the data was also viewed as a time series data. Finally, with regard to the inferential analysis, hypothesis tests were performed using the computed p-values in which decisions and conclusions were arrived at.
2.3. Assumptions and Model Formulation
- In order to use any model in statistics, the model must first of all be found to have been fitted well and as well as statistically significant. In this regression and multivariate time analysis, it became imperative to go beyond the fitting of an equation to data and making inferences about the population from which the data were drawn. There are some underlying conditions that must be satisfied, at least approximately, before any statistical inference can be considered reasonable. These conditions listed below were therefore verified:1. In the underlying population, the relationship between the response variable, Y, and the predictor variable of X is or must be linear. That is Y = β0 + βX.2. For each value of X, there is a group of Y values, and these Y values are normally distributed.3. The Y-values are statistically independent. That is, the Y values chosen for a population value of X do not depend on the Y values for any other value of X.4. For each value of X, the variance, σ2 of Y about the regression line (i.e. the amount of variation in the population of Y values) is the same.5. For time series analysis stationary is a critical assumption of time series analysis, stipulating that statistical descriptors of the time series are invariant for different ranges of the series. 6. Again, the residual vector must follow a multivariate white noise, i.e. E(εt) = 07. No outliers. As in other forms of regression, outliers may affect conclusions strongly and misleadingly.8. Random shocks. If shocks are present in the time series, they are assumed to be randomly distributed with a mean of 0 and a constant variance.
2.4. Model Adequacy Checking (diagnostics)
- The model diagnostics is done using graphical displays of the residuals described as follows. The probability plot of the residuals is used to verify the assumption of normality. In this case it is expected that the individual probabilities of the residuals are normally distributed if all the points are near or closer to one another with the plotted points forming an approximately straight line. Any points that tend to deviate from this pattern may be termed as an outlier. A plot of the residuals verses the fitted values must clearly show that the residuals appear to be randomly scattered about zero, thereby satisfying the assumption of constant variance. Again, the time plot of the residuals is used to check the assumption of statistical independence of the dependent variable. The residuals must appear to be randomly distributed without showing any clear visible pattern. As well as the histogram plot of the residuals is also used to check the same normality assumption in which the histogram plot of the residuals must appear to be normal in order to satisfy the normality assumption. However, a slight deviation from normality is allowed. Finally, with regard to the multivariate time series model, the residuals or errors are therefore conceived of as an independently and identically distributed (i.i.d) sequence with a constant variance and a zero mean. The ACF plot of the residuals must show no evidence of a significant spike in the ACF plot (the spikes are within the confidence limits) indicating that the residuals seem to be uncorrelated. The probability plot of the residuals should also indicate that the individual probabilities of the residual are greater than or above 0.05 (red line).
3. Analysis and Results
3.1. Exploratory Data Analyses
- The plot of the trend of road traffic accident data from 1991 to 2010. It can be seen from the figure that the accident situation over the period has not remained constant but rather varied from year to year. Some years saw significantly high occurrences whilst others saw low growths or occurrences. 1993 and 1994 recorded the least occurrences and has since been steadly increasing over the period. (Refer to Appendix I, Figure 3.1)It is clear from Figure 3.2 Appendix I that the vehicular population or the number of registered vehicles has continuously increased over the period, except during the year 2008 a marginal decrease and increased thereafter. This shows that the vehicle population has been growing and will continue to grow over time of course with gradual or minor fluctuations expected.Figure 3.3 (Appendix I) also on the other hand displays the plot of the trend of population of Ghana from 1991 to 2010. The trend in the population is not different from that of road traffic accidents and vehicle population as displayed in Figures 3.1 and 3.2 respectively. It clearly shows that population of the country has continuously increased over the period. This shows that the population has been growing and will continue to grow over time of course with gradual or minor fluctuations expected based on implementation of population programs.
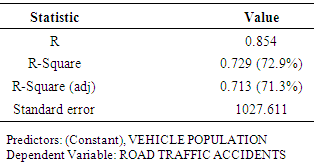
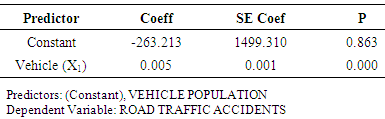
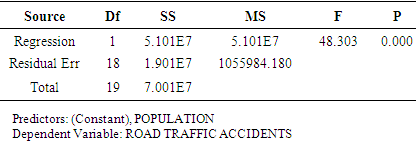
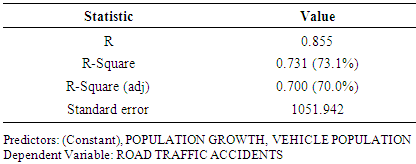
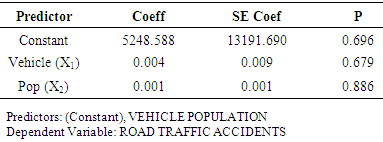
3.2. Model Development and Analysis of Relationship
|
|
|
|
|
|
|
|
|
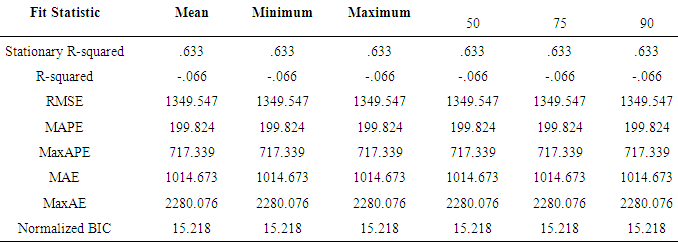
3.3. Multivariate time Series Model Development and Analysis
|
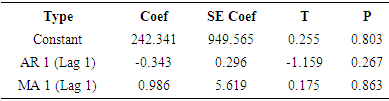
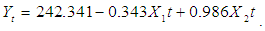 The result as displayed in the Table 3.10 below with regard to the T and P-values indicates that the parameter coefficients are statistically insignificant at alpha levels of (α = 0.01, 0.05). As a result the model is discarded.
|
4. Findings and Conclusions
4.1. Findings
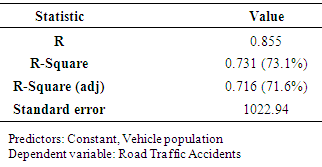
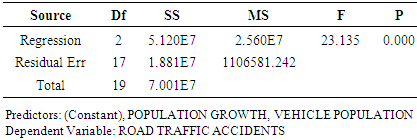
- The findings of the study include the following:Firstly, the study revealed that the road traffic accidents in Ghana over the period under study had a strong positive correlation with population and as well as vehicle population with a correlation coefficient value of 0.855, but at the same time implying that 14.5% of the changes in road traffic accidents being accounted for by other variables which were not included in the study. Specifically, the independent variables accounted for 73.1% of the variations or change in the dependent variable as recorded by the values of the coefficient of determination. However, in terms of the time seires model, R-squared value of -0.066 means that only small or insignificant proportion of the total variation is accounted for by the model. Its negative value implies that the model under consideration is worse than the baseline model. Secondly, the linear regression models obtained are respectively:
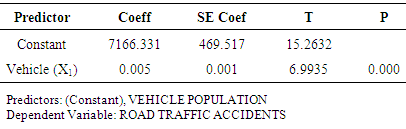
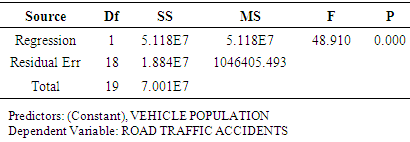
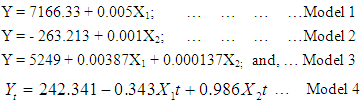 Where Y is the number of accidentsX1 is number of registered vehicles or vehicle populationX2 is the population growthFurthermore, the study revealed that all the above models were found to be statistically significant from the tests of hypothesis both in individual parameter coefficient and overall model terms except the third and fourth models which were not statistically significant in terms of the individual parameters coefficients. The model that is best at explaining and predicting road traffic accidents in Ghana should be the one with the highest r, r-square and found to be statistically significant as well.Finally, it was found out that models 1and 3 had the same values in terms of r, r-square and were statistically significant in overall model terms except in individual parameter coefficient terms that the model 3 was found not to be statistically significant and as such model 1 could be preferred to 3.
 4.2. Conclusions
- Based on the findings, the study conclude that model 1 that is the model which seeks to establish a relation between road traffic accidents and vehicle population is selected as the best model. It is also adjudged the more robust and parsimonious since it has fewer numbers of explanatory variable(s) in this case only one. Finally, the model thus chosen therefore can be used for estimation and forecasting purposes and should subsequently form the basis of decision and policy formulation regarding road traffic accident management in Ghana. The forth model was discarded outright since all the parameter coefficients were found to be statistically insignificant.