-
Paper Information
- Next Paper
- Paper Submission
-
Journal Information
- About This Journal
- Editorial Board
- Current Issue
- Archive
- Author Guidelines
- Contact Us
International Journal of Statistics and Applications
p-ISSN: 2168-5193 e-ISSN: 2168-5215
2016; 6(3): 89-95
doi:10.5923/j.statistics.20160603.01

Measurement of Inconsistency between Area and Production of Pulse in Bangladesh
 Abstract
 Reference
 Full-Text PDF
 Full-text HTML
Keya Rani Das1, Jaba Rani Sarker2, Sharmin Akhter3
1Department of Statistics, Bangabandhu Sheikh Mujibur Rahman Agricultural University, Gazipur, Bangladesh
2Department of Agricultural Economics, Bangabandhu Sheikh Mujibur Rahman Agricultural University, Gazipur, Bangladesh
3Department of Development and Poverty Studies, Sher-e-Bangla Agricultural University, Sher-e-Bangla Nagar, Dhaka, Bangladesh
Correspondence to: Keya Rani Das, Department of Statistics, Bangabandhu Sheikh Mujibur Rahman Agricultural University, Gazipur, Bangladesh.
| Email: |  |
Copyright © 2016 Scientific & Academic Publishing. All Rights Reserved.
This work is licensed under the Creative Commons Attribution International License (CC BY).
http://creativecommons.org/licenses/by/4.0/

In Bangladesh rice production advanced abundantly to meet this staple food’s need which turn out to food self-sufficiency. But it is the time to give more consideration to pulse production which is one of the largest sources of protein. But still it does not meet our annual market demand entirely resulting to more import. The purpose of this research was to enumerate the change and inconsistency of pulse in Bangladesh through area, production and yield. We picked up data from Bangladesh Bureau of Statistics (BBS) and Department of Agricultural Extension (DAE) in the year of 1972 to 2012 which is divided into two phases like as 1972 to 2000 and 2001 to 2012. This study expressed that the ploughable fields declined day after day and also production has decreased but yield has increased. Also it represents high correlation between area and production of pulse and the dependency rate of production on area are also listed here. Over the study period it shows satisfactory growth rate but it does not reveal stable pattern results as instability presents all over the time period for pulse production and found from literature that it is not adequate to complete the current necessity in Bangladesh. Lastly, it is strongly recommended from the view of this study to the policy makers to pay more attention for the sufficient pulse production.
Keywords: Pulse production, Area, Growth rate, Inconsistency
Cite this paper: Keya Rani Das, Jaba Rani Sarker, Sharmin Akhter, Measurement of Inconsistency between Area and Production of Pulse in Bangladesh, International Journal of Statistics and Applications, Vol. 6 No. 3, 2016, pp. 89-95. doi: 10.5923/j.statistics.20160603.01.
Article Outline
1. Introduction
- The largest sector of the economy in Bangladesh is agriculture as this country belongs decent weather and also the soil condition is well for agricultural production. In the country agricultural sector contributes almost 16.33 percent of the Gross Domestic Product (GDP) (BER, 2014) which is declining day after day as other sectors like industry, service is expanding very rapidly compared with agricultural sector. But pulse production is going up compared to previous year which indicates that the contribution of pulse in agricultural sector is increasing resulting to more share in GDP. Bangladesh has fertile land in most of the area all over the country which gives productive cultivation as well as conserves the demand for native people now a day. Rice is the staple food in our country so that the production of rice is increasing day by day in Bangladesh. But at the same time we consume other complementary foods whose needs generally we fulfill by agricultural production. Pulse is the great source of protein of diet for the largest population in Bangladesh. Pulse comprises much protein as about twice other than cereals and at the same time it also contains amino acid lysine which is in general shortage in food grains (Elias, S. M. et al. 1986). Pulse are suitable for standing cropping process as it needs less time or less term, less input and aridity tolerant quality. In Bangladesh pulse grows largely as regards area and production (BBS, 2004).In this days, pulses and oil crops have caught an attention as a considerable subsector of the department of agricultural extension (DAE) and Ministry of Agriculture, Government of Bangladesh and also planned as the title is “Pulses and oil crops Research and Development Vision: 2030” (Rahman, M. L. et al. 2010) due to rise the production of pulse and oilseed and also for the fulfillment of scarcity of these crops in the country. The increasing rate should be more raised and remained fixed for the pulse production and yield. Farmers can take their production and investment decisions on the basis of their depth knowledge about stability of different crops cultivation. Any financial institution also can judge their repayment capacity and risk bearing ability of the farmers knowing the stability situation of their crop farming (Gangwar et al. 1971).In Bangladesh about 24.6 percent people live under poverty line and almost 40 percent people still in poverty (BBS, 2014). Most of the time animal protein is out of reach from these groups of people. Though fish is comparatively cheaper, fish production is not sufficient to meet up the demand for total population according to their per capita fish requirement, pulse plays a significant role in the case. Quamrun Nahar et al. (2013) stated that per capita fish consumption is only 50 gm per day whereas per day protein requirement of an adult person is minimum 150 gm. In this context pulse necessarily plays a vital role to meet up the protein intake being the proper substitution of animal protein. As it is very cheap compared to any other sources of protein, mass people specially the poor population group easily can meet their daily protein requirement taking pulse with their daily food items. Intake of pulses can promote the proteins from rice sources since restrictive amino acids could be equally enhanced in these two food grains. Because of the pitiable pulse intake (14gm) it can mutually promote only about 25% proteins from rice sources in existing Bangladeshi diets Quamrun Nahar et al. (2013). Although Bangladesh has suitable land and friendly environment for pulse cultivation, it is heavily imported every year as the domestic production of pulse cannot address the quantity demanded domestically. Considering the above circumstances, pulse production should be increased rapidly to improve the national nutritional status along with less outflow of precious foreign currency. There are some study and research on pulse production but we need to pay more attention in this sector to give support with active and fruitful access to receive the technology together with significant market linkage due to get the proper price for the producers. The purpose of this research is to observe that:• Is there any significant change in area, production and yield of pulse in Bangladesh between the period of 1972-2000 and 2001- 2012?• Is there any significant relationship between area and production of pulse in Bangladesh?• Is the production of pulse depends on area in Bangladesh?• What are the growth rate for area, production and yield over the study period?• Has it showed instability during the study period?
2. Methodology
2.1. Data Analysis
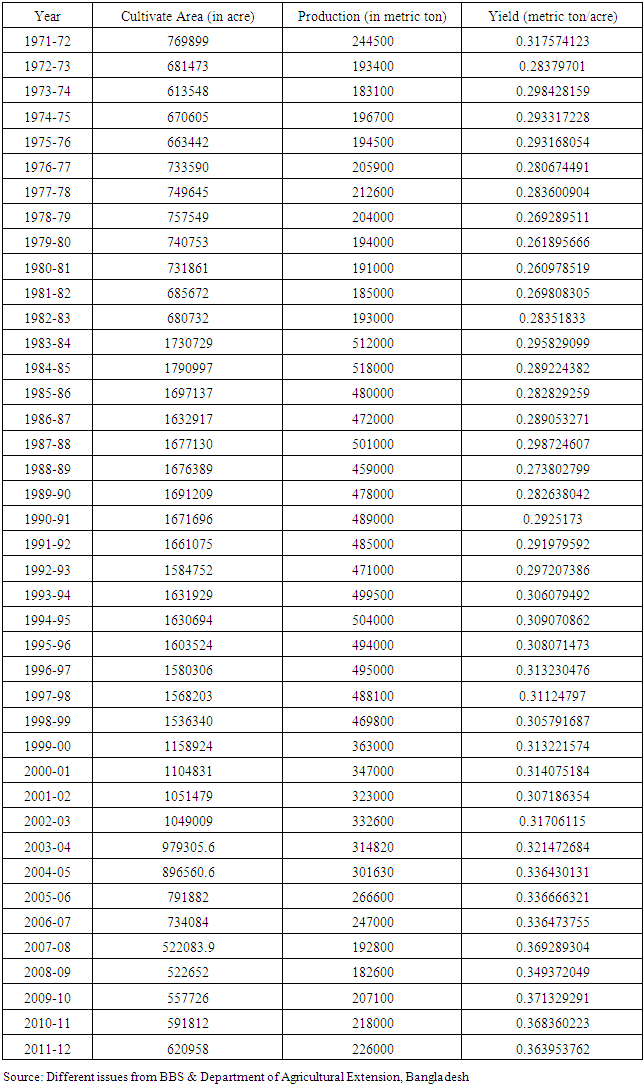
- We collect the data from secondary source on area and production of pulse for the period of 41 years and we considered data after the liberation war as from 1972 to 2012 and we consider major pulses as chick pea (Cicer arietinum), mung bean (Vigna radiata), lentil (Lens culinaris), Grass-pea (athyrus sativus) and mungo bean (Vigna mungo). We have collected these data from different issues of the Statistical Yearbook of Bangladesh which is published by Bangladesh Bureau of Statistics (BBS) and Department of Agricultural Extension (DAE) which are attached in the appendix. This research time period was partitioned into two phases as phase І counted from 1972 to 2000 and the rest one is phase ІІ counted from 2001 to 2012 to compare with in area, production and yield of pulse in Bangladesh.For the measurement of behavior of change, strength of relationship among area, production and yield of pulse, instability, growth rate, dependency of production on area different descriptive statistical tools such as mean, standard deviation, coefficient of variation, correlation coefficient, simple linear regression method, semi log growth model, t test were used. Which is suggested by Hasan, M. N. et al., 2008; Chowdhury, M. et al., 2014; Uddin, M. et al., 2015 to get better evaluation for change and instability measure. We took help for the analysis of this secondary data from SPSS 21.0.
2.2. Measurement of Growth Rate
- To measure the growth rate of rice and other crops in Bangladesh commonly used model is exponential or compound model (Hossain, 1984; Jabber et al., 1997; Akter et al., 2002). Here we fitted semi log model to estimate the growth rate of pulse production, area and yield we as
 where y is the area (in acre), production (in metric ton) and yield (in metric ton/acre) and t is the time period (in year).
 2.3. Correlation and Regression Analysis
- To see the degree of relationship between area and production we find out the value of correlation coefficient r.Where
 and X, Y are two variables like as area and production.To test the dependency of production on area we use simple linear regression model which we can express as
 Where
Where  and y is the production (in metric ton), x is the area (in acre), α is the intercept and β is the regression coefficient of the model.
2.4. Measurement of Instability
- To inspect the impermanence in area, production and yield of pulse in Bangladesh an index of instability was calculated and to see the variability among area, production and yield coefficient of variation (CV) is the most used indicator though simple CV cannot interpret totally the trend component inherent in the time series data. So that we calculate the coefficient of variation around the trend other than the coefficient of variation around the mean which was recommended by Cuddy and Della (1978) as a better measure of instability for time series data. The linear trend model y= α + βx + e provides the index of area, production and yield for the time period from 1972 to 2012 and then the trend coefficient β is tested whether it is significant or not. When the trend coefficient β got as significant then the index of instability that is the coefficient of variation around the trend is as follows:
 Where
Where  and
and  s are the mean and standard deviation of the sample observation and R2 is the coefficient of determination which indicates that how well observation fit a statistical model.
 3. Result and Discussion
3.1. Change in Area, Production and Yield
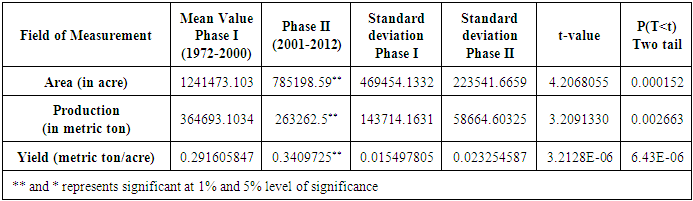
- Here we divide the whole study period into two time periods as phase І we analyze that after the liberation war of Bangladesh i,e, from 1972 to 2000 and then secondly in phase ІІ from 2001 to 2012.From table 1 we can see that the size of land area of pulse reduced in phase ІІ and also the production reduced but one thing here that our study period has been divided into two phases but not equally as in the phase І there is 29 years and in the phase ІІ there is only 12 years and the phase І is more than twice comparing with the phase ІІ. So it was supposed to decrease the production as like area but we found for production the decrease rate is not so high like area. We also display standard deviations of area, production and yield for phase І and phase ІІ due to it is adequate measure comparing all absolute measures of dispersion to measure deviations in time series data (Croxton et Al. 1975). This following table presents t value and p value and depicts that area, production and yield has changed significantly in Bangladesh.
|
3.2. Relationship between Area and Production
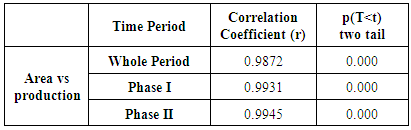
- To estimate the changing behavior of area and production of any crop simple correlation coefficient is widely used. It is disclosed that simple correlation analysis studies only linear relationship and to measure the linear form of relationship scatter diagram is important graphical presentation. The following scatter diagram shows the linear relation between the area and production for the whole time period.From table 2 we can see that area and production of pulse in Bangladesh is strongly correlated for the whole study period and also for the phase І and phase ІІ which is highly significant. For the whole study period the value of r is 0.9872 where for phase І is 0.9931 and for phase ІІ is 0.9945 and these are highly significant which we can observe from p value.
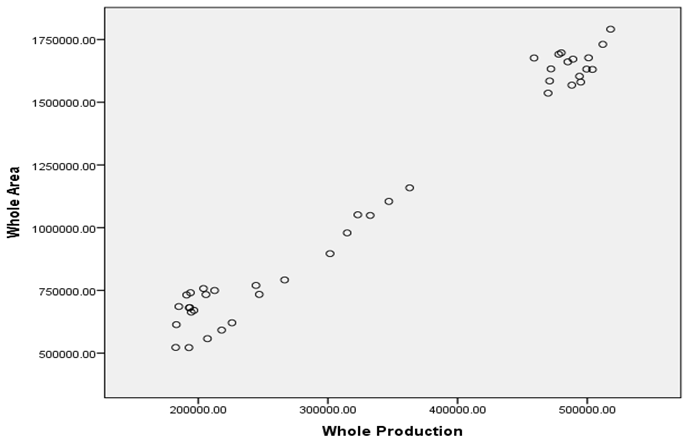 | Figure 1. Scatter plot of area and production |
|
3.3. Regression Analysis
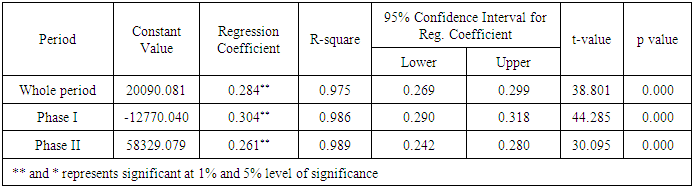
- To see the response of production of pulse on area the simple linear regression models we have used. Table 3 reveals that from the whole time for one unit change in area the pulse production has improved by 0.284 times, from the phase І for one unit change in area the pulse production has rose by 0.304 times and it is grown by 0.261 times for phase ІІ. The R square values are high and the table shows significant results from p values. Here 95% confidence interval for regression coefficient is displayed in this following table which presents two limits of range of values that we can be 95% certain that it contains true value of the population.
|
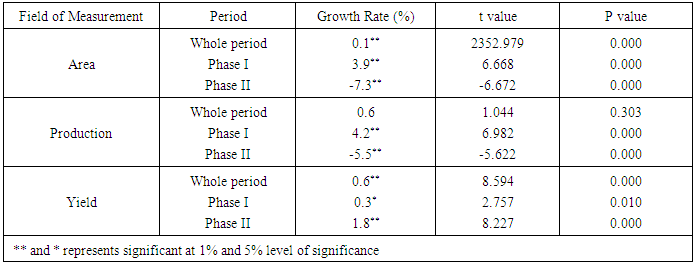
3.4. Growth Rate
- For the time series data growth rate is used to see the change in past and allowable hint of change in future. To evaluate the growth rate of pulse semi log model is used and the analysis presents the growth rate of areas of pulse for phase ІІ is negative and also it is highly significant. Also for production in the phase ІІ we can have a look from table 4 that the growth rate is negative and it is highly significant too.
|
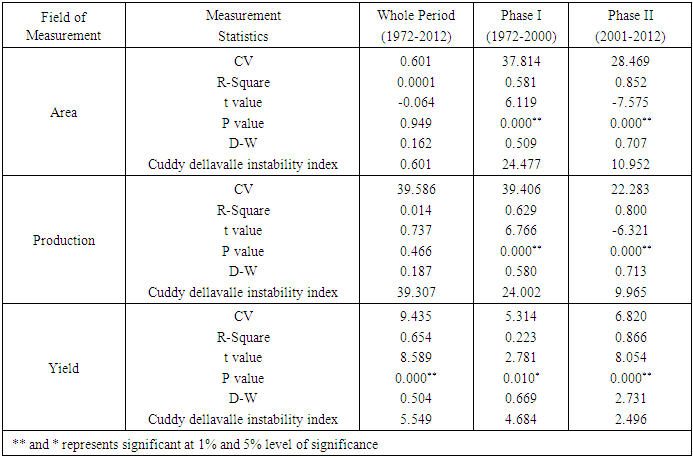
3.5. Instability
- Instability is a necessary judgment parameter in development studies in aspect of agricultural production. Extensive fluctuations affect on prices, income of farmers and sometimes it causes for sharp fluctuations. This fluctuation depends on various things like production technology, weather, availability of input materials and so many factors. For sustainable development of agriculture by low indication of instability eminent growth in production is associated. High instability value shows instable pattern in crop production and also the Cuddy della valle index gives better result than coefficient of variation for time series data. Darbin Watson (D-W) statistic measures auto correlation which is the relationship among values detached from one to another by time lag. If the value of D-W is near to 2 then it tells there is no auto correlation. In Bangladesh also the agricultural production fluctuated by many other factors like floods, droughts etc. It is general view in Bangladesh. The changeability and temporal trends from outputs of some crops as Mango, Potato, Pulses, Jute and Wheat in Bangladesh over 25 years has showed in Khalek (2005). Table 5 shows during the phase І the area of pulse plays the highest degree of instability which is highly significant and during the phase ІІ it is also fluctuated significantly. During the whole time the yield of pulse shows the highest degree of instability and for the production phase І and phase ІІ fluctuated significantly. For area, production and yield R-square value is high in phase ІІ. The Darbin Watson statistics tells the presence of auto correlation. In the following table 5 we includes CV values for area, production and yield and this result fluctuates from one to another among whole period, phase І and phase ІІ. From this analysis we can say that pulse displayed instability during the study period.
|
4. Conclusions
- In Bangladesh pulses are generally called as poor’s men protein. But in these days we cannot fulfill our demand of pulse. We should give more attention to this protein source as the demand is close to 2 million tons but the country generates only 0.53 million tons comparing with total demand (Razzaque, 2000). In this paper we wanted to observe that is there any significant change in area, production and yield of pulse in Bangladesh between the period 1972-2000 and 2001-2012 and from our analysis we found the average area was 1241473.103 acre in the phase І and 785198.59 acre in the phase ІІ which indicates the lost area is 456274.513 acre and the production reduced by 101430.6034 metric ton from phase І to phase ІІ. But yield is increased by 0.04936665 metric ton/acre. There is significant change in area, production and yield of pulse during 1972-2012. We also studied about correlation between area and production and got strong positive correlation for whole period, phase І and phase ІІ. We also tested dependency of production on area and found for one unit change in area production has been changed by 0.304 times in the phase І, 0.261 times in the phase ІІ and the confidence interval for regression coefficient shows the limits. From the result we see the negative growth rate for area and production in phase ІІ and it showed instability during the study period. Many factors affect harmfully in this production. Golder P. C. et al (2013) found some reasons for decreasing trend of area of pulses in Bangladesh likely more profitable crops are available in comparison with pulse, micro-climate fluctuation, high input cost etc. Climate and weather sometime causes instability. Many insects cause harmful damage to pulse crops like as Aphid (Aphis craccivora Koch) is a serious insect of lentil, Pod borer (Helicoverpaarmigera) makes hole in the fruit of chickpea and then eats the seed. Pulse production has shining upcoming days but we need to pay careful endeavor and make awareness for this production.
ACKNOWLEDGEMENTS
- We would like to pay our heartiest thanks to the Bangladesh Bureau of Statistics (BBS) and Department of Agricultural Extension (DAE) of Bangladesh to provide us through their data for this research purpose.
Appendix