A. Y. Omari-Sasu 1, D. Asamoah Owusu 1, M. A. Boateng 2, Z. Sabogu 1
1Mathematics Department, Kwame Nkrumah University of Science and Technology, Kumasi, Ghana
2Engineering Department, Ghana Technology University Campus, Kumasi, Ghana
Correspondence to: M. A. Boateng , Engineering Department, Ghana Technology University Campus, Kumasi, Ghana.
| Email: |  |
Copyright © 2016 Scientific & Academic Publishing. All Rights Reserved.
This work is licensed under the Creative Commons Attribution International License (CC BY).
http://creativecommons.org/licenses/by/4.0/

Abstract
A study of survival rate of TB patients was carried out using secondary data extracted from 85 Tb patients’ records from January 2013 to December 2014 in the Upper West region of Ghana. The Cox Proportional Hazard Model was used to determine the components of the model. Apart from the time to event such as death, each Tb patient had a number of risk factors (covariates) which affected either survival or mortality. The study sought to determine the effect of three factors or covariates on survivorship. The baseline was determined as; a female aged between 0-24 years, who had negative smear TB and was tested negative for HIV and had not started TB treatment. Of all the covariates, TB/HIV co-infection was found to be the most influential covariate or factor that affected the hazard rate or force of mortality. In contrast, Tb treatment was observed to have had significant influence on survivorship. The Cox model therefore provided an estimate of the relative level of an individual’s survivorship in relation to the baseline. Mortality or survival differences occurred as a result of each patient’s predisposing factors such as sex, age, type of TB, co-infection with HIV amongst others.
Keywords:
Tuberculosis, Hazard function, Kaplan-Meier estimate, Survival
Cite this paper: A. Y. Omari-Sasu , D. Asamoah Owusu , M. A. Boateng , Z. Sabogu , Survival Analysis of Tuberculosis Patients in Upper West Region of Ghana, International Journal of Statistics and Applications, Vol. 6 No. 2, 2016, pp. 40-44. doi: 10.5923/j.statistics.20160602.02.
1. Introduction
Tuberculosis (TB) is contagious and airborne. It typically affects the lungs (pulmonary TB) but can affect other sites as well (extra pulmonary TB). The disease is spread in the air when people who are sick with pulmonary TB expel bacteria, for example by coughing. It ranked as the second leading cause of death from a single infectious agent, after the human immunodeficiency virus (HIV). TB has reemerged as a major global public concern since the mid 1980s.The Upper West Regional Directorate (Ghana) and its stakeholders kept their unreserved and integrated efforts in this health problem. Among these efforts was the well-developed Health Management Information System (HMIS) for Tuberculosis programs. However, the direction where Tuberculosis in the Upper West Region of Ghana is headed has not been well analyzed and unpackaged by epidemiological relevant factors. So, what are the factors that affect the survival of TB patients? It might be gender, age and TB patient’s category, type of TB, smear result, HIV and bod weight at initiation of treatments of patients. Therefore, to fill this gap, there was the need to study the factors that are affecting the survival of patients with Tuberculosis. The aim is to estimate the baseline hazard and covariates that affect survival rate of TB patients.In studying survival rate of TB patients, an important measure was the time between response to treatment and recurrence or relapse-free survival time (also called disease-free survival time). The specific difficulties related to survival analysis were largely from the fact that only some individuals had experienced the event of death while only some individuals had experienced the event of death. Some individuals who did not experience the event had their survival times unknown as a subset of the study group. This phenomenon was called censoring and was observed through the following ways: A patient had not yet experienced the relevant outcome, such as relapse or death within the six months period, or a patient was lost to follow up during the study period, or a patient experienced a different a different event that made further follow-up impossible. In survival analysis, subjects were usually followed over a specified time period and the focus was on the time at which the event of interest occurred. Studying the survival patterns in this scenario will be helpful in identifying the risk factors for mortality in these patients and planning effective interventions to further reduce death rates. The objective of the study is to develop a model for estimating survival rates of TB patients in the Upper West Region of Ghana.Several works on Tuberculosis have been carried out and notable amongst these are: Rao et. al (1998), Ajagbe et. al (2014), Pardeshi (2009), Kris et al (2002), Nájera-Ortiz et. al (2012). Shaweno and Worku (2012), Saraceni et. al (2014), Balabanova et. al (2011), Ponnuraja (2013) and Nawumbeni et. al. (2014).
2. Methodology
The object of primary interest is the survival function, conventionally denoted S, which is defined as | (1) |
Where t is some time, T is a random variable denoting the time of death, and Pr refers to probability. That is, the survival function is the probability that the time to death is later than some specified time t. The lifetime distribution function, conventionally denoted F, is defined as the complement of the survival function,  | (2) |
If F is differentiable then the derivative, which is the density function of the lifetime distribution, is conventionally denoted f, | (3) |
The hazard function, is defined as the event rate at time t conditional on survival until time t or later  ,
,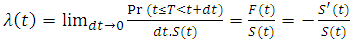 | (4) |
It can alternatively be defined as;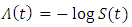 | (5) |
Future lifetime at a given time  is the time remaining until death, given survival to age
  . Thus, it is
  in the present notation. The expected future lifetime is the expected value of future lifetime. The probability of death at or before age
  , given survival until age
  , is;
, is;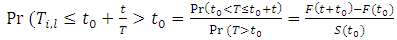 | (6) |
Therefore, the probability density of future lifetime is;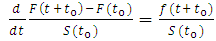 | (7) |
And the expected future lifetime is given as; | (8) |
3. Results
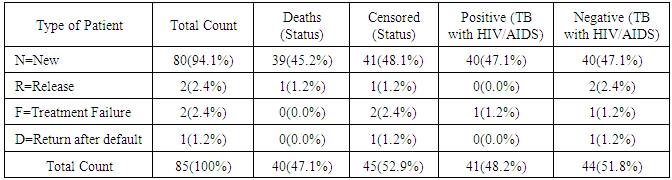
Following a confirmatory test of TB, each patient was further assessed three times, at the beginning, at the end of the intensive phase of TB treatment usually two months and at the end of six months. Twenty (20) of the patients were not put on treatment but were also observed throughout the six months period. The assumption was that the effects of those who were not put on medication were also expected to follow similar survival trend. Generally, the background analysis of the data showed that 63.5% of patients enrolled were males and 40 of them died during the six month period of investigation. 45 patients were censored through the following; a patient did not experience the event of death before the study ends, the patient was lost to follow-up during the study period and the patient withdrew from the study. An overwhelming majority of the patients were new representing 94.1%. Out of this, 39 died and 41 censored.Table 1.
 |
| |
|
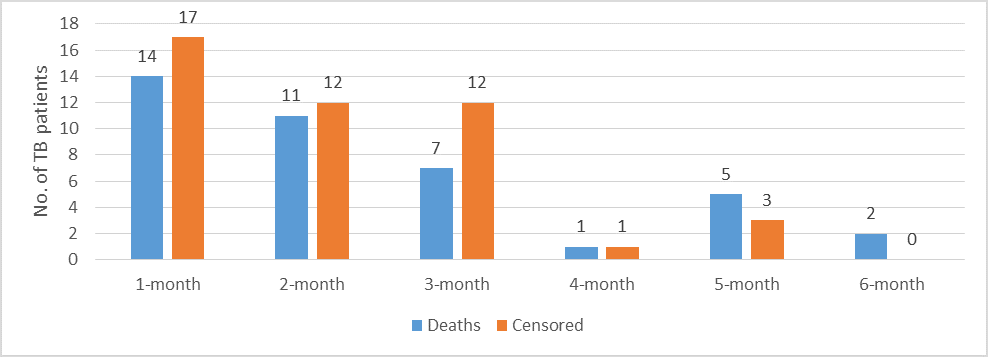 | Figure 1. Graph showing time to events analysis |
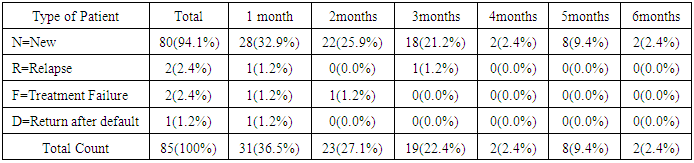
Time to the occurrence of the event of death or otherwise was important for both the Cox and Kaplan-Meier models used in the study. The events of interest rather occurred too early within the first two months representing 54 (63.5%) and an overall cumulative time to event within the first three months of 73 (85.9%). In the study, irrespective of one’s HIV status, most of the deaths occurred during the intensive phase. This might suggest that late presentation was a major factor for early death than HIV infection itself. A Pearson Chi-square test produced a P-value of 0.041.Table 2. Classification of TB patients by observed waiting time
 |
| |
|
The observed waiting time for each individual was ignored for simplicity, however, the observed waiting measured in months was observed for those who were neither censored nor experienced the event of deaths as the event of interest in the investigation. Most of the cases in the relapse, treatment failure and return after default mostly experienced the event within the first two months. The cases which were considered after being censored did not have significant influence on either survivorship or mortality.Two cases of relapse were recorded during the investigation which influenced drug resistance. There was also high treatment success rate as treatment failure amongst the new cases was 2(2.4%) one each during month one and two of the investigation period.
3.1. Comparison between the Cox Proportional Hazard and Kaplan-Meier Estimates
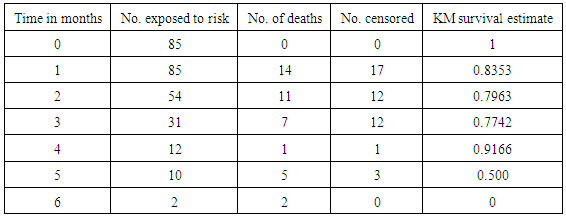
Provided that the assumption of Cox regression were met, it provided better estimates of survival probabilities and cumulative hazard than those provided by the Kaplan-Meier function.Table 3. Analysis of Kaplan-Meier Surival
 |
| |
|
3.2. Cox Proportional Hazard Model
The aim of fitting a Cox model to time-to-event data was to estimate the effect of the covariates on the baseline hazard function. The baseline hazard function, not itself estimated within the model, was the hazard function obtained when all covariates were set to zero.The Kaplan-Meier survival curve (Figure 2) showed statistically lower survivorship of 0.8353 at month one compared to 0.885 for the Cox Proportional hazard model.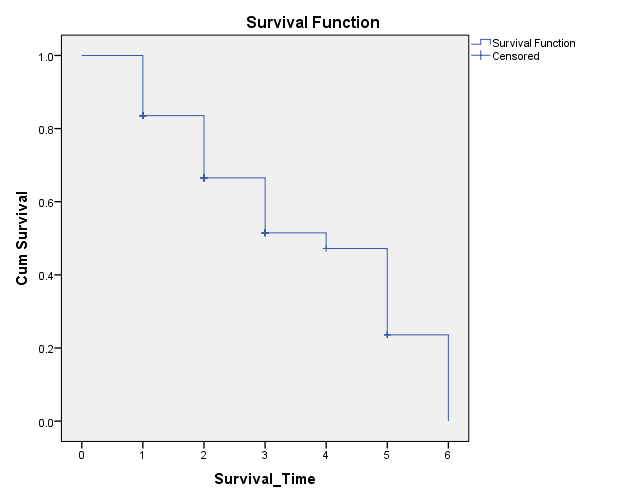 | Figure 2. Kaplan-Meier Survival Curve |
3.3. Determination of Covariates that have Significant Effect on TB Survival
The log likelihood ratio test was employed which has been used extensively as a standard tool for model selection. The maximum likelihood test statistic is assumed to follow a chi-square distribution. Clearly, there were eight (8) explanatory variables that were used in the analysis and part of the modelling process was the selection of those that had significant effects. The full model which included all covariates were used and then those (covariates) with little or no significant effects on the survivorship were eliminated. The minus one survivorship produced the hazard of the model based on the covariates.The omnibus tests of model coefficients using the backward stepwise log likelihood principles were used to determine the most influential survival variables for TB patients. It was not surprising for the TB/HIV co-infection to be isolated as the most influential variable which influenced survivorship. Using the minus one survivorship which measured directly the effect of the covariates on the force of mortality, TB/HIV co-infection was observed to be the most influential in that regard.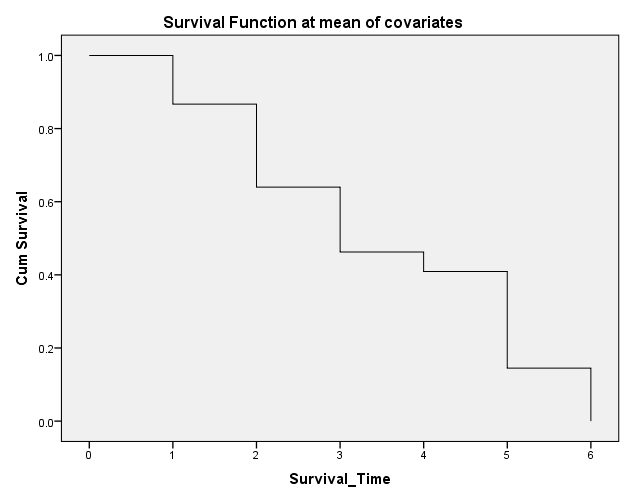 | Figure 3. Cox proportional hazard survival curve for TB patients |
3.4. The Cox Survival Model
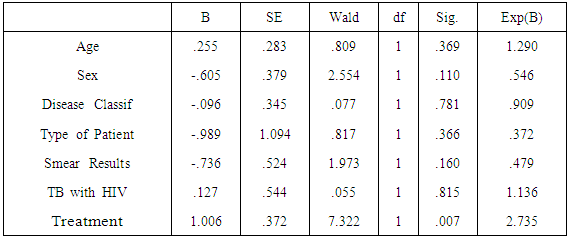
The Cox survival model consists of two parts: the underlying hazard function, often denoted  , describing how the risk of event per time unit changes over time at baseline levels of covariates; and the effect of parameters, describing how the hazard varies in response to explanatory covariates. After fitting the model and analyzing the likelihood ratio statistics, inference about how each covariate affected mortality was determined. This information was used in many different ways. First of all, the survival or hazard of each TB patient could be determined based on the predisposing factors or covariates. The Cox model can provide an estimate of the relative level of an individual’s mortality in comparison to the baseline hazard. By making certain assumptions about the shape and level of the baseline hazard, we can then estimate the absolute level of an individual’s mortality. The coefficients in a Cox proportional model relates to survivorship; a negative coefficient indicates a negative effect on survival and a positive coefficient indicates a positive effect on survivorship.
Table 4. Estimated parameter values
 |
| |
|
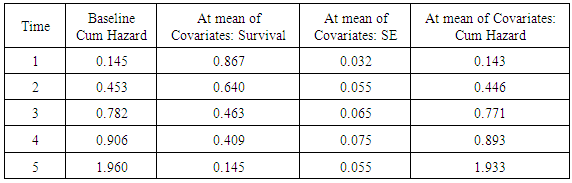
Table 5. Survival Table
 |
| |
|
4. Conclusions
In conclusion, of all the covariates, TB/HIV co-infection was found to be the most influential factor that affected survivorship. The survival rate or hazard rate of each Tb patient was determined based on the predisposing factors or covariates after the model was fitted. The Cox Proportional Hazard model provided an estimate of the relative level of an individual’s survivorship in relation to the baseline. Mortality or survival differences occurred as a result of each patients predisposing factors such as sex, age, type of TB, Co-infection with HIV amongst others. The Ministry of health (Ghana), Ghana Health Service and other stakeholders involved in TB management could use the model to predict the survival rate of TB patients and identify the category of patients that need priority attention in the event of scarce resources.
References
| [1] | DN Rao, PD Shroff, G Chattopadhyay and KA Dinshaw, “Survival analysis of 5595 head and neck cancers -- results of conventional treatment in a high-risk population”, British Journal of Cancer (1998) 77, 1514–1518. doi:10.1038/bjc.1998.249. |
| [2] | Ritesh Singh and Keshab Mukhopadhyay (2011), “Survival analysis in clinical trials: Basics and must know areas”, Perspect Clin Res. 2011 Oct-Dec; 2(4): 145–148, doi: 10.4103/2229-3485.86872. |
| [3] | Ajagbe OB, Kabair Z, O'Connor T (2014) Survival Analysis of Adult Tuberculosis Disease. PLoS ONE 9(11): e112838. doi:10.1371/journal.pone.0112838. |
| [4] | Pardeshi G. Survival analysis and risk factors for death in tuberculosis patients on directly observed treatment-short course. Indian J Med Sci 2009; 63:180-6. |
| [5] | Kris K. Oursler, Richard D. Moore, William R. Bishai, Susan M. Harrington, Diana S. Pope and Richard E. Chaisson (2002), “Survival of Patients with Pulmonary Tuberculosis: Clinical and Molecular Epidemiologic Factors”, Clin Infect Dis. (2002) 34 (6): 752-759. doi: 10.1086/338784. |
| [6] | J. C. Nájera-Ortiz, H. J. Sánchez-Pérez, H. Ochoa-Díaz-López, G. Leal-Fernández and A. Navarro-Giné (2012), “The Poor Survival among Pulmonary Tuberculosis Patients in Chiapas, Mexico: The Case of Los Altos Region”, Tuberculosis Research and Treatment, Volume 2012 (2012), Article ID 708423, 6 pages, http://dx.doi.org/10.1155/2012/708423. |
| [7] | Debebe Shaweno and Alemayehu Worku (2012), “Tuberculosis treatment survival of HIV positive TB patients on directly observed treatment short-course in Southern Ethiopia: A retrospective cohort study”, BMC Research Notes 20125: 682, DOI: 10.1186/1756-0500-5-682. |
| [8] | Valeria Saraceni, Betina Durovni, Solange C. Cavalcante, Silvia Cohn, Antonio Guilherme Pacheco, Lawrence H. Moulton, Richard E. Chaisson, Jonathan E. Golub (2014), “Survival of HIV patients with tuberculosis started on simultaneous or deferred HAART in the THRio cohort, Rio de Janeiro, Brazil”, The Brazilian Journal of Infectious Diseases, Volume 18, Issue 5, September–October 2014, Pages 491–495, doi:10.1016/j.bjid.2014.02.004. |
| [9] | Yanina Balabanova, Birute Radiulyte, Edita Davidaviciene, Richard Hooper, Olga Ignatyeva, Vladyslav Nikolayevskyy, Francis A Drobniewski (2011), “Survival of drug resistant tuberculosis patients in Lithuania: retrospective national cohort study”, BMJ Open 2011; 1:e 000351 doi:10.1136/bmjopen-2011-000351. |
| [10] | Chinnaiyan Ponnuraja (2013), “Survival analysis: Kaplan-Meier and life table estimates for time to event clinical trial tuberculosis data”, Pure and Applied Science, Vol 1, No 1 (2013). |
| [11] | Perrigot, R., Cliquet, G., and Mesbah, M. (2004). Possible applications of survival analysis in franchising research. The International Review of Retail, Distribution and Consumer Research, 14(1): 129–143. |
| [12] | Nawumbeni, D. N., Luguterah, A., and Adampah, T. (2014a). Research on humanities and social sciences. ISSN (Paper) 2224-5766 ISSN (Online), Vol.4, No. 21: 2225–0484. |

 Abstract
 Reference
 Full-Text PDF
 Full-text HTML