-
Paper Information
- Previous Paper
- Paper Submission
-
Journal Information
- About This Journal
- Editorial Board
- Current Issue
- Archive
- Author Guidelines
- Contact Us
International Journal of Statistics and Applications
p-ISSN: 2168-5193 e-ISSN: 2168-5215
2016; 6(1): 8-14
doi:10.5923/j.statistics.20160601.02

High Frequency Exchange Rate Volatility Modelling Using the Multiplicative Component GARCH
 Abstract
 Reference
 Full-Text PDF
 Full-text HTML
Jason Narsoo
Department of Economics and Statistics, Faculty of Social Studies and Humanities, University of Mauritius, Réduit, Mauritius
Correspondence to: Jason Narsoo , Department of Economics and Statistics, Faculty of Social Studies and Humanities, University of Mauritius, Réduit, Mauritius.
| Email: |  |
Copyright © 2016 Scientific & Academic Publishing. All Rights Reserved.
This work is licensed under the Creative Commons Attribution International License (CC BY).
http://creativecommons.org/licenses/by/4.0/

This paper developed a model for forecasting the volatility of intraday exchange rates using time series data. The dataset consisted of 1-minute frequency data of EUR/USD exchange rates for the month of October 2015. The preliminary analyses of the data reveal the presence of seasonal patterns. This observation suggests that basic GARCH-type models are not appropriate for this modelling since they are unable to capture seasonality behaviour, hence the study employed the recently developed Multiplicative Component GARCH model (MC-GARCH). The MC-GARCH assumes the conditional variance to be the multiplicative product of daily volatility forecast, seasonal or diurnal volatility, and stochastic intraday volatility. The daily volatility forecast is calculated using the asymmetric Exponential GARCH (EGARCH(1,1)) model. The modelling and forecasting performance of the MC-GARCH model is evaluated under different innovation distribution specifications, the Gaussian, the symmetric Student’s-t, the skewed Student’s-t and the reparametrised Johnson SU (JSU) distribution. When the estimation procedure is completed, the intraday Value-at-Risk (VaR) is forecasted and assessed using a rolling back-test method. The results show that the MC-GARCH model is suitable to model and forecast the volatility and VaR of intraday EUR/USD exchange rates. The MC-GARCH with an underlying skewed Student’s-t error distribution however performs best compared to other error distributions, in terms of model fitting as well as VaR forecasting performance.
Keywords: Intraday volatility, MC-GARCH model, Innovation distribution, VaR forecast
Cite this paper: Jason Narsoo , High Frequency Exchange Rate Volatility Modelling Using the Multiplicative Component GARCH, International Journal of Statistics and Applications, Vol. 6 No. 1, 2016, pp. 8-14. doi: 10.5923/j.statistics.20160601.02.
Article Outline
1. Introduction
- In the last decade, modelling and forecasting of the volatility of financial returns have become a research area of interest [1]. Volatility modelling is an important tool for policymaking, investment analysis, asset pricing and risk management. In Poon and Granger, 2001 [2], volatility is considered as being a ‘barometer for the vulnerability of financial markets and the economy’. Different classes of volatility models have been developed over time. One of the most impressive productions is the class of Autoregressive Conditional Heteroscedasticity (ARCH) models, which was introduced by Robert Engle in 1982 [3]. Different extensions have been developed since then. After more than thirty years, ARCH-type models still represent the most popular and sophisticated model for volatility analysis. They are indeed largely employed in financial applications by academics as well as practitioners. However, most of the models from the families of ARCH models have been developed for daily or low frequency data and they proved to be inappropriate for high frequency data because such data possess a particular characteristic of seasonality. The studies in [4] indeed demonstrate that in addition to stylized features of non-normality and fat-tailedness, the series exhibit seasonality. With increasing availability of intraday data, volatility modelling and forecasting of high frequency data now has considerable importance and relevance. High frequency data carrying more information of volatility dynamics can significantly improve modelling and forecasting accuracy. Furthermore, the global financial crisis of 2007-2009 has shown that market volatility can move considerably within a few days. These significant movements are not only seen on a daily level but also on an intraday level. That is why the efficient modelling of financial intraday volatility is essential so as to provide a better protection against drastic price fluctuations and hence, major losses [45. Many studies on models for high frequency data have been done. A number of models have been developed by augmenting the ARCH-type family of models. A classic example is the model by Andersen and Bollerslev [6, 7, 8], which aims to deseasonalise the absolute returns. Other model developments include those by Giot [9, 10], Dacorogna and Pictet [11], and Engle and Gallo [12] amongst others. In 2012, Engle & Sokalska [13] introduced the Multiplicative Component GARCH (MC-GARCH) model. It is a parsimonious alternative to the model by Andersen and Bollerslev [6]. The MC-GARCH model assumes a decomposition of the volatility into multiplicative components. These components are indeed relatively easy to estimate and to interpret.In [13], the MC-GARCH was applied on more than 2500 US equities 10-minute returns and the corresponding results revealed interesting forecast performance. The study in [5] employed MC-GARCH model to forecast intraday volatility of Australia’s S&P/ASX-50 stock market as well as the intraday Value at Risk (VaR). The performance of the model was analyzed for three high frequency intraday intervals of 1 minute, 5 minutes and 10 minutes. The overall performance concluded that the MC-GARCH is useful to fit the high frequency intraday returns and to forecast the intraday VaR. In 2015, Diao and Tong applied the MC-GARCH on high-frequency returns of CSI-300 index and concluded that the model performs well in Chinese stock market [14]. We note that in these studies, the underlying innovation of the variance equation is assumed to follow the Gaussian distribution.This paper aims to evaluate the performance of the Multiplicative Component GARCH (MC-GARCH) in modelling and forecasting the intraday volatility and VaR of 1-minute EUR/USD exchange rates data. The accuracy power is also analyzed with different innovation specifications. In this study, the Gaussian, the symmetric Student’s-t, the skewed Student’s-t, and the reparametrised Johnson SU (JSU) distributions are used to model the underlying innovation distribution.
2. Data and Empirical Analysis
- The dataset consists of 1-minute EUR/USD exchange rate data for the month of October 2015. The sample comprises 29,528 observations corresponding to 21 days of intraday data. We calculate the continuously compounded return
 using the following formula:
 where
where  and
and  are the EUR/USD exchange rates at time instants
  and
and  respectively. The time series plot of the corresponding returns
  is displayed in Figure 1.
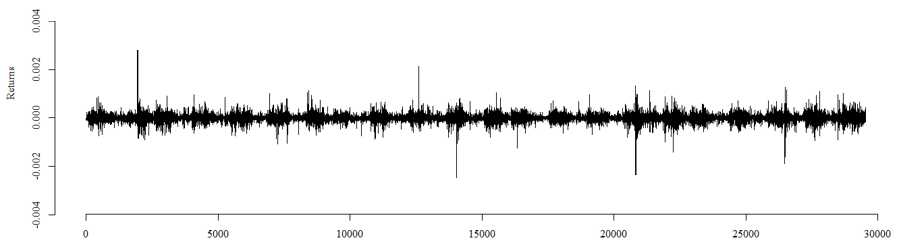 | Figure 1. Time series plot of 1-min EUR/USD returns  |
2.1. Empirical Properties
- The 1-minute EUR/USD exchange rate returns have a mean return approximately equal to zero
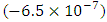 and show a departure from normality behavior; its kurtosis and skewness being respectively equal to 243.8 and 2.2; the distribution being highly leptokurtic and positively skewed. These observations are supported by the graphical tests of normality displayed in Figure 2.
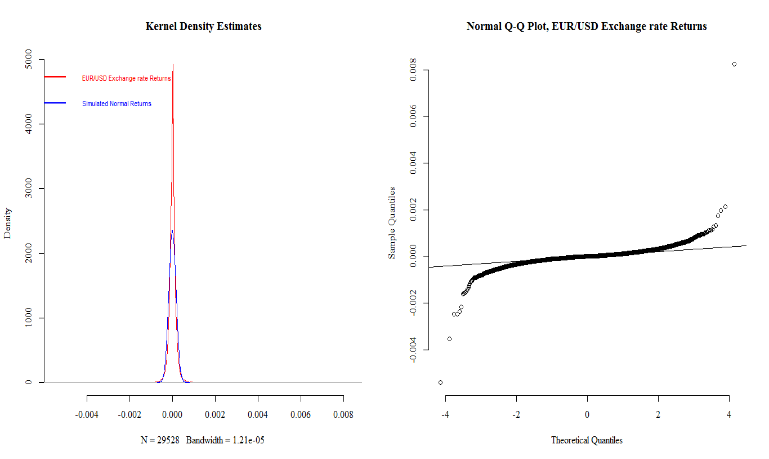 | Figure 2. Graphical tests for normality |
 in the right graph. The Jarque-Bera test provides statistical evidence of the previous observations as it rejects the null hypothesis of normality
 Stationarity behavior and the presence of ARCH effects are investigated on the intraday dataset. The results from the ADF test rejects at the 5% level the null hypothesis assuming the returns series contain a unit root. Stationarity behavior is therefore concluded for the dataset. The Ljung-Box-Pierce test is employed to test for presence of ARCH effects. It rejects the null hypothesis of independence at the 5% significance level hence concludes that ARCH effects are present. The volatility-clustering feature of the data supports the use of ARCH/GARCH family of models for volatility modelling.Figure 3 illustrates the correlogram of the absolute 1-min returns for EUR/USD exchange rates during the month of October 2015.
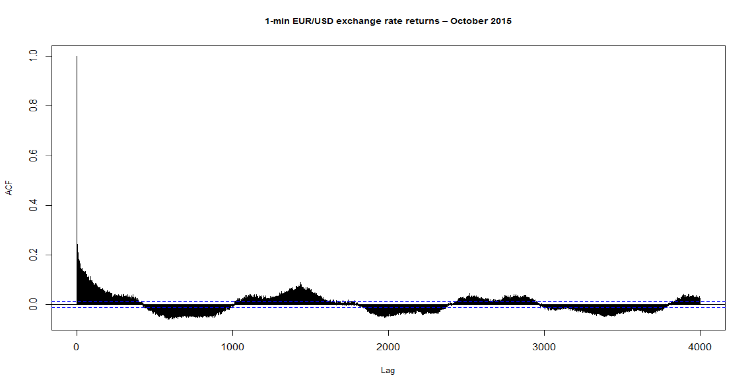 | Figure 3. Correlogram for EUR/USD exchange rate returns |
3. Methodology
- The intraday EUR/USD exchange rate returns are modelled using the Multiplicative Component GARCH model (MC-GARCH). A brief description of the model is presented here. For a full discussion of the model, see Engle and Sokalska, 2011 [13]. The MC-GARCH assumes that the conditional variance of the high frequency return time series is a multiplicative product of three components: the daily, diurnal and stochastic intraday volatility. Let
 denote the conditional compounded return series for an asset
  , where
  represents any particular day and
  is the regularly spaced intraday time period. The MC-GARCH describes the intraday return process of
  by the following process:
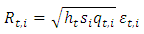 The components of the multiplicative expression are the following:Ÿ
  is the daily variance componentŸ
  is the seasonal or diurnal variance component in each intraday periodŸ
  is the intraday variance componentŸ
  is an error term (also called the standardized innovation) which follows a certain specified distributionThe daily variance component
  can be forecasted using GARCH models [6, 7]. This study uses daily variance forecasts of EUR/USD exchange rates from a GARCH-type model. The choice of this model is specified later in the paper, further to the analysis of the estimation performance of the daily GARCH models. The seasonal or diurnal component
  is estimated as the variance of intraday returns in each regularly spaced intraday time period as follows.
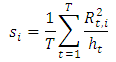 The returns are normalized using the daily and diurnal variance as follows:
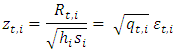 Then the stochastic intraday variance component
  is modelled as a GARCH(p,q) process. The specification of a GARCH(1,1) process which is employed in this paper is given as follows:
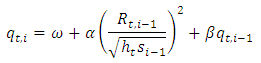
 In this study, the Gaussian distribution, the symmetric Student’s-t distribution, the skewed Student’s-t distribution and the reparametrised Johnson SU distribution (JSU) are employed to model the innovation
  . The performance of MC-GARCH model is compared across the different distributions specified.The fitting of MC-GARCH model on the exchange rate data is performed using ‘rugarch’ package [15]. This implementation makes some additional assumptions which depart from the original methodology in [13] for the MC-GARCH. For example, the conditional mean and variance equations and hence the diurnal component on the residuals from the conditional mean filtration are estimated jointly. Moreover, the diurnal component is estimated using the median rather than the mean function since it provides a more robust alternative given the type and length of the data used in this implementation.
3.1. Intraday VaR Forecast
- Value-at-Risk (VaR) is the most widely used risk metric in market risk management. Portfolio managers, for example, use VaR to measure or assess future market risk. To be able to forecast VaR at an intraday level, the modelling and forecasting of intraday returns are required. In this regard, the MC-GARCH model is also used to forecast the 99% Value-at-Risk (VaR).We choose a moving window of 1 day and the estimation is done after each day or 1500 intraday returns. The intraday dataset is divided into two samples – a 19-day sample for model estimation and a 2-day sample to assess the forecasting power of the model. The 3000 VaR forecasts hence estimated are evaluated against the actual intraday returns using the Kupiec’s unconditional coverage test. This test compares the number of expected versus actual exceedances given the tail probability of VaR [16]. The corresponding null hypothesis assumes that the exceedances are correct.
4. Estimation Results
- In this section, we firstly discuss the choice of the daily GARCH-type model for the estimation of the daily variance forecast
 . Then the results corresponding to the MC-GARCH model estimation and the back-test results for the intraday VaR forecasts are presented and compared on the basis of the different innovation distributions employed.
4.1. Estimation of Daily Variance Forecast ht
- As stated previously, the estimation of the daily variance forecast
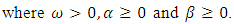
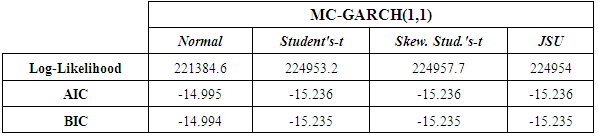
 will require the implementation of a GARCH-type model on daily EUR/USD exchange rate returns. Preliminary analyses on the daily data reveal the presence of stylized features such as departure from normality and the presence of ARCH effects. The results support the implementation of two GARCH models; the symmetric Standard GARCH(1,1) and the asymmetric Exponential GARCH (EGARCH(1,1)). Here also, the innovation distributions specified are the Gaussian distribution, the symmetric Student’s-t distribution, the skewed Student’s-t distribution and the reparametrised Johnson SU distribution (JSU).The results for the two GARCH models with the different underlying error distributions show that all the parameters’ estimates are statistically significant. The significance of the leverage parameter in the EGARCH(1,1) modelling confirms the presence of leverage effect in the daily returns of the exchange rate data, hence supporting the appropriateness of an asymmetric GARCH over a symmetric GARCH model in this context. The best GARCH model is therefore selected on the basis of the highest Log-Likelihood and the lowest AIC and BIC scores. The results for the model selection criteria are displayed in Table 1. The best model is the one with the highest Log Likelihood and the lowest AIC and BIC statistics.
 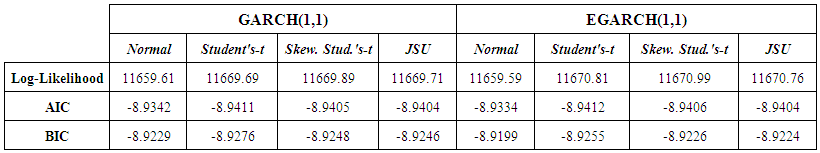 | Table 1. Results for model estimation of daily EUR/USD exchange rate returns |
 in the MC-GARCH modelling.
4.2. Performance of the MC-GARCH Model
- The MC-GARCH model is estimated using the complete dataset of 1-min intraday EUR/USD exchange rate returns. The corresponding results for parameter estimates are displayed in Table 2.
|
 clearly support the specification of the error term
  following non-normal distributions in the MC-GARCH model framework. For the comparison of results, the Log-Likelihood, the AIC and BIC criteria scores are employed. The corresponding results are displayed in Table 3.
|
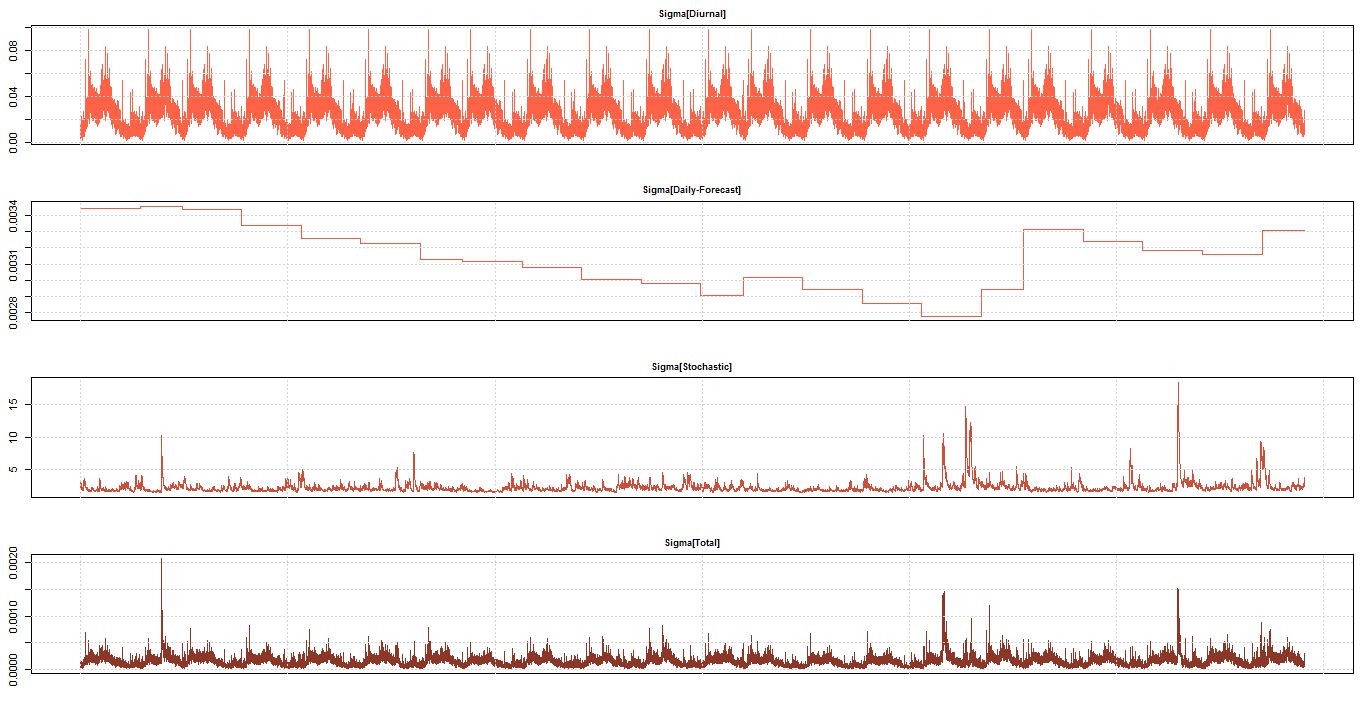 | Figure 4. Volatility Components for 1-min returns under MC-GARCH with skewed Student’s-t distribution |
4.3. Intraday VaR Forecast
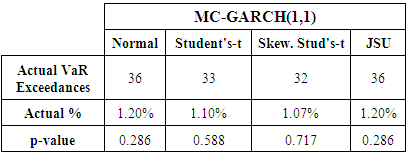
- The back-test results for the intraday VaR forecasts are displayed in Table 4. The expected number of VaR exceedances is 30 out of 3000 observations, hence an expected % exceedance of 1%.
|
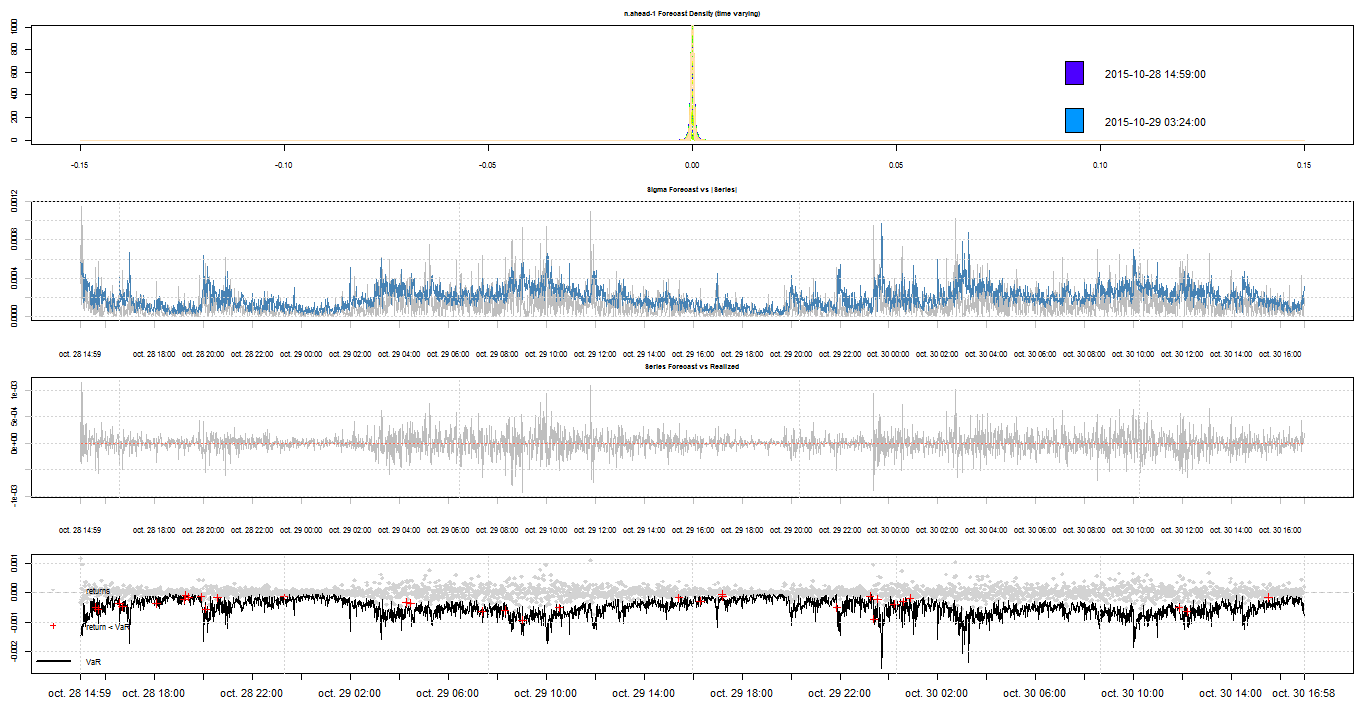 | Figure 5. Intraday VaR forecasts under MC-GARCH with skewed Student’s-t distribution |
5. Conclusions
- This study has performed the modelling of intraday EUR/USD exchange rate returns using the recently developed MC-GARCH. The intraday VaR is also forecasted and assessed using a rolling back-test method. In the process, we assumed in the specification of the MC-GARCH model that the innovation term follows one of the following distributions – the Gaussian distribution, the symmetric Student’s-t distribution, the skewed Student’s-t distribution and the reparametrised Johnson SU distribution (JSU). Overall, the results show that the MC-GARCH model is indeed appropriate to model and forecast the returns and VaR of intraday EUR/USD exchange rates. However, the MC-GARCH with an underlying skewed Student’s-t error distribution performs best compared to the other error distributions, in terms of model fitting as well as VaR forecasting performance. An extension of this study could be to investigate the modelling and forecasting performance of the MC-GARCH model with different innovation specifications when higher or lower frequency exchange rate data are employed.
ACKNOWLEDGEMENTS
- The author is grateful to Jayvesh Nundoo for making EUR/USD exchange rate data available.