I. C. A. Oyeka , E. U. Umeh
Department of Statistics, Nnamdi Azikiwe University, Awka, Nigeria
Correspondence to: E. U. Umeh , Department of Statistics, Nnamdi Azikiwe University, Awka, Nigeria.
| Email: |  |
Copyright © 2016 Scientific & Academic Publishing. All Rights Reserved.
This work is licensed under the Creative Commons Attribution International License (CC BY).
http://creativecommons.org/licenses/by/4.0/

Abstract
This paper develops and presents use of dummy variable regression models in the analysis of results from diagnostic screening tests or clinical trials with several case-control subject response options or categories, with replications in each case-control response category or combination. The proposed method can also be used in comparing differences between proportions of case and control subjects responding positive under various case-control response categories or options. Test statistics are developed for testing the null hypotheses that the regression model is an adequate representation of the differences in scores or responses between pairs of case and control subjects in diagnostic screening tests and for comparing the responses of cases and controls in the paired case-control subject response categories. Test statistics are also developed for use in pairwise comparisons of the effect of scores by case-control subject at various response categories. Corresponding probabilities, odds and odds-ratios of positive responses are also estimated using the resulting regression coefficients. The proposed method is illustrated with some data.
Keywords:
Dummy Variables, Standard drug, New drug, Probabilities, Odds and Odds Ratio, Replications
Cite this paper: I. C. A. Oyeka , E. U. Umeh , Dummy Variable Regression Models and Analysis of Responses in Diagnostic Screening Tests with Replications, International Journal of Statistics and Applications, Vol. 6 No. 1, 2016, pp. 1-7. doi: 10.5923/j.statistics.20160601.01.
1. Introduction
Often in controlled comparative either prospective, retrospective or cross –sectional study involving matched samples of subjects or patients, the response of a subject or patient to a predisposing factor in a retrospective study or to a condition or treatment in a prospective study may be dichotomous but more often much finer than simply dichotomous. These responses may be of such form as yes or no, present or absent, alive or dead, positive or negative, etc. But there may also be several other possible response options. For example, in a retrospective study where the predisposing factor of a certain conditions is the respondents drinking habit, a subject may be classified as a teetotler, a light drinker or a heavy drinker etc. in a prospective study involving same conditions or test, a patient may be classified as recovered, much improved, improved, no change, worse or dead. A treatment or drug may be graded as very effective, effective or ineffective etc.Furthermore there may not be only one pair but several pairs of case control subject combinations and other such situations. Thus specifically suppose we have a total random sample of n- matched pairs of patients or subjects matched on certain characteristics to be exposed to two treatments, drugs, tests; suppose  pairs of these subject pairs are in the
  response category by case and
  response category by the control subject, for
  responses. In other words, suppose, one member of each pair of subjects or patients in the
  case control response combination is exposed to one under control of the two treatments, drugs, tests or procedures of interest and the other member of pair is exposed to the remaining (case, new drug) treatment, drug, test or procedure
  Furthermore, suppose that the response of members of each pair of case-control subjects or patients are more than dichotomous but numbering some c
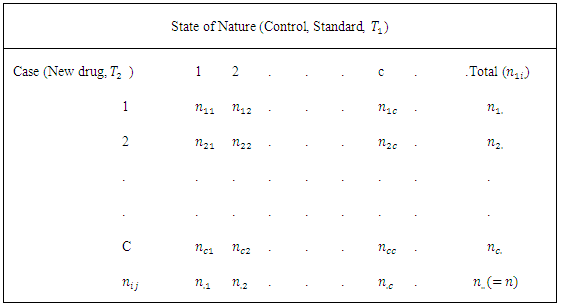
  possible mutually exclusive response options or categories. In Table 1, there is no replication, that is, there is only one pair of case-control subjects. Of the
  pairs of case-control subjects used in the study,
  and
and  are subjects respectively in the
  response category for case and
  response category for control while
  pairs are in the
  pair of case-control subject response category for
  response categories.
Table 1. Format for presentation of results in diagnostic screening tests with “c” outcomes
 |
| |
|
Results from these types of study may be analyzed using several methods for example Backpar (1966); Grizzle, Starmer and Kosh (1959), Ireland, Ku and Kullback (1969); Staurt (1955) and Maxwell (1970), if  or the more generalised method can be used. We present an alternative method of analysis in terms of probabilities, odds and odds-ratios of occurrence of outcomes using dummy variable regression techniques.The proposed method assumes that there are replications; that is, there is more than one pair of case-control subjects in various case-control subject treatment combinations. It is however, for simplicity, assumed that there are no interactions between combinations or that such interaction have been removed by appropriated data transformation.
2. The Proposed Method
Suppose the  pair of case-control subjects or patients is selected and members of the selected pair are each randomly assigned to treatments
  or
or  and their various responses are recorded for
  pairs;
  responses and
  is the total number of pairs of case-control subjects studied. As already noted above, the responses by members of each matched pairs of subjects or patients are classified into c-possible mutually exclusive categories or classes. Suppose that the responses by both case and control subjects and patients are quantitative and can assume all possible values on non negative real number line.Now. let
  be the
  pair of the scores or responses by case administered treatment
  responding at the
  response option or category and the corresponding control subject or patient administered treatment
  responding at the
  response option or category for

 | (1) |
be the difference between the scores by case administered treatment  responding at the
  response category and the corresponding control subject or patient administered treatment
  responding at the
  response category by the
  pair of case-control subjects or patients on the condition of interest for
 Also, let
 | (2) |
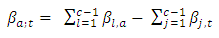
 We propose, develop and present the use of dummy variable regression models in the analysis of diagnostic screening test results with several case-control subject –response options or categories
  with replications in each case-control response categories or combination and for comparing the differences between proportion of cases and controls subjects responding under various response categories or options. (Fleiss (1981), Ryan (1997)Consistent with the use of dummy variable in regression models (Boyle 1975), we represent the c-response categories or options by case a that is, “c” levels of
  with
with  dummy variables of
  and also the “c” response categories or options by control, “t”, that is, the “c” levels of
  by
by  dummy variables of
  Hence using the difference
  between the scores by the
  pair of case - control subjects or patients
  as the dependent or criterion variable, we may now define
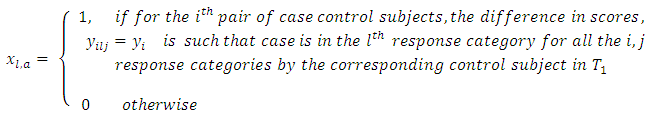
 Also let
 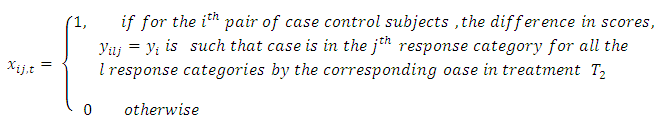 Above expression is Equation (4). For
  and some
  .Using these dummy variables, set up a dummy variable multiple regression model of
  regressing on the
  dummy variables of 1s and 0s of Eqn 3 and 4 expressing the dependence of the relative magnitude of the differences
  between the scores of the
 in the screening tests as
  | (5) |
Equation 5 is the probability that the  randomly selected case-control pair of responses on a given condition the score by case administered treatment
  (new drugs) is on the average higher (better, greater, less serious) than the score by the corresponding control subject administered treatment
  (standard drugs) or vise versa. The odds of occurrence of this events, that is, the odds that for the
  case-control treatment combination, the response by case administered treatment
  is higher (better, greater, less serious) than the response or score by the corresponding control subject administered treatment
  is
is 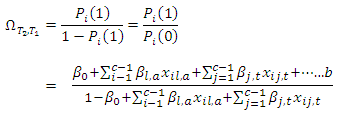 | (6) |

 are dummy variables of
  are partial regression coefficients and
  are error terms with
  Now, the expected value or mean of
  ; the relative difference in scores or responses by the
  when the case responds at the
  response category and control subject responds at the
  response category or option is
 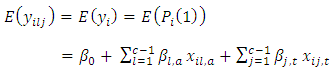 | (7) |
Equation 5 may be alternatively expressed in matrix form as 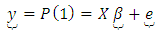 | (8) |
where  is an
is an  column vector of
  as specified in equation 1, X is an
  design matrix of
  where
where 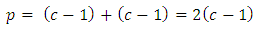 dummy variables of
  representing the
  response categories included in the regression model,
  are partial regression coefficients and
  is an
is an  column vector of error terms with
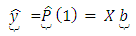
  The expected value of
  is
is 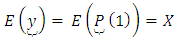 | (9) |
Use of the usual methods of least squares with either Equations 2 or 4 yields unbiased estimates of the regression parameter  as
as 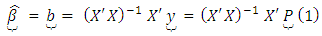 | (10) |
where  is the matrix inverse of the non singular variance – covariance matrix
  with full column rank
 | (11) |
A null hypothesis that maybe of interest is that the regression model of either Equations 4 or 7 fits; that is, it is adequate representation of differences in scores or responses between pairs of case and control subjects in diagnostic screening tests. This is equivalent to the null hypothesis.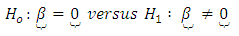 | (12) |
The null hypothesis  of Equation 11 is tested using the usual F test presented in the traditional analysis of variance Table.The null hypothesis
  of Equation 11 is rejected at the
  if the calculated F ratio is greater than the tabulated or critical F ratio with “p’ and
  degrees of freedom; that is, if
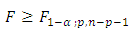 Otherwise
  is accepted.If the null hypothesis
  of Equation 11 is rejected, in which case not all the
  are equal to zero, then one may proceed further to determine which of these regression coefficients or their combinations are statistically different from zero and hence, may have been responsible for the rejection of
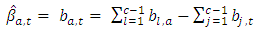
  . In particular, one may wish to compare the responses of cases and controls in the paired case-control subject responses or scores.Note that the expected difference in scores or responses between case and control subjects when the responses by the control subjects in the paired case-control subjects responses are held at constant level, that is when the mean response or score by case in all the pairs is of interest, is obtained by setting
  in Equation 5 yielding
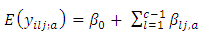 | (13) |
Similarly, the expected difference in scores or responses between case and control subjects when the response by case in the paired case-control responses or scores are held at constant levels, that is when the mean response or score by the control subjects in all the pairs of interest is obtained by setting 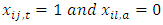 in Equation 5 yielding
 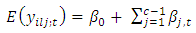 | (14) |
 | (15) |
 | (16) |
Having rejected the initial null hypothesis  of Equation 11, one may then wish to test the null hypothesis that
  is equal to some specified value say
  that is
 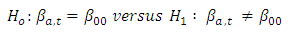 | (17) |
The null hypothesis  of Equation 16 is tested using the “t” test statistic
 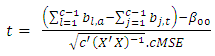 | (18) |
where  is a
is a  row vector of
  with
with  occurring at
  and
and  occurring at
 , and MSE is the error mean sum of squares obtained from the corresponding analysis of variance Table.The null hypothesis of Equation 16 is rejected at the
  level of significance if
  otherwise
  is accepted. Further research interest may also be in performing pairwise comparison of the effects scores by case and control subject at the
  response category for case and
  response category for control subjects have on the variation in the differences between scores or responses by the
  pair of case-control subjects in the two response categories. This is equivalent to testing the null hypothesis
 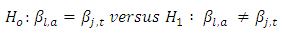 | (19) |
 The null hypothesis of Equation 18 is tested using the student “t” test statistic;
 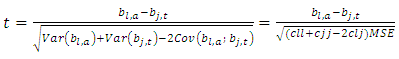 | (20) |
 is the element in the
  row and
  column of
  for
for 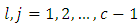 The null hypothesis
  of Equation 18 is rejected at the
  level of significance if
  is satisfied otherwise
  is accepted.If in particular, the “c” response categories are ordered from the least serious (most serious) or the most serious (least serious) or if any of the response categories is treated or known to be in the best (least serious) condition or the worst (most serious) condition, then, the null hypothesis of Equation 18 would be equivalent to testing the null hypothesis that pairs of case-control subjects are equivalent in the same level of seriousness or condition in the test being conducted. The test statistic of Equation 19 is used to test this null hypothesis; that is, the null hypothesis that case and control subjects are in the same condition, that is, do not differ in their responses or scores in the screening test. Note that in practice, the data of interest are not usually in their summary form as frequencies as in Table 1 but as raw scores, that is, pairs of case-control subject responses or scores
  in these cases, the frequencies if required may nevertheless be obtained from the design matrix X used for the analysis. In other words, the cell frequencies
  are obtained from the columns X as;
 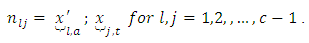 | (21) |
Also,  and
and  are obtained as the scores in the omitted categories for case
  and control
  response categories respectively.
  | (22) |
 The number of pairs of case-control responses or scores
  in the
  case –control response category, that is the number of scores common to the “omitted categories” for case and control subjects in the design matrix X of the regression model is obtained as the number of zeros common to all the
  “included categories” for case and control subjects respectively, or equivalently as
 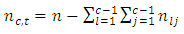 | (23) |
with these frequencies, one may now apply an alternative generalized method based on only frequencies (Oyeka et al, 2013) to the data for comparative purposes.
2.1. Illustrative Example
We, now use data on matched subjects of  matched patients from a controlled comparative clinical trial who manifest four possible responses to illustrate the proposed method. Suppose the data in Table 2 are obtained by assigning a standard treatment
  regarded as control drug and a new treatment
  regarded as case at random to members of each pair of a random sample of 54 pairs of case and control malaria patients matched on age, gender and body weight used in controlled clinical trials to compare the effectiveness of two malaria drugs.
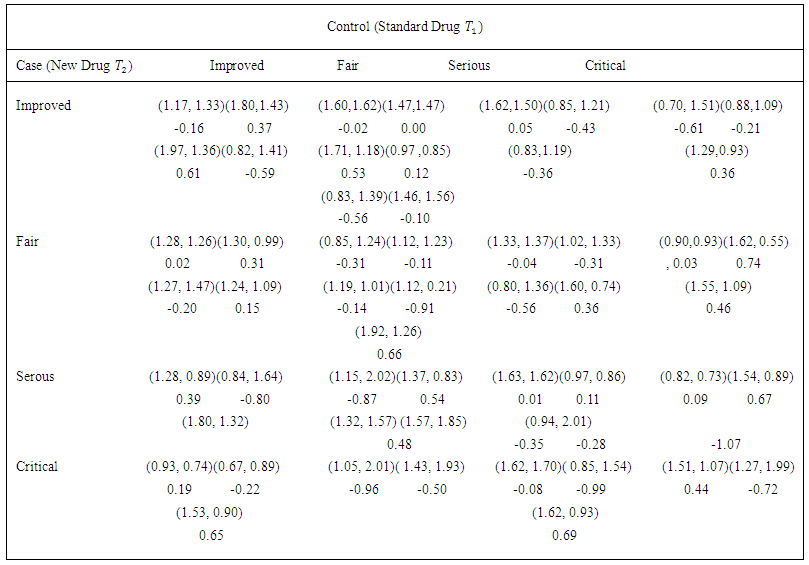 | Table 2. Sample Data of Response Scores by Malaria patients in controlled Clinical Trials with Replications |
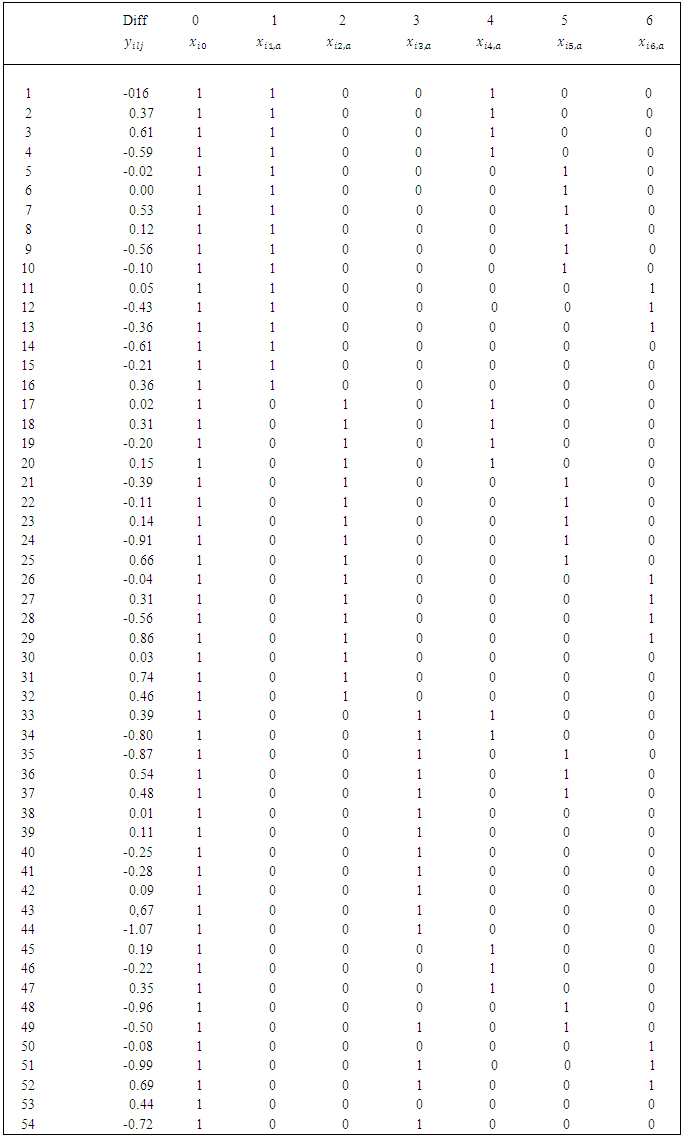
Using these  values of Table 2 with Equations 1-4, we obtain the design matrix X shown in Table 3 for use in the regression model of Equation 9.
Table 3. Design Matrix X for the data of Table 2
 |
| |
|
Using the design matrix X of Table 3 in Equation 6, we obtain the fitted dummy variable regression model of the difference in case-control subject response scores as function of the seriousness of it or levels of these responses as  | (23) |
The fitted regression model of Equation 23 with an  independent variables can explain only about 5 percent of the total variation in case and control subjects in their response scores, suggesting that its regression coefficients are all probably not different from zero.With these conclusions, further analysis would ordinarily become unnecessary, however, for illustrative purposes only, one could assume that not all the regression coefficients are zero thereby enabling some comparisons of these parameters if so desire.
3. Summary and Conclusions
From the result of the analysis,  implies that independent variables can only explain 5 percent of the total variation in case and control subjects in their response scores, suggesting that its regression coefficients are all probably not different from zero (insignificant). Also, the p-value of 0.869 indicates that the model is insignificant. The illustrative example shows that the proposed method is adequate for modeling and determination of significance/insignificance models.
References
| [1] | V.P. Backpar (1966): A note on the equivalence of two test criteria for hypotheses in categorical data. Journal of the American Statistical Association, 1966, 61, 228-235. |
| [2] | C. R. Boyles (1975). A problem based learning approach to teaching biostatistics. Journal of Statistics Education vol.7, n. 1. |
| [3] | JL Fleiss (1981). Statistical methods for rates and proportions (second ed.) New York: Wiley, 1981. |
| [4] | J. F. Grizzle., C. F. Starmer and G. G. Koch. (1969): Analysis of categorical data by linear models Biometrics. |
| [5] | C. Ireland, H.H. Ku, and S. Kullback (1969): Symmetry and marginal homogeneity of an r × r contingency table. J. Am. Stat. Assoc. 64, 1323-1341. |
| [6] | A.E Maxwell (1970): Comparing the classification of subjects by two independent judges. British Journal of Psychiatry, 1970, 116, 651-655. |
| [7] | I.C.A. Oyeka, and, U.M. Okeh. (2013) Estimation of subject specific index of relative performance in “K” samples. American Journal of theoretical and applied statistics vol. 2 pg 154-165. |
| [8] | T.. Ryan, (1997), Modern Regression Methods, John Wiley. |
| [9] | T. P. Ryan, and N. C. Schwertman, (1997). "Optimal limits for attributes control charts", Journal of Quality Technology, 29 (1), 86-98. |
| [10] | A.A. Staurt. (1955): A test for homogeneity of the marginal distributions in a two-way classification. Biometrika, 1955, 42, 412-416. |

 Abstract
 Reference
 Full-Text PDF
 Full-text HTML