Asemota O. J., Ogujiuba K. K., Aderemi T. A., Mustapha S. A.
Department of Research and Training, National Institute for Legislative Studies, National Assembly, Abuja
Correspondence to: Asemota O. J., Department of Research and Training, National Institute for Legislative Studies, National Assembly, Abuja.
| Email: |  |
Copyright © 2015 Scientific & Academic Publishing. All Rights Reserved.
This work is licensed under the Creative Commons Attribution International License (CC BY).
http://creativecommons.org/licenses/by/4.0/

Abstract
Teledensity in Nigeria has witnessed unprecedented growth in recent years. The growing demand for mobile data services in Nigeria’s telecommunication industry is expected to boost government revenue at a period of dwindling in oil prices. Hence, it is imperative to examine the benefits, challenges and forecast future trend of teledensity in Nigeria. This paper seeks the most appropriate specification to analyse and forecast a realization of Nigeria’s teledensity using monthly time series from 2000 to 2015. We employed the Autoregressive Integrated Moving Average (ARIMA) to model the dynamic features in the teledensity data. Our results clearly indicate that the ARIMA (1, 1, ||1, 2, 3, 4, 9||) is found to provide the best satisfactory fit in the class of the estimated models. The fitted ARIMA model passed all the diagnostic tests at conventional level of significance. The forecasted values indicate that the Nigeria’s teledensity will continue to increase over time. Howbeit, the trend analysis indicates that the rate of growth of secured internet in Nigeria is quite dawdling. With the growing threats of cyber-criminal activities associated with the increasing teledensity, we therefore, urge the National Assembly to expedite actions towards the speedy passage of the Cyber Crime Bill. Furthermore, the National Assembly needs to provide legislative backing to the protection of telecommunication infrastructures by expediting actions regarding the passage of the Critical National Infrastructure (CNI) Bill as this will help to boost the growth witnessed in the telecommunication industry and increased the revenue base of the government.
Keywords:
ARIMA models, Stationarity, Correlogram, AIC, Forecasting, Teledensity
Cite this paper: Asemota O. J., Ogujiuba K. K., Aderemi T. A., Mustapha S. A., Modelling and Forecasting Teledensity Using Univariate Time Series Models: Evidence from Nigeria, International Journal of Statistics and Applications, Vol. 5 No. 6, 2015, pp. 279-287. doi: 10.5923/j.statistics.20150506.03.
1. Teledensity in Nigeria
Teledensity has witnessed unprecedented growth in recent years in Nigeria. The transparent independent regulatory regime put in place by the President Olusegun Obasanjo democratic government and the large market in Nigeria have been fascinating and attracting investors (both foreign and local) to telecommunication sector. When Nigeria gained independence in 1960, there were only 18,724 functional telephone lines for an estimated population of 45 million, which is about 0.04 teledensity (See, Shoewu and Edeko 2011). However, between 1960 and year 2000, the active subscriber base grew to 400,000 fixed lines for the then estimated 120 million of population. This period was characterized by few confinements and monopolistic operations in the telecommunications industry (NCC, 2011). Though the deregulation of the telecommunications sector started in 1993 with the establishment of the Nigerian Communications Commission (NCC) by Decree 75 of 1992, some segments of the sector were still subjected to monopolistic operations until the operators came under the oversight of the telecom regulator (NCC) in 2001. The strong desire of the democratic government led by President Olusegun Obasanjo to liberalize the sector and the subsequent empowerment of the NCC led to an unprecedented growth in the sector. The teledensity which is now standing at 104.69 as at May, 2015 is presently the highest in Africa. In terms of the growth rate, Nigeria is ranked as the fastest and largest growing telecom market in Africa and among the ten fastest growing telecom market in the world. Teledensity indicates the percentage of a country’s population with access to telephony services as determined by the active subscriber base. According to the National Bureau of Statistics (NBS, 2015), a total of 95.89 million active lines were registered by the telecommunication industry across the various networks in 2011. The number of active lines grew significantly from a total of 113.20 million active lines in 2012 to a total of 127.61 million active lines in 2013. The mobile subscriber base is expected to rise to 182 million in the next five years. The growing demand for mobile data services in Nigeria’s telecommunication industry is expected to increase service revenues by 18.5%, to $10.9 billion in 2019, as against $9.2 billion in 2013 (Businessday, 16 February 2015, p.1). This expected revenue growth is coming at a period of dwindling government revenue caused by the decline in oil prices. The current economicscenario and low oil prices have led to the depreciation of the naira against the US dollar, but the telecoms sector is expected to aid the country’s diversification of its revenue sources.This paper seeks to provide the most appropriate ARIMA model to analyse and forecast Nigeria’s teledensity using data from 2002 to 2014. The rest of the paper is structured as follows; section 2 presents a stylized facts on the nexus between teledensity, economic growth and cyber security, section 3 presents the modeling methodology, empirical results are presented in section 4, section 4 presents forecasting with the fitted model. The last section concludes with summary of the findings and policy recommendations.
2. Stylized Facts: Nexus between Tele-density, Cyber threats and Economic Growth
Teledensity is highly correlated with the per capita income and often used as an indicator for economic development of a country or region. The economic benefits of the improved telecommunications services cannot be overemphasized. It has a significant transformative effect on how people work and live. It can facilitate economic development through e-commerce and m-commerce. This will create new jobs opportunities and provide access to global markets. It will also enhance the cashless policy currently advocated by the Central Bank of Nigeria (CBN). It will also enhance research, e-learning and distant learning activities. Sharing of educational resources and the National Open University program will benefit from an improved internet penetration. Furthermore, it will enhance e-governance by readily providing information about government policies, procedures, benefits, and programs.Empirical studies (see for example, ITU 2012, Qiang and Rossotto, 2009) have confirmed the high potential economic gains from improved telecommunications technology. Some of these gains are higher productivity, lower costs, new economic opportunities, job creation, innovations, and increased trade and export. For example, Qiang and Rossotto (2009) finds that, a 10% increase in broadband penetration leads to an increase in 1.38% of economic growth for low and middle income economies while a 10% increase in broadband penetration yields an additional 1.21% increase in GDP for high-income countries. Mehmood and Mustafa (2014) employing fixed effects with Driscoll and Kraay standard errors, found positive effect of broadband on economic growth in 24 Asian countries. Kongaut et al. (2014) also found positive impact of broadband on the GDP of the OECD countries. Their regression results indicate that a 10% increase in broadband speed positively increase GDP per capita by 0.8% for the OECD countries. In addition, their analysis compared the impact on high income countries and the low income countries. The authors found that mobile broadband has greater positive effects in low income countries than in higher income countries. Zeb et al. (2014) empirical analysis found positive significant effect of telecom services in attracting FDI to Pakistan. The rising tele-density and increasing broadband penetration has ironically led to an increase in cybercrimes in Nigeria. The rate of e-crime in Nigeria has outgrown the rate of Internet usage in the country. Currently, Nigeria ranked 8th position globally in terms of internet usage by numbers and rank 3rd in global cybercrime (Businessday, 17 February 2015, p.38). The prevalence of cybercrimes in Nigeria is a testament to the Cyber Security Risk Paradox which postulates that, the less developed countries experience increase in cybercriminal activities as the rate of internet users increases. The reason for this paradox is not far-fetched. As technology advances and internet users’ increase in developed countries, there is a corresponding improvement in cyber security as a result of a proportionate growth in secured internet servers. However, for the developing and less developed countries, as the teledensity and rate of internet users’ increase, the rate of growth of secured internet services increases at a disproportionate rate. Consequently creating a haven for proliferations of cybercriminal activities. Nigeria currently has very low number of secured internet servers (see figure 1).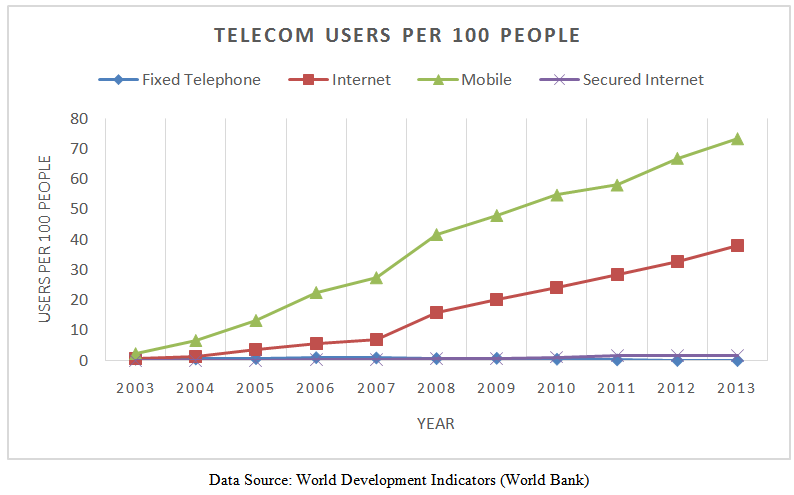 | Figure 1. Telecommunication Users and Secured Internet |
Hence, what are the factors that make Nigerians so vulnerable to e-crime? These factors are multifarious. They include; unemployment, poverty rate, corruption, greed, proliferation of cybercafés and lack of functional data base. In a policy context, cyber security represents the collective activities and resources that enable citizens, organizations and governments to meet their computing objectives in a secure, private, and reliable manner. While cybercrime refers to the use of internet to carry out fraudulent activities. Some of the common cybercrimes which are enumerated in the Nigerian cybercrime Bill 2013 include; the unlawful access to a person’s computer, the unlawful interference with a computer system or other electronic devices, the use of computer or electronic device to produce, promote and distribute child’s pornography materials, the use of computer systems to unlawfully impersonate or steal another person’s identify, cyber-stalking, cyber-squatting, cyber- terrorism, racist and xenophobic crimes. The challenges arising from cyber threats in Nigeria include:I. Cyber-attacks have been reported to have targeted mostly banks and other financial institutions, oil and gas firms as well as government agencies. Between the year 2000 and 2013, Nigerian banks have lost an estimated amount of N159 billion to cybercrimes according to reports by the Nigerian Inter-Bank Settlements System (NIBSS). II. Cybercriminal activities are rampant in emerging markets like Nigeria because while internet connections are available, the technological knowledge and devices needed to track and tame illegal activities on the internet are not available. Cybercrime that would typify 2015 include: phishing and insider threats, lottery scam, beneficiary of a will scam, online charity scam, winning ticket in a lottery you never entered scam and next of kin scam. In addition, socially and politically motivated cyber-attacks are expected to rise in 2015. However, the prosecution of cyber related crimes is expected to witness a major boost in 2015 with the passage of the cybercrime Bill into law by senate last year. III. Also, the telecommunication sector is not isolated from the prevailing economic condition. The recent devaluation of the Naira has extremely increased the cost of doing business as the sector is largely dependent on capital and foreign exchange. In addition, the recent Central Bank of Nigeria’s policy that only allows importers of telecom equipment, power generators and finished products to buy foreign exchange through the interbank channels is a great challenge currently facing the industry. In February 2015, the Central Bank of Nigeria (CBN) cancelled the bi-weekly sales of foreign exchange through the Retail Dutch Auction System (RDAS) and Wholesale Dutch Auction system to end users (WDAS). This policy decision was taken to eliminate round tripping and speculation in the market, and enhance exchange rate stability.IV. Furthermore, though the number of internet telecommunication users have increased over the years, complains from end users about the unsatisfactory quality of services are also on the increase. This has been attributed to the concentration of the entire submarine cables in Lagos which have posed challenges of last-mile connectivity. The concentration of the entire cables in Lagos has led to issues such as; multiple taxation, multiple regulations, delays in delivery of Right of Way (ROW) Permits to deploy fiber cables across the country continue to hamper the accelerated intra and intercity fiber deployment.
3. Methodology
3.1. ARIMA Model Specification
The specification of  model according to Box-Jenkins is given by;
 | (1) |
where: is an autoregressive (AR) process of order p,
 is a moving average (MA) process of order
  is the lag operator,
  is dth differencing required to induce stationarity on the series and α is the constant term. Box-Jenkins (1976) determined the integer parameters (p,q) that govern the underlying process
  by examining the autocorrelations function (ACF) and partial autocorrelations (PACF) of the stationary series,
  .A stochastic process
  is called an ARIMA(p,d,q) process if the order of integration is d and the d differenced process has an ARMA (p,q) representation, that is
  ~ARMA(p,q). A series with seasonal periodicity can be model by the seasonal ARIMA (SARIMA) model. The selection of the appropriate SARIMA model is based on the following steps as pointed out by Box-Jenkins:Step 1: Preliminary Transformation: Transformation is required to stabilize the variance of the series in order to produce a series analogous to a stationary series. After appropriate transformation, if the sample autocorrelation function appears to be nonstationary, differencing may be carried out.Step 2: Identification: At the identification stage, th0 aim is to detect non-stationarity, seasonality and to identify the order of the seasonal and non-seasonal AR and MA processes. The autocorrelations function (ACF) and partial autocorrelations (PACF) help in the identification of tentative models for the stationary series. This step, however, involves a lot of subjectivity. Salau (1998) pointed out that this decision can be justified on the ground that the objective of the identification phase is not to rigidly select a single correct model but to select a few possible models that will be subjected to further statistical analysis.Step 3: Estimation of the model: This involves the estimation of the parameters of the tentative ARMA models identified in step 2. The estimation of the model parameters can be done by the conditional least squares and maximum likelihood.Step 4: Diagnostic checking: The diagnostic test is carried out on the chosen model in order to ascertain the adequacy of the model. This is done by analysing the residuals obtained from the estimated model. If the residuals are white noise; we accept the model, otherwise, we go back to step 2. ARIMA model is used because of its generality; it can handle many series regardless of stationarity or not, with seasonal or without seasonal elements, Box and Jenkins (1970; revised 1976). The principle of parsimony of ARIMA model is also another attractiveness of the modeling strategy. ARIMA model has been used by several authors to model univariate series. For example, Saz (2011), Etuk (2013) and Etuk and Amadi (2013) applied ARIMA approach to model the Nigerian crude oil prices and production time series. Mutangi (2015) and Avuglah et al. (2014) employed the ARIMA model to road traffic accidents cases in Zimbabwe and Ghana respectively.
4. Empirical Results and Discussion
4.1. Sources of Data
The monthly data of Nigeria’s teledensity from January, 2000 to May 2015 are used in this study. Specifically, the data from 2000: 1 – 2014:11 is used in the estimation of the models; while data from 2014: 12 – 2015:5 is used to evaluate the forecasting performance of the most parsimonious model. The monthly teledensity data were obtained from the Nigerian Communications Commission, Abuja. The plots of the series is depicted in Figure 2.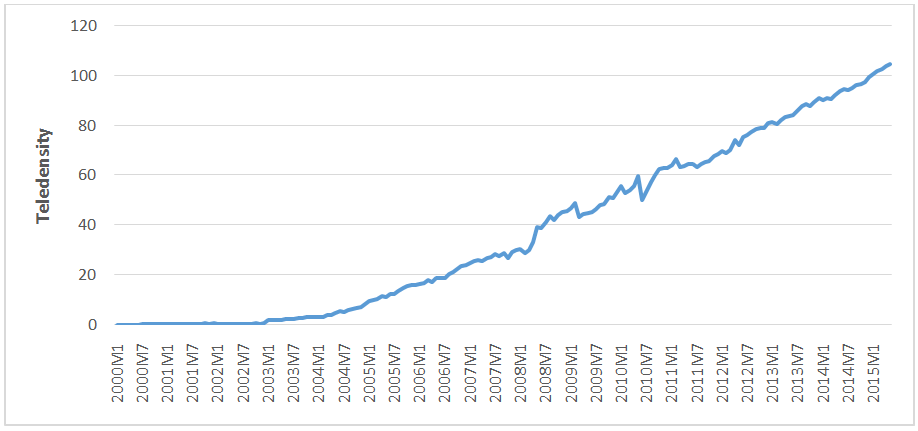 | Figure 2. Time Series Plot of Nigeria’s Monthly Teledensity |
An examination of the plot in figure 2 indicates that no stationarity is clearly inherent in the series. The series rose gradually to an unimaginable level in 2015. The autocorrelation function (ACF) and partial autocorrelation function (PACF) and the augmented Dickey-Fuller (ADF) test are presented in figure 3 and Table 1 respectively.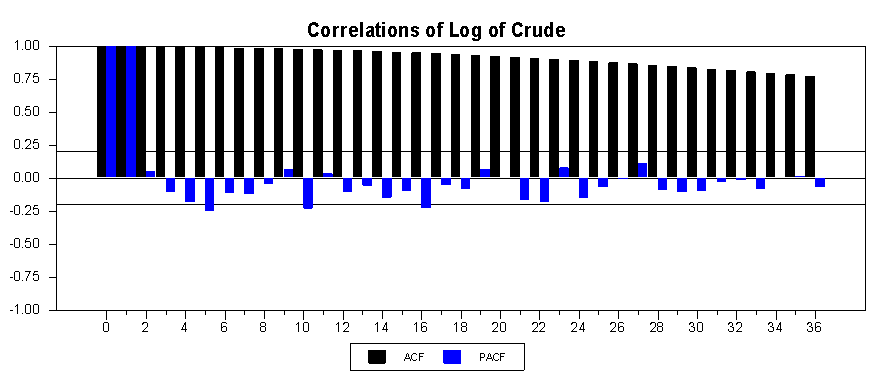 | Figure 3. Correlogram of Nigeria’s Monthly Teledensity |
Table 1. Augmented Dickey-Fuller Unit Root Test
 |
| |
|
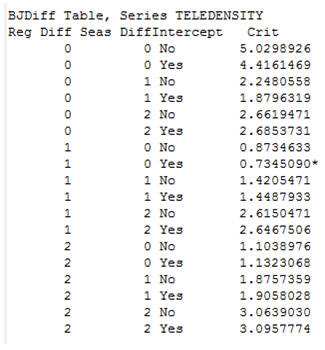
The Box-Jenkins identification program in RATS statistical software is used automatically to ascertain the number of level and seasonal differencing required to induce stationarity in the series. The results is presented in Table 2. Table 2. Box-Jenkins Automatic Differencing Combinations
 |
| |
|
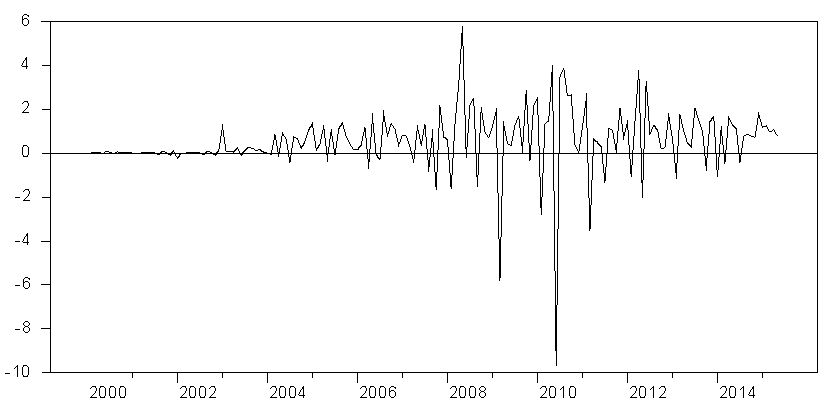 | Figure 4. Time Series Plot of the differenced Series |
The autocorrelation function in figure 3 decays slowly to zero indicating that the series is non-stationary in level. The ADF test results in Table 1 statistically confirms that the teledensity data is not stationary. The null hypothesis could not be rejected for the original series. Hence, the original series is non-stationary. Howbeit, the series is stationary after first differencing. The results in Table 2 suggests that one regular differencing and zero seasonal differencing is required to induce stationarity on the series. The correlogram in figure 5 indicates that stationarity has been induced in the differenced series. The correlogram seems to be that of a white noise process. The ADF test results in Table 1 further confirms that the differenced series is stationary. The unit root null hypothesis for the differenced series is rejected at 1% significance level. Hence, the series has a unit root, i.e. I (1). We used the behaviour of the autocorrelations and partial autocorrelations displayed in figure 5 to identify some candidate models which are further subjected to model selection analysis to obtain the most parsimonious ARIMA model for the data.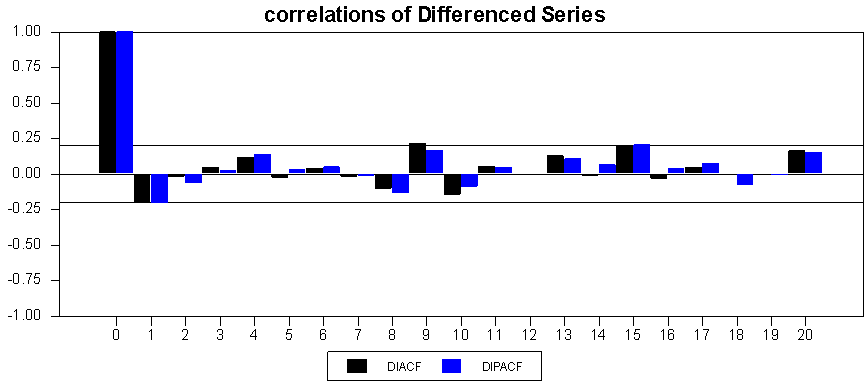 | Figure 5. Correlogram of Differenced Nigeria’s Monthly Teledensity |
From a close observation of the plots of ACF and PACF in figure 5, we noticed that both the ACF and PACF cut off after lag 1. In addition, the ACF and PACF displayed significant spikes at lag 1, 9, and 15. Based on these patterns, some possible candidate ARIMA models are identified. These are ARIMA (3,1,4), (1,1,||1,2,3,4,9||), (0,1,(||1,4|| ) and (0,1,||1,3,4||). We proceed to estimation and further statistical analysis with the four possible models. We summarized the results in Table 3.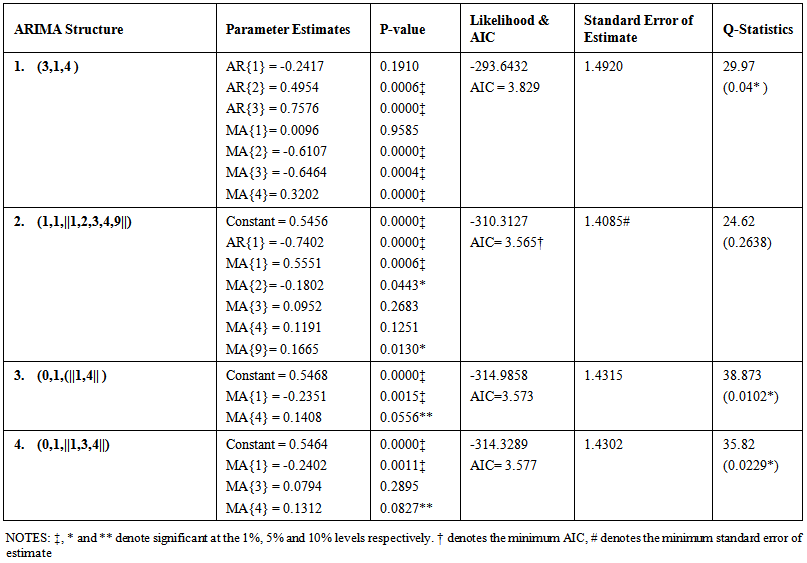 | Table 3. ARIMA Model Results |
The information criteria is employed in statistical modelling to select the most parsimonious model among competing models. Among the competing ARMA models, we choose the one with the lowest Akaike information criteria (AIC). In addition the Q-statistic provides an important measure for evaluating the independency of the residuals of the fitted models. For a well fitted model, the Q-test statistic is expected to be statistically insignificant. Based on these important statistics, ARIMA structure 2, ARIMA (1, 1, ||1, 2, 3, 4, 9||) seems to provide the best satisfactory fit to the Nigerian teledensity data. This model has the minimum AIC and the smallest standard error of estimate among all the ARIMA structures considered. Besides, unlike the other ARIMA structures, the Q-test statistic is statistically insignificant as indicated by the p-value, suggesting that the residuals do not suffer from autocorrelation. The residual analysis of the parsimonious model is presented in figure 6 and 7.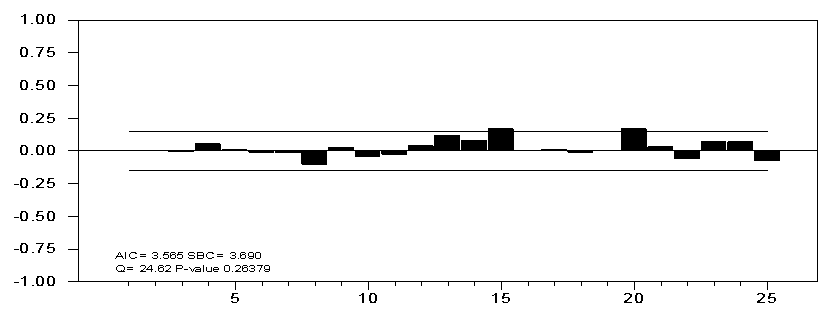 | Figure 6. Residuals Analysis for the fitted model |
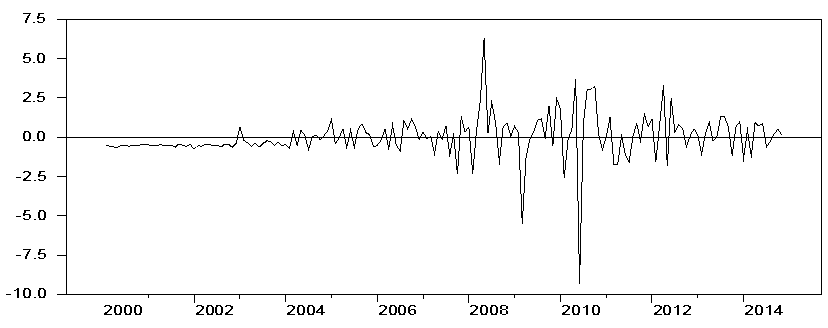 | Figure 7. Residuals plot for the fitted model |
The residual plots in figures 6 and 7 indicate that the residuals do not suffer from autocorrelation problem and they do not follow any noticeable systematic pattern. This is an indication that the fitted model is adequate.
4.2. Forecasting with the Fitted Model
Most of the work in time series modelling is motivated by the desire to produce a forecast with the fitted model. It is desirable that the fitted model produce forecasts with minimum error. In this section, we assess the forecasting performance of the fitted model. Forecast for ARIMA model can be computed directly from the ARIMA model equation by replacing: (1) future values of the error term by zero (2) future values of the  by their conditional expectation, and (3) present and past values of
  and
and  by their observed values. See (Chatfield, 2000) for more detailed discussions. The ARIMA model is estimated based on the monthly data from 2000:1- 2014:11, and ex post forecasts are generated for the time period 2014:12 -2015:05. The plot of the teledensity for 2014:11 – 2015:05 versus the ARIMA forecasts is depicted in figure 8. The forecast analysis clearly shows that the fitted ARIMA model performs well especially at the longer forecasting horizons.
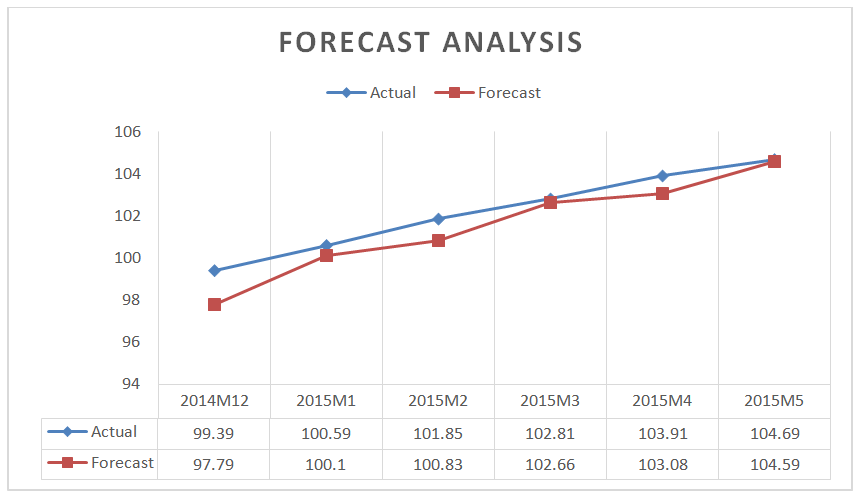 | Figure 8. Plots of Actual values versus the Fitted Model Forecasts |
5. Conclusions and Recommendations
The Nigeria’s telecommunications sector has no doubt witnessed unprecedented growth in the last few years. Teledensity rose from an abysmal figure of 0.73 in 2001 to 104.69 as at February, 2015 (NCC database). The number of internet users also witnessed a tremendous growth over the period under study. The growing demand for mobile data services in Nigeria’s telecommunication industry is expected to increase service revenues by 18.5%, to $10.9 billion in 2019, as against $9.2 billion in 2013 (Businessday, 16 February 2015, p.1). This expected revenue growth is coming at a period of dwindling government revenue caused by the decline in oil prices. The current economic uncertainty and low oil prices have led to the depreciation of the naira against the US dollar, but the telecoms sector is expected to aid the country’s diversification of its revenue sources.The trend analysis reveals that teledensity and internet users witnessed a high growth rate between 2003 and 2013. However, secured internet growth has been relatively slow. The paper aims to identify the appropriate time series model that fits the Nigeria’s teledensity for the period between January 2000 and May 2015 using the Box-Jenkins modelling strategy. The correlogram plots and the ADF test results indicated that the original series was not stationary. However, upon first differencing, the correlogram and ADF test results of the differenced series was stationary. Hence, the series has a unit root. The ACF and PACF of the differenced series were used to identify tentative models which were subjected to further statistical analysis to obtain the most parsimonious model. These tentative models are ARIMA (3,1,4), (1,1,||1,2,3,4,9||), (0,1,(||1,4||) and (0,1,||1,3,4||). The ARIMA model with the minimum AIC was selected as the best model. ARIMA (1, 1, ||1, 2, 3, 4, 9||) provided the most satisfactory fit to the Nigerian teledensity data. The Ljung-Box Q-statistic indicates that the residuals of the chosen model is serially uncorrelated. The out-sample forecasts using the fitted ARI MA model also indicates that the fitted model is quite satisfactory. The fitted model performs well especially at longer forecasting horizon. The forecasted values shows that the Nigeria’s teledensity will continue to increase over time. The trend analysis indicated that the rate of growth of secured internet in the country is quite very dawdling. With the growing threats of cyber-criminal activities associated with the increasing mobile internet and teledensity, the need for policy formulation and implementation to tame the ugly phenomena cannot be overemphasized. We therefore, urge the National Assembly to expedite actions towards the speedy passage of the Cyber Crime Bill. This is urgently necessary as it will speed up judicial processes on cybercriminal activities and as well boost electronic financial transactions in the country. In addition, the Bill will enhance the cashless policy of the Central Bank of Nigeria (CBN), and also step up the integrity of the country’s image before the Western world. Furthermore, the National Assembly needs to provide legislative backing to the protection of telecommunication infrastructures by expediting actions regarding the passage of the Critical National Infrastructure (CNI) Bill as this will help to boost the growth witnessed in the telecommunication industry and increased the revenue of government.
Notes
1. Teledensity is the number of telephone connections for every hundred individuals living in a specified geographic area. It varies between urban and rural area within a country and often used as an indicator for economic development of the country.2. Secured Internet servers are servers using encryption technology for internet transactions. 3. Phishing is the attempts to acquire sensitive information such as usernames, passwords and Automated Teller Machine (ATM) card details and sometimes money by masquerading as a trustworthy entity in an electronic communication.4. The Retail Dutch Auction System is a system where the CBN sell dollars to end users twice weekly at a much cheaper rate while the inter-bank channels is a system where banks sell foreign exchange independently sourced by them at a higher rate to the end user.5. For AR (p) models, the PACF has significant spikes through p and cut off after p while for MA (q), the ACF has significant spikes through q and for ARMA (p,q) both the ACF and PACF show different patterns (but all dampens after a while). For mixed processes with nontrivial AR and MA parts, the autocorrelations and partial autocorrelations both do not have a cutoff point but gradually decays to zero.6. NCC is an acronym for Nigeria telecommunications Commission.
References
| [1] | Adelanusi, K (2015), ‘Nigerian Cyber Security Outlook 2015’, Available from:http://www2.deloitte.com/ng/en/pages/risk/articles/nigerian-cyber-security-outlook-2015.html. |
| [2] | Avuglah, R.K, Adu-Poku, K.A and Harris, E (2014). Application of ARIMA models to Road Traffic Accident Cases in Ghana. International Journal of Statistics and Applications, Vol. 4(5), 233 – 239. |
| [3] | Box, G.E.P. and Jenkins, G.M. (1976). Time Series Analysis, Forecasting and Control, 2nd ed., San Francisco: Holden-Day. |
| [4] | Chatfield, C. (2000). Time-Series Forecasting, Chapman & Hall/ CRC. |
| [5] | Cyber Threats Rise on Broadband. Businessday Newspapers February 10, 2015. |
| [6] | Etuk, E.H (2013). Seasonal ARIMA Modelling of Nigerian Monthly Crude Oil Prices. Asian Economic and Financial Review, 3(3), 333-340. |
| [7] | Etuk, E.H and Amadi, E.H (2013). Multiplicative SARIMA Modelling of Nigerian Monthly Crude Oil Domestic Production. Journal of Applied Mathematics & Bioinformatics, Vol. 3 (3), 103 – 112. |
| [8] | FG lays out $300bn investment plan for telecoms expansion. Businessday, March 10, 2015. |
| [9] | Kongaut, C., Rohman, I.K and Bohlin, E. (2014). The economic impact of broadband speed: Comparing between higher and lower income countries. A paper presented at the European Investment Bank (EIB) Institute, September 12, 2014. |
| [10] | Mutangi, K (2015). Time Series Analysis of Road Traffic Accidents in Zimbabwe. International Journal of Statistics and Applications, 5(4), 141-149. |
| [11] | Mehmood, B and Mustafa, H (2014). Empirical Inspection of Broadband Growth Nexus: A Fixed Effect with Driscoll and Kraay Standard Errors Approach. Pakistan Journal of Commerce and Social Science, Vol. 8 (1), 01 – 10. |
| [12] | Nigeria’s subscriber base, teledensity progress to 127.61m lines. Businessday, February 13, 2015. |
| [13] | Nigeria National Broadband Plan (2013 -2018). A submission by Presidential Committee on Broadband. Available from:www.researchictafrica.net/countries/Nigeria_National_Broadband_plan_2013-2018.pdf |
| [14] | Nigeria Telecommunication Sector (2010 – 2014). National Bureau of Statistics (NBS), February 10, 2015. |
| [15] | Net Losses: Estimating the Global Cost of Cybercrime. Economic Impact of Cybercrime II. Center for Strategic and International Studies, June 2014. Available from: |
| [16] | Qiang and Rossotto (2009). World Bank Information and Communication for Development Report 2009. |
| [17] | Saz, G. (2011). The Efficacy of SARIMA Models for Forecasting Inflation Rates in Developing Countries: The Case for Turkey. International Research Journal of Finance and Economics, 62, 111-142. |
| [18] | Shoewu, O. and Edeko, F.O (2011). Outgoing call quality evaluation of GSM network services in Epe, Lagos State. American Journal of Scientific and Industrial Research, Vol. 2 (3), 409-417. |
| [19] | Sullivan, K (2014), ‘The cybersecurity Risk Paradox: Measuring the Impact of Social, Economic, and Technological Factors on Cybersecurity’, Available from: http://blogs.microsoft.com/cybertrust/2014/01/16/the-cybersecurity-risk-paradox-measuring-the-impact-of-social-economic-and-technological-factors-on-cybersecurity/ |
| [20] | Telecoms outlook bright amid fierce economic headwinds. Businessday, February 10, 2015. |
| [21] | 2015 Cyberspace: Cyber security implications for Nigeria. Vanguard Newspapers, December 31, 2014, www.vanguardngr.com. |
| [22] | Zeb, N., Qiang, F and Shabbir, M. (2014). Telecommunication Infrastructure and Foreign Direct Investment in Pakistan: An Empirical Study. Global Journal of Management and Business Research: B Economics and Commerce, Vol. 14 (4), Version 1. |


 model according to Box-Jenkins is given by;
 is an autoregressive (AR) process of order p,
 is a moving average (MA) process of order
  is the lag operator,
  is dth differencing required to induce stationarity on the series and α is the constant term. Box-Jenkins (1976) determined the integer parameters (p,q) that govern the underlying process
  by examining the autocorrelations function (ACF) and partial autocorrelations (PACF) of the stationary series,
  .A stochastic process
  is called an ARIMA(p,d,q) process if the order of integration is d and the d differenced process has an ARMA (p,q) representation, that is
  ~ARMA(p,q). A series with seasonal periodicity can be model by the seasonal ARIMA (SARIMA) model. The selection of the appropriate SARIMA model is based on the following steps as pointed out by Box-Jenkins:Step 1: Preliminary Transformation: Transformation is required to stabilize the variance of the series in order to produce a series analogous to a stationary series. After appropriate transformation, if the sample autocorrelation function appears to be nonstationary, differencing may be carried out.Step 2: Identification: At the identification stage, th0 aim is to detect non-stationarity, seasonality and to identify the order of the seasonal and non-seasonal AR and MA processes. The autocorrelations function (ACF) and partial autocorrelations (PACF) help in the identification of tentative models for the stationary series. This step, however, involves a lot of subjectivity. Salau (1998) pointed out that this decision can be justified on the ground that the objective of the identification phase is not to rigidly select a single correct model but to select a few possible models that will be subjected to further statistical analysis.Step 3: Estimation of the model: This involves the estimation of the parameters of the tentative ARMA models identified in step 2. The estimation of the model parameters can be done by the conditional least squares and maximum likelihood.Step 4: Diagnostic checking: The diagnostic test is carried out on the chosen model in order to ascertain the adequacy of the model. This is done by analysing the residuals obtained from the estimated model. If the residuals are white noise; we accept the model, otherwise, we go back to step 2. ARIMA model is used because of its generality; it can handle many series regardless of stationarity or not, with seasonal or without seasonal elements, Box and Jenkins (1970; revised 1976). The principle of parsimony of ARIMA model is also another attractiveness of the modeling strategy. ARIMA model has been used by several authors to model univariate series. For example, Saz (2011), Etuk (2013) and Etuk and Amadi (2013) applied ARIMA approach to model the Nigerian crude oil prices and production time series. Mutangi (2015) and Avuglah et al. (2014) employed the ARIMA model to road traffic accidents cases in Zimbabwe and Ghana respectively.


 by their conditional expectation, and (3) present and past values of
  and
and  by their observed values. See (Chatfield, 2000) for more detailed discussions. The ARIMA model is estimated based on the monthly data from 2000:1- 2014:11, and ex post forecasts are generated for the time period 2014:12 -2015:05. The plot of the teledensity for 2014:11 – 2015:05 versus the ARIMA forecasts is depicted in figure 8. The forecast analysis clearly shows that the fitted ARIMA model performs well especially at the longer forecasting horizons.
 Abstract
 Reference
 Full-Text PDF
 Full-text HTML
