F. B. Adebola, O. O. Johnson
Department of Statistics, Federal University of Technology, Akure, Nigeria
Correspondence to: O. O. Johnson, Department of Statistics, Federal University of Technology, Akure, Nigeria.
| Email: |  |
Copyright © 2015 Scientific & Academic Publishing. All Rights Reserved.
This work is licensed under the Creative Commons Attribution International License (CC BY).
http://creativecommons.org/licenses/by/4.0/

Abstract
This paper presents a modification of Warner’s [8] Randomized Response model. According to O’Muircheartaigh et al [7], non-response is inevitable in a survey; in view of this, our model further reduces the non-response bias by further sampling for the non-respondents. In this paper we performed an empirical practice of our model and we also performed the empirical comparison of our model with Warner [8] model. We discovered that our model is more efficient than the Warner [8] model.
Keywords:
Close supervision, Sensitive behavior, Non-Respondent, Sub-Sample, Randomized response techniques
Cite this paper: F. B. Adebola, O. O. Johnson, An Improved Warner’s Randomized Response Model, International Journal of Statistics and Applications, Vol. 5 No. 6, 2015, pp. 263-267. doi: 10.5923/j.statistics.20150506.01.
1. Introduction
Warner [8] proposed the randomized response technique as a survey technique to reduce potential bias due to non-response and social desirability when asking questions about sensitive behaviors (see Warner [8], for a comprehensive review). The method asks respondents to use a randomization device, such as a coin, deck of cards, spinners whose outcome is not known by the enumerator. The outcome of the randomized device determines which of the two questions the respondent answers. A lot of improvements have been done to Warner’s randomized response model, to mention few, Greenberg et al. [4], Gupta and Shabbir [5], Adebola and Adegoke [1], Adepetun and Adebola [3], Adebola et al. [2].In this paper, we develop a Modification of Warner’s Randomized Response Techniques by introducing the concept of sub-sample of non-respondent. Randomized Response Techniques helps to reduce response and non-response bias while our model further reduces the non-response bias. Item non-response occurs when the respondent refuses to answer the sensitive part of the question which is the major concern of the interviewer. In sections that follow, we present the Warner’s [8] Randomized Response Model, propose Randomized Response Model and thereafter its relative efficiency over the existing one.
2. Warner’s Randomized Response Model
Warner [7] gave a genius idea by using randomized device to encourage truthful answer from the respondent with respect to a sensitive behavior. The randomizing device, such as a spinning arrow, dice or coins is used to select one of the two questions; such as,“I am HIV positive” (class A, presented with probability P)“I am HIV negative” (class B, presented with probability 1-P)The respondents have the options “Yes” or “No” presented to him or her. The interviewer does not know which question any respondent has answered but knows the probability P and 1-P with which the two statements are presented. Here, with a random sample of n respondents, the interviewer records a binomial estimate  of the proportion θ of “Yes” answers, where y is the number of yes answers. If the questions are answered truthfully, the relation between
  and
and  in the population is given as:
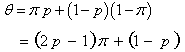 | (2.1) |
Where  is the proportion of people with the stigmatized or sensitive behavior using Warner’s techniques and
  is the probability of selecting the sensitive question.
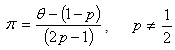 | (2.2) |
ProofFrom equation (2.1), we have  Making
  the subject of the relation, we have
 The unbiased estimator
  of a sensitive proportion
  is given by:
 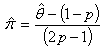 | (2.3) |
The Variance is given by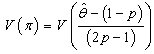
 Recall that
  where c is a constant.Then,
  We have,
  Thus,
Thus,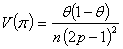 | (2.4) |
Where  follows a binomial distribution, Now to find the unbiased estimator of the variance
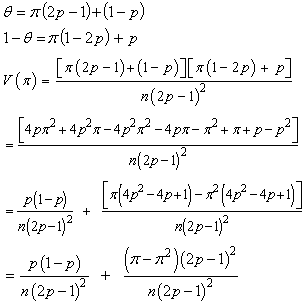 The Variance is given by
 The unbiased variance estimator
  of a sensitive proportion
  is given by:
 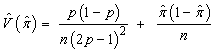 | (2.5) |
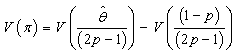
The second term in  is the variance that
  would have if all n respondents answered truthfully a direct question about class A membership.Except by chosen
  near 0.5 and p > 0.85, the first term is greater than the second, often much greater. The method is thus quite imprecise in general. This might be expected since the interviewer does not know whether a “yes” answer implies membership in a class A or the opposite.However, Warner’s method may give a smaller mean square error (MSE) than a direct sensitive question would, if the latter produced numerous refusals or false answers.
3. Our Model
Several randomized response techniques has been developed, the models developed do not take into consideration of item non-response (refusal to answer the sensitive part of the question). Non-response is an important source of non-sampling error in survey sampling, it occurs when some but not all the required information is collected from the sample unit. The most damaging is unit non-response where a sampling unit refuses to answer the sensitive part of the randomized response techniques designed questionnaire. In view of this, we proposed an improved Warner’s randomized response model that is based on sub-sample of non-respondent so as to induce a better estimate of the proportion of people with the stigmatized or sensitive behavior. Questionnaires were sent out and the number of useable responses were recorded (useable responses at the first interview given as ) while the remaining were referred to non-response given as
  In order to further reduce the non-response bias then a survey on sub-sample of non-respondent come to place. It is assumed that the whole of the sub-sample responded to the survey and are useable responses which would be achieved by close supervision. Close supervision in this context doesn’t mean the interviewer knows the question answered by the respondent but it means the respondent is properly instructed and monitored on a one to one basis. Let
  be the number “yes” response from the respondent at the first interview. Let
  be the number of “yes” answer from the sub-sample of non-respondent. Let
  be the sample size of the Survey. Let
  be the sub-sample size. Let
  be the unit which is used to take the sub-sample. The proportion of “yes” response from our model is given by:
 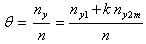 | (3.1) |
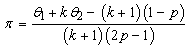
By simplifying, we have (see theorem 1 for proof): | (3.2) |
Where  be the proportion of “yes” answer,
  be the proportion of “yes” answer form the respondent at the first interview and
  be the proportion of “yes” answer from the sub-sample of non-respondent.From the Warner’s randomized response techniques, the proportion of “yes” response from our model is given by:
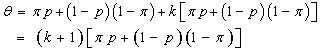 | (3.3) |
Let  then we have:
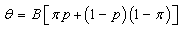 Solving for
  we have,
 Then we have,
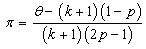 Recall that
 Hence, the unbiased estimator of
  is given by:
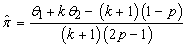 | (3.4) |
The variance of the estimator is given by: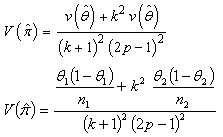 | (3.5) |
By simplifying, we have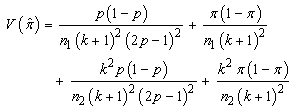 By further simplification,The unbiased variance estimator
  of a sensitive proportion
  is given by:
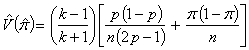 | (3.6) |
Then,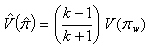 | (3.7) |
Where  is the variance for a Warner’s model.Theorem 1: The proportion of “yes’ response,
  is given by:
 Proof: From the Hansen and Hurwitz [6], which introduces the concept of subsample of non-respondent, we have
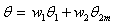 Where
Where 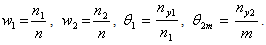 Then, we have
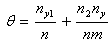 | (3.8) |
Recall that  By substituting for m in equation (3.8), we have
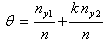 The unbiased estimator of
  is given by
 Where
Where  Theorem 2: Given that
  is an integer value and k >1Show that
  Proof: Given that,
  Thus when
  That is,
  By re-arranging,
 | (1) |
Divide through by 
 Multiply through by
  We have,
  Then,
Then,  | (2) |
From equation (1), we have Divide through by
  we have
 Subtract 1 from both sides, we have
 Divide through by
  we have
 Then,
Then, | (3) |
From equation (2) and (3), using transitivity lawWe have,
4. Comparative Study of our Model
Here we performed the comparative study of our model; this can be achieved mathematically and empirically. Mathematically, it follows that the proposed model is more efficient than the Warner’s randomized response model if we have;
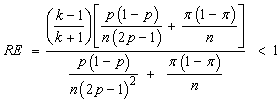 By simplifying, we have
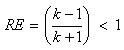 Since theorem 2 holds, then the variance of our proposed model is less than the variance of Warner’s RRT.Empirically, to also validate our conclusion on the proposed model we present the tables below.
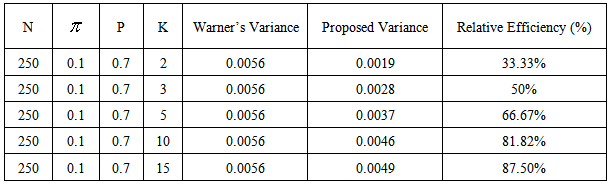
Table 1. Table showing the relative efficiency when n= 250,
 = 0.1, p=0.7 = 0.1, p=0.7
 |
| |
|
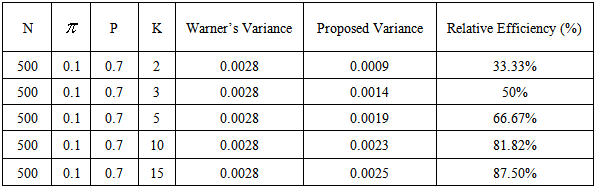
Table 2. Table showing the relative efficiency when n= 500,
 = 0.1, p=0.7 = 0.1, p=0.7
 |
| |
|
We can deduce from the empirical comparison that the choice of k plays a major role in the comparative study. It can be derived from the table that k = 2 gave the minimum variance in the proposed model; conclusively, the smaller the choice of k, the more efficient the proposed model is over the conventional Warner’s model.
5. Conclusions
This paper presented an improved Warner’s randomized response model; the proposed strategy further reduces the non-response bias by introducing the concept of sub-samples of non-respondent. The proposed model is likely to induce better estimate with a reduced variance. Moreover, the proposed model is more efficient than the Warner’s model. Lastly, we are able to conclude that the smaller the choice of k (the unit which is used to divide the non-respondent so as to have the sub-sample size), the higher the gain in efficiency of the proposed model over the conventional Warner’s model.
References
| [1] | Adebola, F.B. and Adegoke, N.A. (2013): A Survey of Examination Malpractices using the Randomized Response Technique. Journal of the Nigerian Association of Mathematical Physics, 23, 375-388. |
| [2] | Adebola, F. B., Johnson, O. O., & Adegoke, N. A. (2014): A Modified Stratified Randomized Response Techniques. Mathematical Theory and Modeling, 4(13), 29-42. |
| [3] | Adepetun, A.O. and Adebola, F.B. (2014): On the Relative Efficiency of the Proposed Reparametized Randomized Response Model. International Journal of Mathematical Theory and Modeling, 4, 58-67. |
| [4] | Greenberg, B.G., Abul-Ela, A.A., Simmons, W.R. and Horvitz, D.G. (1969): The Unrelated Question Randomized Response: Theoretical Framework. Journal of the American Statistical Association 64, 520-539. |
| [5] | Gupta, S.N. and Shabbir, J. (2006): An Alternative to Warner’s Randomized Response Model. Journal of Modern Applied Statistical Methods, 5, 328-331. |
| [6] | Hansen, M.H. and Hurwitz, W.N. (1946): The Problem of Non-Response in Sample Surveys, Journal of the American Statistical Association 41, 517-529. |
| [7] | O’Muircheartaigh, C. and Campanelli, P. (1999): A multilevel exploration of the role of interviewers in survey non-response. Journal of the Royal Statistical Society, Series A 162, 437-46. |
| [8] | Warner, S.L. (1965): Randomized response: A Survey Technique for Eliminating Evasive Answer Bias, Journal of the American Statistical Association 60, 63-69. |

 Abstract
 Reference
 Full-Text PDF
 Full-text HTML