Gideon Mensah Engmann1, Grace Adzo Motey2, Mohammed Adjei Adjieteh1
1Department of Statistics, Faculty of Mathematical Sciences, University for Development Studies, Navrongo, Ghana
2Department of Applied Biology, Faculty of Applied Sciences, University for Development Studies, Navrongo, Ghana
Correspondence to: Gideon Mensah Engmann, Department of Statistics, Faculty of Mathematical Sciences, University for Development Studies, Navrongo, Ghana.
| Email: |  |
Copyright © 2015 Scientific & Academic Publishing. All Rights Reserved.
Abstract
Appendicitis is inflammation of the appendix. In Ghana, most people affected by this disease subsequently die as a result of late treatment. The study seeks to model the appendicitis cases and also forecast future trends of the disease using Box-Jenkins approach. Data on monthly reported cases of appendicitis from 2008 to 2014 was collected from the Biostatistics department of the Korle-Bu Teaching Hospital. The results shows that ARIMA (1,0,0)×(0,1,1)12 adequately model the number of appendicitis cases. The forecasted values also revealed that the number of appendicitis cases will increase during the months of April to July which happens to be the major rainy season of the country.
Keywords:
Appendicitis, Box-Jenkins, Korle-Bu Teaching Hospital, Accra
Cite this paper: Gideon Mensah Engmann, Grace Adzo Motey, Mohammed Adjei Adjieteh, Statistical Modeling of Appendicitis Cases at the Korle-Bu Teaching Hospital, Accra, Ghana, International Journal of Statistics and Applications, Vol. 5 No. 5, 2015, pp. 257-261. doi: 10.5923/j.statistics.20150505.10.
1. Introduction
Appendicitis (also called epityphlitis) is inflammation of the appendix. Many cases of appendicitis require removal of the inflamed appendix by laparotomy or laparoscopy due to the high mortality associated with rupture of the appendix [6]. Appendectomy (sometimes also called appendisectomy) is the surgical removal of the vermiform appendix. Appendicitis was first described by Reginald Fitz in 1886, and is today recognized as one of the most common and significant causes of severe acute abdominal pain worldwide. The causative agents of appendicitis include bezoars, foreign bodies, trauma, intestinal worms, lymphadenitis and calcified fecal deposits. The major symptoms of Appendicitis are dull pain near the navel or the upper abdomen that becomes sharp as it moves to the lower right abdomen, loss of appetite, abdominal swelling, nausea and/or vomiting soon after abdominal pain begins, fever of 99-102 degrees Fahrenheit and inability to pass gas. Treatment of appendicitis is mainly by surgery however intravenous antibiotics can be used. The average hospital charge for an elderly patient’s negative appendectomy in the United States is $ 47,120.3 [1]. Acute Appendicitis is a common clinical condition worldwide. In Ghana, most people affected by this disease subsequently die as a result of late treatment. Nashiru and Sarpong (2011) used Arima to model and forecast hypertensive cases in Navrongo, Ghana. Sarpong (2013) also used Arima to model and forecast maternal mortality in Kumasi, Ghana. This study seeks to model the appendicitis cases and also forecast future trends of the disease. This will help reveal the current pattern/trend of appendicitis cases and go a long way to help public health workers and government to organize educative programmes to keep the disease under control. We therefore employed the Box-Jenkins approach to model and forecast appendicitis cases at Korle-Bu Teaching Hospital, Accra, Ghana.
2. Material and Methods
The study was conducted at the Korle-Bu Teaching Hospital in the Greater Accra Region of Ghana which is one of the major referral hospitals in the country. Data on monthly reported cases of appendicitis from 2008 to 2014 was collected from the Biostatistics Department of the hospital. The data was modelled using Seasonal Autoregressive Integrated Moving Average (SARIMA) stochastic model. An  model is a combination of Autoregressive (AR) which shows that there is a relationship between present and past values, a random value and a Moving Average (MA) model which shows that the present value has something to do with the past residuals. If the data has a seasonal component, then
  is extended to include the seasonal component. The seasonal autoregressive integrated moving average model of Box and Jenkins (1970) is denoted as an
  The orders
  and
and  are for the non-seasonal AR and MA component respectively. The orders of the Seasonal AR and MA component are
  and
and  respectively. Also, the order of differencing for the seasonal and non-seasonal is
  respectively. The seasonal order is
  The estimation of the model consists of three steps, namely: identification, estimation of parameters and diagnostic checking.
2.1. Model Identification
We first determine whether the series is stationary or not formally by conducting Augmented Dickey-Fuller (ADF) and Kwiatkowski-Phillips-Schmidt-Shin (KPSS) test. If the series is not stationary; it would then be converted to a stationary series by differencing. That is, the original series is replaced by a series of differences. An ARIMA model is then specified for the differenced series.
2.2. Model Estimation
Once a model is identified, the next stage for Box-Jenkins approach is to estimate the parameters. The model with the minimum values of Akaike Information Criterion (AIC), Modified Akaike Information Criterion (AICc) and Normalised Bayesian Information Criterion (BIC) was considered as the best model.
2.3. Diagnostic Checking
In this step, model must be checked for adequacy by considering the properties of the residuals whether the residuals from an ARIMA model must have the normal distribution and should be random. An overall check of model adequacy is provided by the Ljung-Box Q statistic. The test statistic Q is 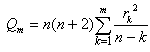 | (1) |
Where  is the residual autocorrelation at lag
 the number of residuals and
  the number of times lags includes in the test. If the P-value associated with the Q statistic is small (P-value < α), the model is considered inadequate.ARCH LM-test for conformity of the presence of, or otherwise ARCH effect is given by the hypothesis;
 There is no conditional heteroscedasticity in the residuals of the model
 There is conditional heteroscedasticity in the residuals of the modelThe test statistic is given by;
 | (2) |
Where  number of observationR2 = coefficient of determination computed from the auxiliary regression.
2.4. Unit Root Test
Augmented Dickey-Fuller (ADF) test and Kwiatkowski-Phillips-Schmidt-Shin (KPSS) test are performed to test whether the data is stationary or not. Unit Root Test was derived in 1979 by Dickey and Fuller to test the presence of a unit root verses a stationary process. The null hypothesis of interest is  (the series has unit root or is non-stationary) against the alternative
  (the series has no unit root or is stationary).All statistical tests were controlled at 5% significance level
3. Results and Discussion
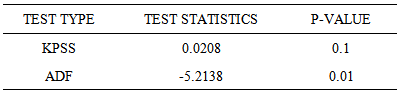
Figure 1 shows the time series plot of the Appendicitis data. The series show a periodic pattern over the period of time. The plot seems to be showing that the series is stationary. The values had regular swings and hence regular variability. From Figure 2, the ACF shows the series to be non-seasonally stationary and seasonally non-stationary because the seasonal lags dies off slowly therefore the need for seasonal differencing. From Table 1, Kwiatkowski - Phillips-Schmidt-Shin (KPSS) test showed that the series is non-seasonally stationary since the p-value of the KPSS test is 0.1 which is greater than the significance level (5%), so we fail to reject the null hypothesis that the data is level or trend stationary. Again from Table 1, the Augmented Dickey-Fuller (ADF) test which is used for verifying whether or not there is unit root suggests that there is unit root since the p-value of the ADF test is smaller than the significance level (5%), so we reject the null hypothesis of unit root and claim that the series is stationary. Figure 2 indicates clearly the evidence of seasonality in the data as the Partial Autocorrelation Function (PACF) has a significant spike at season lag 12.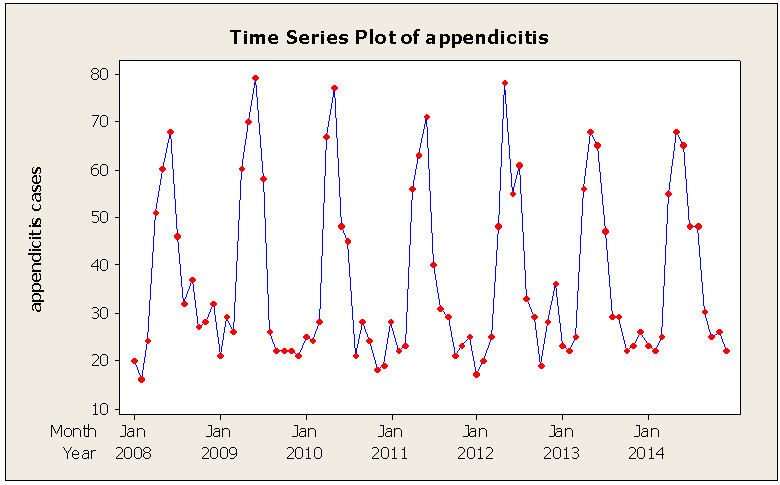 | Figure 1. Time Series Plot of the Appendicitis data |
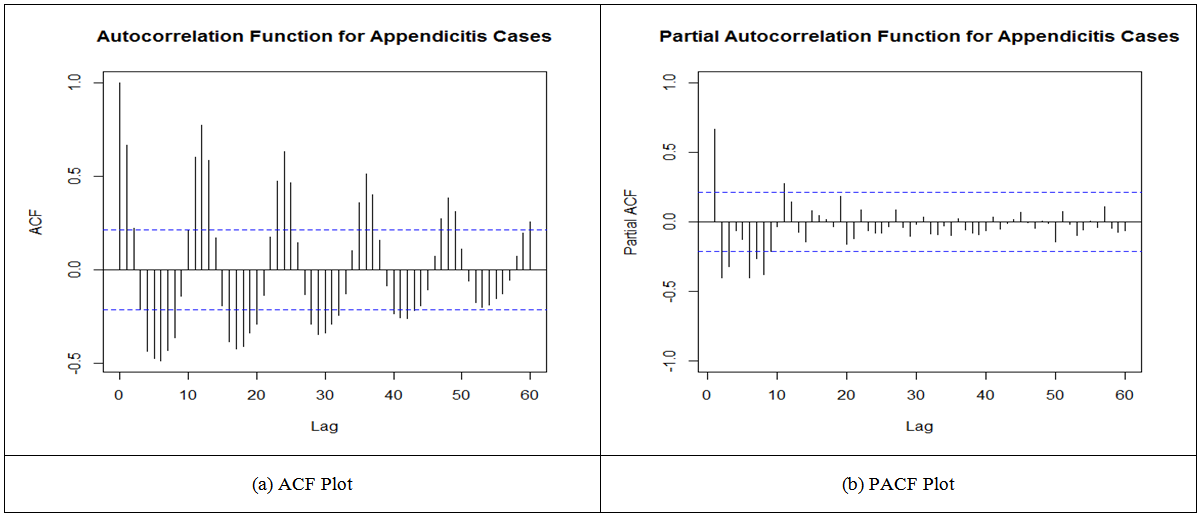 | Figure 2. ACF Plot and PACF Plot of the Appendicitis Data |
Table 1. Kwiatkowski-Phillips-Schmidt-Shin (KPSS) test and Augmented Dickey-Fuller (ADF) test of appendicitis cases
 |
| |
|
3.1. Model Estimation and Evaluation
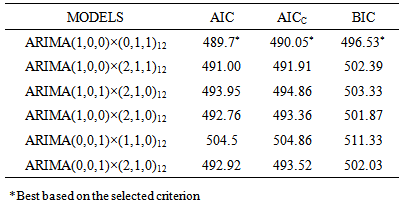
An 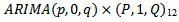 models will be fitted to the data since the data was seasonal differenced once (Figure 3) and the best model will be selected based on the minimum values of Akaike Information Criterion (AIC), Modified Akaike Information Criterion (AICc) and Normalized Bayesian Information Criterion (BIC). The identified models are presented in Table 4 below with their corresponding values of AIC, AICc and BIC.
 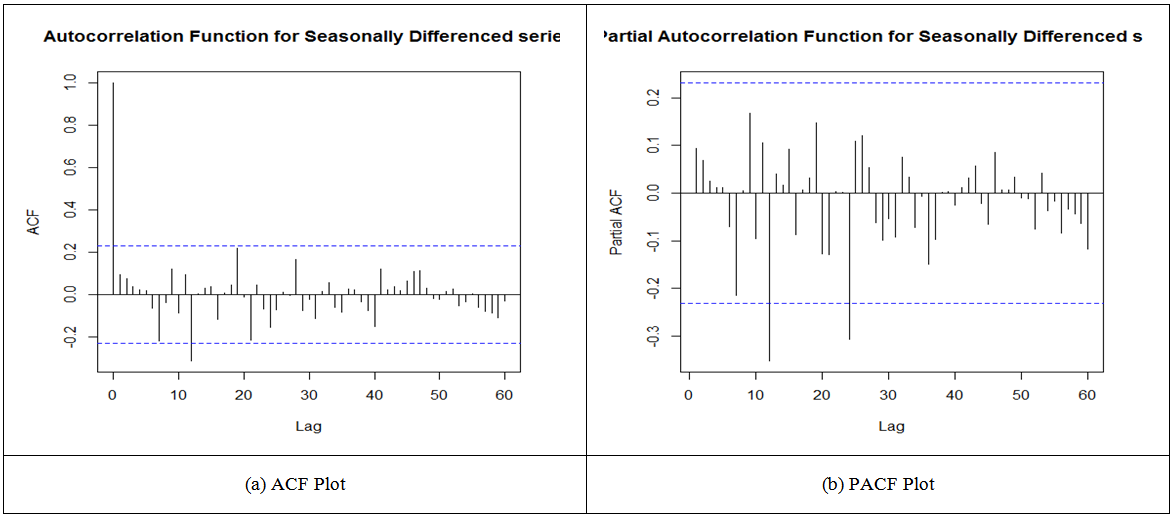 | Figure 3. Autocorrelation Function (ACF) and Partial Autocorrelation Function (PACF) graph of seasonal differenced series |
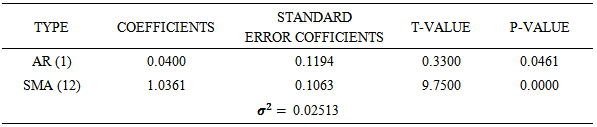
From table 2, among these possible models, ARIMA (1, 0, 0) × (0, 1, 1)12 was chosen as the appropriate fitted models for the data since its AIC, AICc, BIC are smaller as compared to the other models. Parameters of the model were estimated. From table 3, at 95% confidence level, we conclude that the parameters are significant.Table 2. Tentative SARIMA models
 |
| |
|
Table 3. Parameter estimates of ARIMA (1, 0, 0) × (0, 1, 1)12 of the appendicitis cases
 |
| |
|
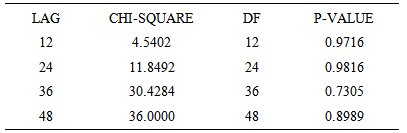
The residuals also follow a white noise process that is residuals have zero mean, constant variance and also uncorrelated as show in figure 4. Also, from the diagnostic plots in figure 4, the Ljung-Box test statistic had p-values greater than the alpha (α) value of 0.05. We therefore fail to reject the null hypothesis and conclude that there is no serial correlation in the residuals of the model. Hence the model is adequate. The ARCH LM test also shows no heteroscedasticity in the model residuals since the p-values are all greater than the alpha (α) value of 0.05 as shown in table 4.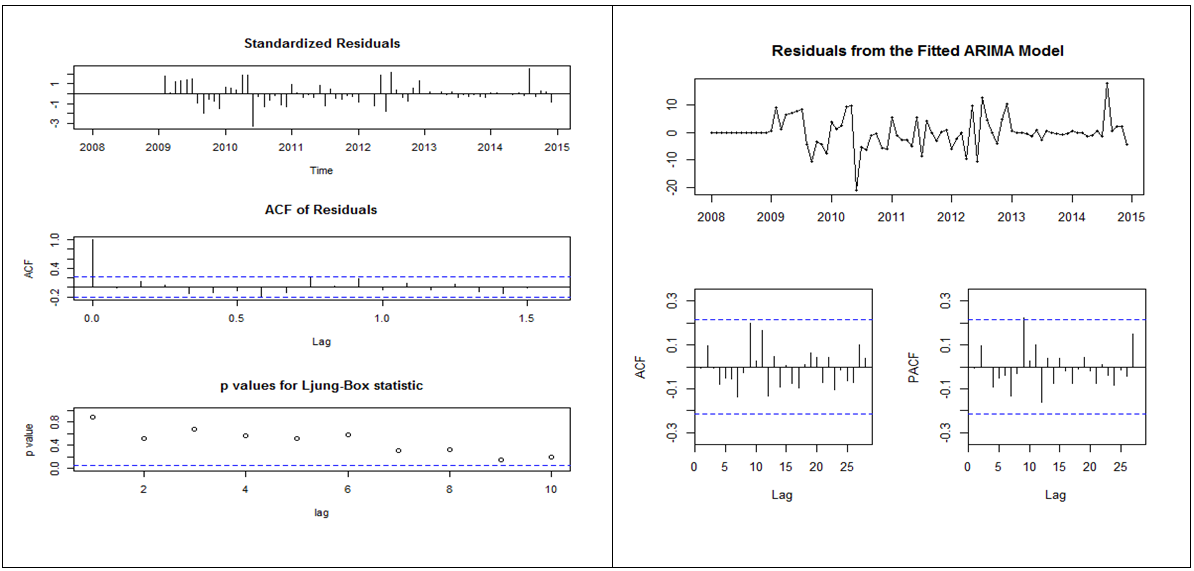 | Figure 4. Diagnostic plot of ARIMA (1,0,0)×(0,1,1)12 of the appendicitis cases |
Table 4. ARCH-LM test of residuals ARIMA (1,0,0)×(0,1,1)12 of the Appendicitis cases
 |
| |
|
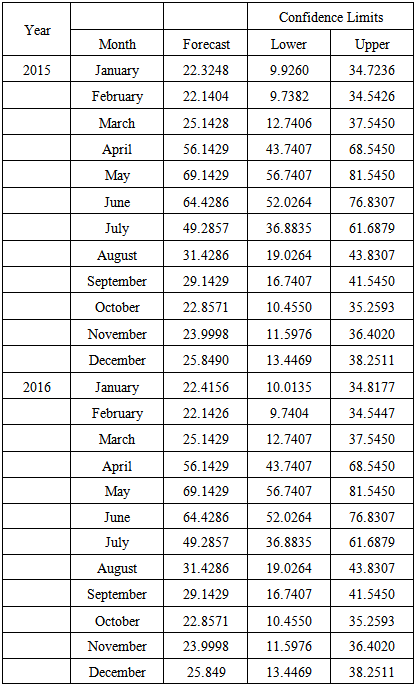
Finally we made a two year forecast with our model as shown in Table 5. The forecast shows slight decline in the appendicitis cases and then followed by an increment (cyclic order). These fluctuations occur within the major rainy season of the study location.Table 5. Forecasting value of Arima (1, 0, 0) × (0, 1, 1)12 model for monthly reported appendicitis cases for two years
 |
| |
|
4. Conclusions
In this study, we model the appendicitis cases at Korle-Bu Teaching Hospital, Accra, Ghana using Box-Jenkins approach. The adequate model identified was ARIMA (1, 0, 0)×(0,1,1)12. The forecasted values also revealed that the number of appendicitis cases will increase during the months of April to July which happens to be the major rainy season of the country. Future research could focus on multivariate time series analysis of appendicitis cases in Ghana where data from other teaching hospitals in the country could be integrated.
ACKNOWLEDGEMENTS
Acknowledgements go to all and sundry who in diverse ways contributed to making this research a success especially Mr. Prince Agyire and Miss Irene Ameade.
References
| [1] | Ackerman, S., Anastassopoulos, K. and Knight, T. (2005). Economic Studies for NeutroSpec Imaging Agent. Covance Market Access Services, Inc. |
| [2] | Burnham, K. P. and Anderson, D.R. (1998). Model Selection and Inference. Springer-Verlag, New York. |
| [3] | Box, G.E.P. and Jenkins, G.M. (1976). Time Series Analysis: Forecasting and Control. Holden-Day, San Francisco. |
| [4] | Dickey, D.A. and Fuller, W.A. (1979). Distribution of estimators for Autoregressive Time Series with Unit Root. Journal of the American Statistical Association, 74: 427-431. |
| [5] | Fitz, R.H. (1886). Perforating inflammation of the vermiform appendix with special reference to its early diagnosis and treatment. Am J Med Sci (92): 321–46. |
| [6] | Graffeo, C. S. and Counselman, F. L. (1996). "Appendicitis". Emergency medicine clinics of North America. 14 (4): 653–71. |
| [7] | Kwiatkowski, D., Phillips, P.C.B., Schmidt, P. and Shin, Y. (1992). Testing the Null Hypothesis of Stationarity against the Alternative of a Unit Root. Journal of Econometrics. 54, 159-178. |
| [8] | Nasiru, S. and Sarpong, S. (2012). Statistical modeling of hypertension cases in Navrongo, Ghana, West Africa. American Journal of Social Science and Management Science 2(4): 377-383. |
| [9] | Sarpong, S. (2013). Modeling and Forecasting Maternal Mortality; an Application of ARIMA Models. International Journal of Applied Science and Technology. 3(1), pp: 19-28. |
 Abstract
 Reference
 Full-Text PDF
 Full-text HTML