-
Paper Information
- Paper Submission
-
Journal Information
- About This Journal
- Editorial Board
- Current Issue
- Archive
- Author Guidelines
- Contact Us
International Journal of Statistics and Applications
p-ISSN: 2168-5193 e-ISSN: 2168-5215
2015; 5(5): 247-256
doi:10.5923/j.statistics.20150505.09
Forecasting USD/MUR Exchange Rate Dynamics: An Application of Asymmetric Volatility Models
 Abstract
 Reference
 Full-Text PDF
 Full-text HTML
Jason Narsoo
Department of Economics and Statistics, Faculty of Social Studies and Humanities, University of Mauritius, Réduit, Mauritius
Correspondence to: Jason Narsoo, Department of Economics and Statistics, Faculty of Social Studies and Humanities, University of Mauritius, Réduit, Mauritius.
| Email: |  |
Copyright © 2015 Scientific & Academic Publishing. All Rights Reserved.
An empirical analysis of the volatility of the exchange rate of US Dollar / Mauritian Rupee (USD/MUR) is performed using various GARCH-type models. The predictive ability of the symmetric GARCH model is compared with the asymmetric EGARCH, TGARCH, PGARCH and GJR-GARCH models. The innovation of the variance equation is modelled using the Student’s-t, the Generalised Error Distribution (GED) and the reparametrised Johnson SU distribution (JSU). Using daily data over the period January 2004 to June 2015, an in-sample dataset and an out-of-sample dataset are respectively composed for the assessment of the fitting and the predictive accuracy of the models. The results indicate that the data exhibit volatility persistence as well as the stylised features, volatility clustering and leverage effects; hence supporting the implementation of the asymmetric models. The results also show the suitability of asymmetric GARCH-type models in predicting the volatility of USD/MUR exchange rates. On the basis of both the in-sample and the out-of-sample performance, the leptokurtic and skewed JSU innovation distribution outperforms the Student’s-t and the GED distributions under all GARCH specifications.
Keywords: Exchange rate volatility, Stylised facts, Asymmetric GARCH models, Forecasting ability
Cite this paper: Jason Narsoo, Forecasting USD/MUR Exchange Rate Dynamics: An Application of Asymmetric Volatility Models, International Journal of Statistics and Applications, Vol. 5 No. 5, 2015, pp. 247-256. doi: 10.5923/j.statistics.20150505.09.
Article Outline
1. Introduction
- In the present era of expanding globalisation, the exchange rate risk i.e. risk related to volatility of exchange rate, has become a primary concern in the financial world. The study of Laopodis (1997) shows that the volatility of exchange rate is harmful to economic welfare. Modelling and forecasting of foreign exchange rate have therefore become a crucial area of research as exchange rate risk has significant implications in the financial and economic world.Mauritius is also not spared by the threat related to the exchange rate volatility. The local economy has always been vulnerable to the volatility of exchange rates. Importation being generally done in US Dollars, the appreciation of the USD by 12.9% beginning 2015 have had some negative implications. Although there are hedging facilities for exchange rate risk, small firms are not able to accede to these products due to their expensiveness. As a result, the increasing exchange rate volatility has become an important issue for the Mauritian economy. This paper assesses the usefulness of asymmetric GARCH models as compared to the symmetric GARCH model to fit and forecast the volatility of USD/MUR exchange rate. Financial time series commonly exhibit volatility clustering and leptokurtosis (Mandelbrot, 1963). Another popular stylised feature is the leverage effect discussed in Black (1976) which explains that changes in volatility is negatively correlated with changes in the value of the financial asset. These empirical findings have therefore led to the development of various varying variance models for the modelling and the forecasting of financial time series. In his seminal study, Engle (1982) developed the Auto-Regressive Conditional Heteroscedasticity (ARCH) processes using lagged disturbances to model volatility. The ARCH model however proved through empirical studies that it requires a high ARCH order in order to capture significantly the dynamic behaviour of the volatility. The Generalised ARCH (GARCH) model allowing for a more flexible lag structure was then developed by Bollerslev (1986). This model drastically reduced the number of estimated parameters. The ARCH and the GARCH models both perform well in capturing the volatility clustering and the fat-tailedness of the financial returns, but fail in modelling the leverage effect. This limitation of the symmetric models has therefore led to the development of asymmetric models. These extensions to GARCH models include the Exponential GARCH (EGARCH) model by Nelson (1991), the Threshold GARCH of Zakoian (1994) (TGARCH), the Asymmetric Power ARCH (PGARCH) model by Ding et al. (1993) and the GJR model by Glosten et al. (1993). GARCH models have also the limitation of not being able to fully capture the leptokurtic feature of high frequency financial time series. To address this problem, Bollerslev (1987), Baillie and Bollerslev (1989), and Beine et al. (2002) have used the Student’s-t distribution to model the innovation of the variance equation whereas Nelson (1991) used the Generalized Error Distribution (GED). The major limitation of the latter distributions is that they are symmetric and hence don’t capture the asymmetry of the error distribution. In Rigby and Stasinopoulos (2005) and Choi and Nam (2008), the reparametrised Johnson SU distribution (JSU) is suggested to capture the skewness and fat tails of innovations in GARCH processes.Various studies have been done over the last decades across the world on the implementation of GARCH type models for volatility modelling and forecasting of financial time series. Bailie and Bollerslev (1989) proved the usefulness of GARCH models to perform analysis on the Forex market. The study of Akgiray (1989) also demonstrated that the GARCH model outperforms the ARIMA and ARCH models on the basis of various assessment criteria. The same conclusion was achieved by Hansen and Lunde (2005) in their study to model and forecast volatility of exchange rate. When the GARCH(1,1) was employed using fat-tailed error distributions, Wilhelmsson (2006) concluded that the accuracy of the volatility forecasts was improved as compared to an underlying Gaussian error distribution. He measured the forecasting ability using the Mean Absolute Error and the Heteroscedasticity-adjusted MAE loss functions. The study by Cheong Vee et al. (2011) on the modelling and forecasting of USD/MUR exchange rate volatility revealed that a GARCH(1,1) with an underlying GED error distribution outperforms its homologue with Student’s-t error distribution with a slight advantage. A few studies have been done where the skewed and leptokurtic Johnson SU (JSU) innovation is employed in the specification of GARCH processes. In his study, Simonato (2012) concluded that the large positive and negative shocks commonly affecting stock market returns are adequately captured by the JSU error distribution. Choi and Nam (2008) showed that GARCH processes with underlying JSU distribution provide an accurate fit of returns on stock indexes and exchange rates.Pagan and Schwert (1990), Lee (1991), Cao and Tsay (1992) and Balaban (2004) evaluated the predictive ability of various GARCH models for volatility of exchange rate returns. Their conclusion was that the asymmetric EGARCH model performs best thanks to its ability to capture the leverage effects. In the study of Olowe (2009), six GARCH models with underlying Student’s-t error distribution were fitted to the monthly returns of Nigerian Naira / Dollar Exchange rate. He concluded that the Asymmetric Power ARCH (PGARCH) and the TS-GARCH developed by Taylor (1986) and Schwert (1989) were the best models on the basis of the different evaluation criterion. Other studies on the forecasting of the conditional variance using asymmetric GARCH models have been done by Pagan and Schwert (1990), Meese and Rose (1991), Brailsford and Faff (1996), Loudon et al. (2000), Longmore and Robinson (2004) and Yoon and Lee (2008). This paper aims to evaluate the forecasting power of various GARCH-type models and to analyse their ability to capture stylised features such as volatility clustering and persistence, and leverage effects. The performance of the symmetric GARCH model and four asymmetric models (EGARCH, TGARCH, PGARCH and GJR-GARCH) is investigated in this study. The Student’s-t, the Generalized Error (GED) and the reparametrised Johnson SU (JSU) distributions are used to model the underlying innovation of the variance equation. Only a few studies have employed the reparametrised Johnson SU (JSU) as underlying distribution in GARCH processes. This study therefore compares the performance of the GARCH-type models under the three innovation specifications. The Mean Absolute Error (MAE) and Mean Square Error (MSE) are the loss functions used to compare the forecasting power of the models.
2. Data and Empirical Analysis
- The estimation performance is assessed on a dataset consisting of daily exchange rates of the US Dollar (USD) against the Mauritian Rupee (MUR) from January 5, 2004 to June 3, 2015. Two subsamples are composed from the dataset; an in-sample and an out-of-sample with 2617 and 230 observations respectively.The continuously compounded return
 is computed using the formula
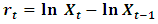 | (1) |
 and
and  are the USD/MUR exchange rates at time
  and
and  respectively. As volatility is unobservable, a good proxy is needed for it. Poon and Granger (2003) make use of the squared returns
  in their study as an estimator of the volatility. The time series plot of the USD/MUR exchange rates, the returns
  and the estimated volatility are displayed in Figure 1.
 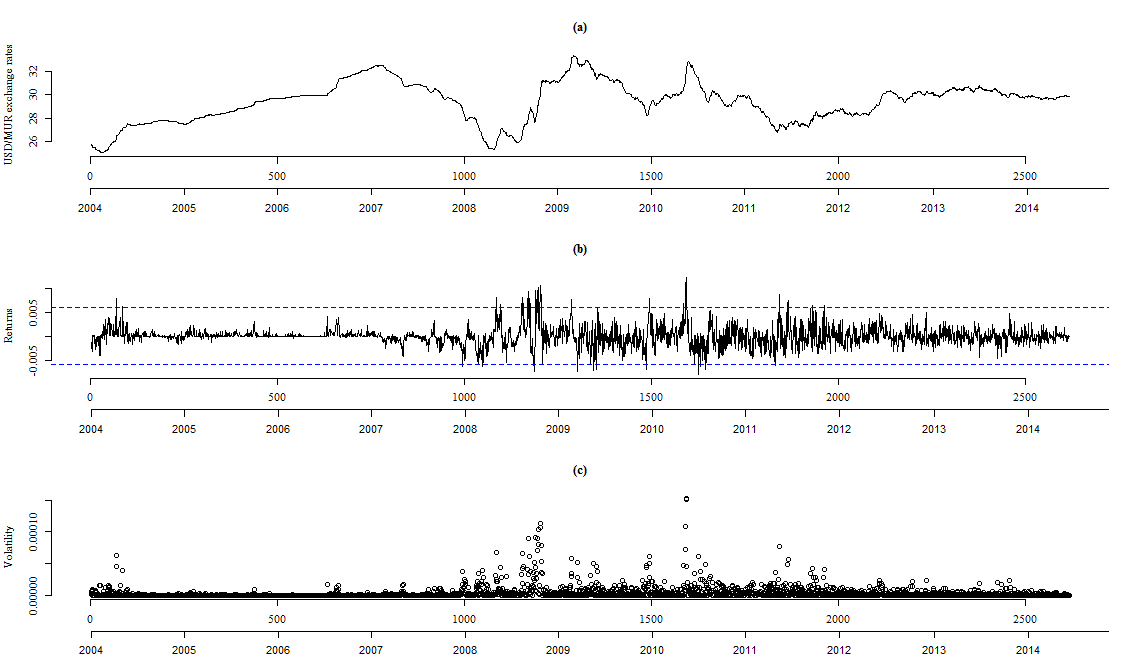 | Figure 1. (a) Rates, (b) Returns rt and (c) Volatility for USD/MUR exchange rates |
2.1. Empirical Properties
- A descriptive statistics is performed on the dataset of exchange rate return
 consisting of 2617 daily data points. The mean return of the exchange rates is close to zero (0.0055%) while the skewness (0.81) and the Kurtosis (10.82) show that the returns depart from a normal distribution. The return distribution shows a positive skewness and a significant fat-tailedness. The results of statistical normality tests are displayed in Table 1.
|
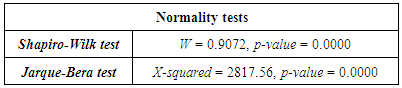
 | Figure 2. Graphical tests for normality |
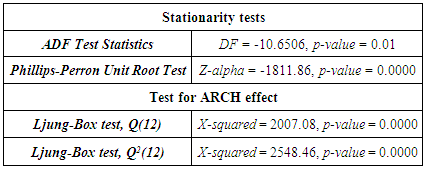
 .Statistical tests are employed to test the stationarity behaviour and the presence of ARCH effects. The corresponding results are presented in Table 2.
|
2.2. Model Building
- Figure 3 displays in (a) and (b) the auto-correlation function plots for the returns and the squared returns. The presence of autocorrelation is observed in both series up to high lags, confirming the occurrence of the volatility clustering feature. It can be deduced from the ACF and PACF plots that an ARMA process can be fitted. ARMA(p,q) processes for different values of p and q are fitted to the data. The best ARMA model is selected on the basis of the highest Log-Likelihood and the lowest AIC and BIC scores. The ARMA(1,1) is therefore retained to model the mean equation in the GARCH models.
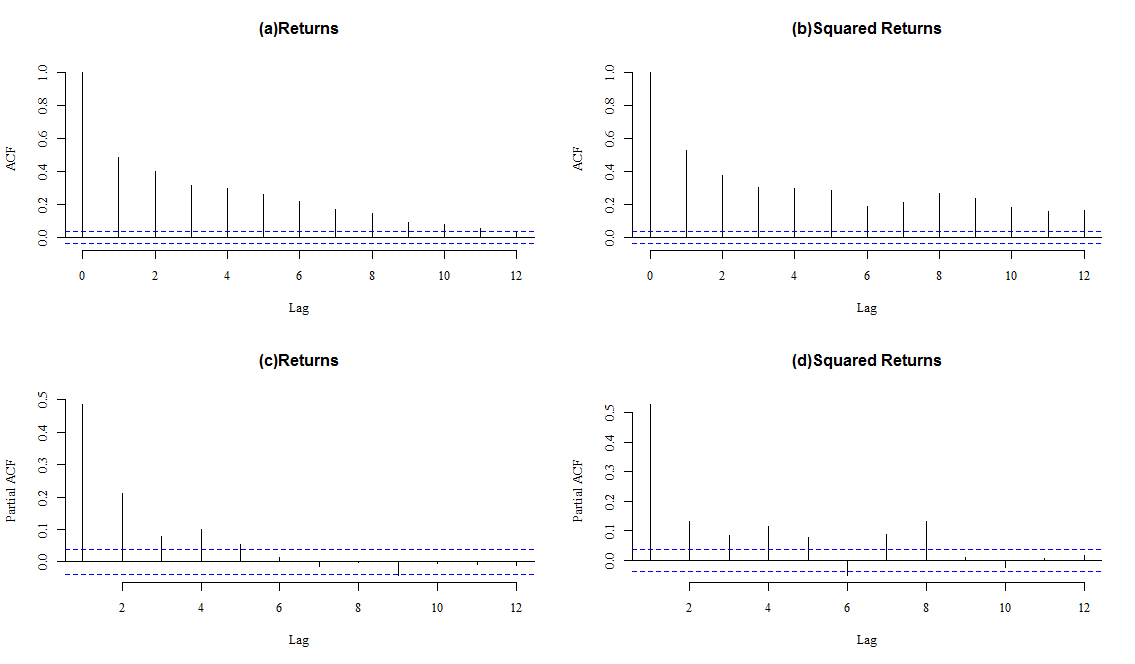 | Figure 3. ACF and PACF plots for USD/MUR returns and squared returns |
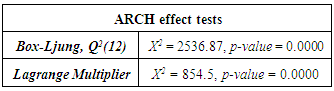
2.3. ARCH Effects Diagnosis of Residuals
- The diagnosis for ARCH effects on the residuals of the ARMA(1,1) process reveals that the null hypothesis of independence is rejected at a significance level of 5%. Table 3 displays the corresponding results of the statistical tests employed.
|
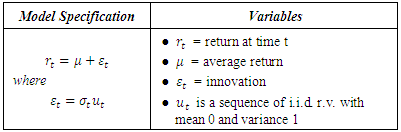
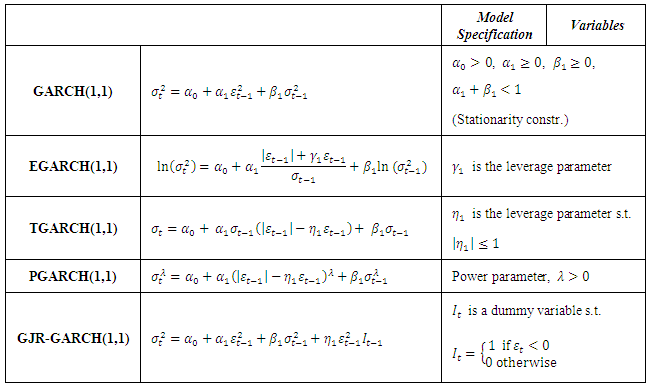
3. Methodology
- This study compares the fitting and the forecasting power of the symmetric GARCH(1,1) model against four asymmetric GARCH models namely the Exponential GARCH (EGARCH(1,1)), the Threshold GARCH (TGARCH(1,1)), the Asymmetric Power ARCH (PGARCH(1,1)) and the GJR-GARCH(1,1). Table 4 and Table 5 define how the mean equation and the conditional variance are specified under the different GARCH models.
|
|
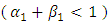 , the unconditional variance of
  remains constant while the conditional variance varies. The unconditional variance of
  is defined by:
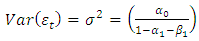 | (2) |
 which captures the asymmetric effects of past shocks. If this parameter is positive, then bad news increases volatility and the leverage effect can be evoked.The Student’s-t distribution, the Generalised Error Distribution (GED) and the reparametrised Johnson SU distribution (JSU) are employed to model the innovation
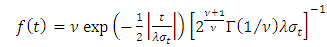
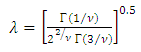
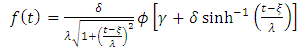
  . These are distributions with higher kurtosis than the Gaussian distribution, hence corresponding better to the fat-tailed distribution of the returns. While the Student’s-t and the GED are symmetric distributions, the JSU distribution is a skewed one hence capturing the asymmetry of the error distribution.The probability density functions for the Student’s-t, the GED and the JSU distributions are as follows:○ Student’s-t distribution
 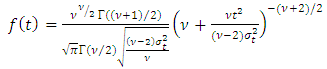 | (3) |
 | (4) |
 | (5) |
 | (6) |
 is the density function of
  and
and  are location and scale parameters respectively.
  can be interpreted as a skewness parameter; the distribution having a positive skew if
  and a negative skew if
 can be interpreted as a kurtosis parameter. As stated by Alexander (2011), the Johnson SU distribution is in fact most relevant for financial applications, since it can fit data with leptokurtic and skewed distribution. Despite this flexibility, the JSU distribution has however the disadvantage that it is not guaranteed to exist for any set of mean, variance, skewness and kurtosis.The ‘rugarch’ package by Ghalanas (2014) is used to perform the model fitting and forecasting of the GARCH-type models on the exchange rate data.
 4. Estimation Results
4.1. In-sample Performance
- The in-sample performance is measured on the basis of the fitting estimation of the GARCH(1,1), EGARCH(1,1), TGARCH(1,1), PGARCH(1,1) and GJR-GARCH(1,1) using the Student’s-t, the GED and the JSU innovations on the in-sample dataset. The estimation of the parameter values and corresponding p-values are displayed in Table 6. A significance level of 5% is retained for the analysis.
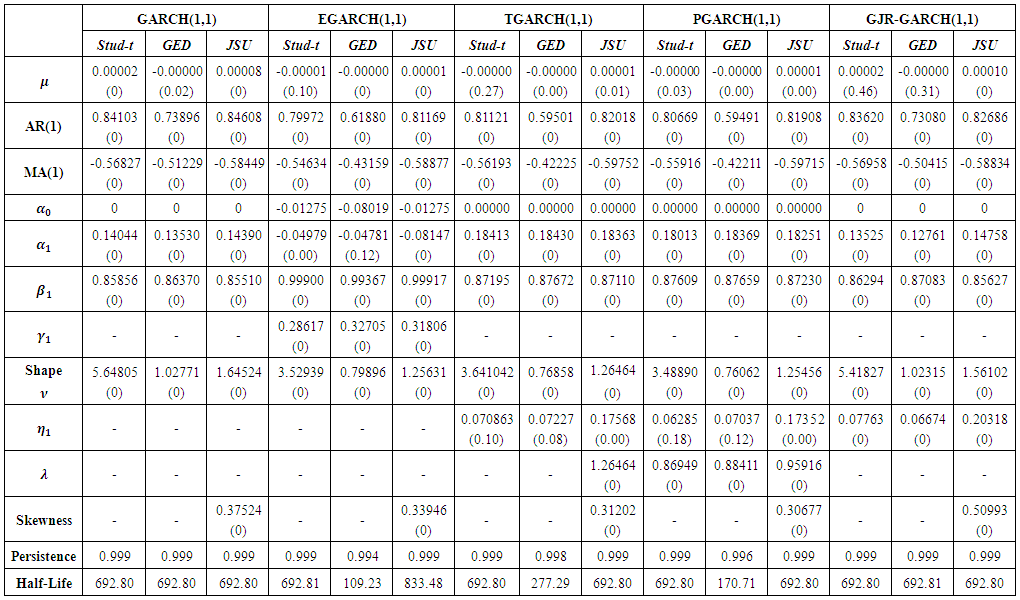 | Table 6. Parameter estimates with corresponding p-values for GARCH-type models |
 parameter for some of the asymmetric models. It can be seen that the estimates for
  are close to zero value. The high significance of the
  estimate under the models validate the presence of volatility clustering in the exchange rate returns. The results for the leverage parameters
  and
and  parameters confirm the presence of leverage effect at a 5% significance level in all the asymmetric models under all the innovations. Furthermore, the leverage parameters are all positive values hence confirming that bad news tend to increase volatility. All the shape parameter
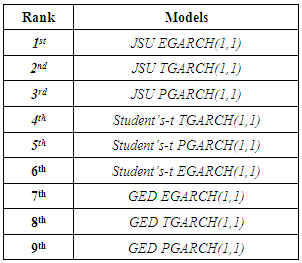
  estimates are statistically significant and this observation leads to conclude that the respective distributions of the return series have fatter tails that the Gaussian distribution hence supporting the appropriateness of the Student’s-t, the GED and the JSU distributions. The skewness parameter of the JSU distribution for the five GARCH models is statistically significant and has a positive value, hence showing that the innovation distribution is positively skewed. This result is in accordance with the empirical analysis on the returns distribution which showed a positive skewness.The persistence values being less than one for all the models, the volatility forecasts will converge towards an unconditional volatility. The half-life values need to be checked before performing volatility forecasting as there may be depletion of the conditional volatility during the 230 out-of-sample steps ahead forecasting. All the models except the GED EGARCH(1,1) and the GED PGARCH(1,1) have a half-life greater than 230, hence deducing that the volatility forecasts will not deplete within the prediction horizon. Table 7 displays the results for the model selection criteria. The model with the highest Log Likelihood and the lowest AIC and BIC statistics is the best in-sample model. Table 8 shows the ranking of the models in terms of the above criteria.
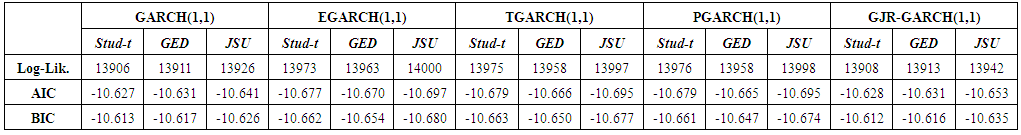 | Table 7. Results for in-sample performance |
4.2. Forecasting Performance
- The in-sample performance analysis revealed that the asymmetric GARCH models performed well in fitting the exchange rate returns. The out-of-sample performance is analysed for the different models.Volatility forecasts are produced on the 230 out-of-sample data points (July 1, 2014 to June 3, 2015) using the five GARCH models. The graphs from Figure 4 display the out-of-sample estimation for the volatility and the return series for the TGARCH(1,1) model with Student’s-t, GED and JSU underlying error distributions. The TGARCH(1,1) actually proved to be among the best in-sample models in the previous analyses.
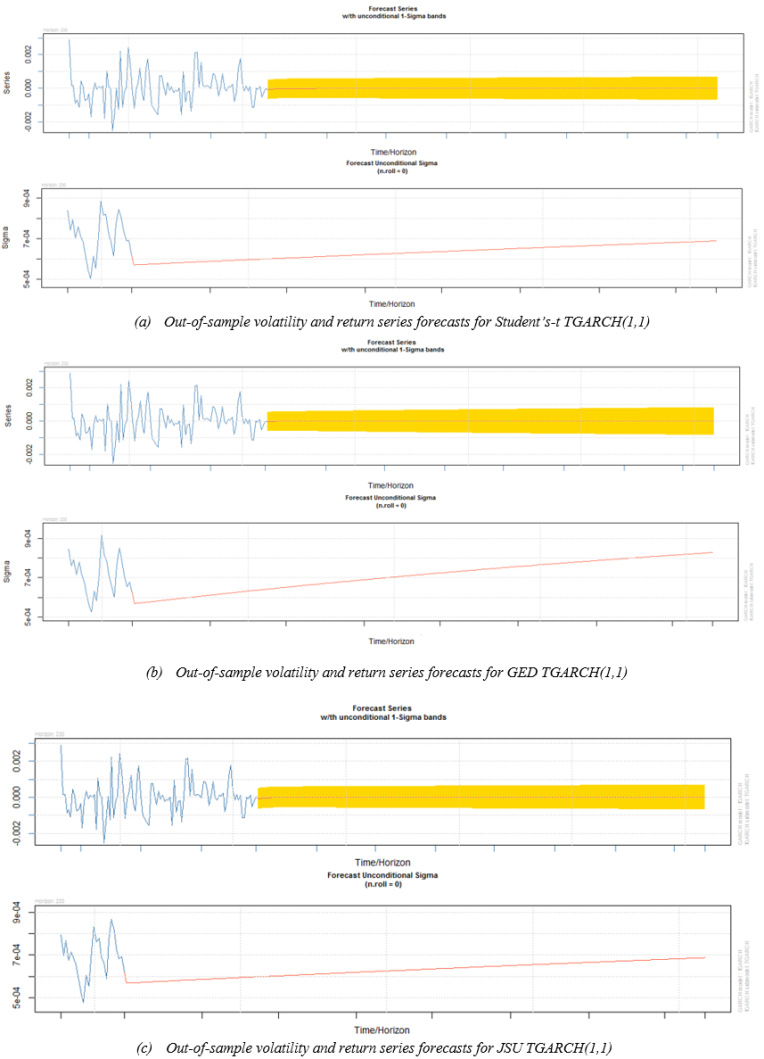 | Figure 4. Volatility and return series forecasts for TGARCH(1,1) models |
|
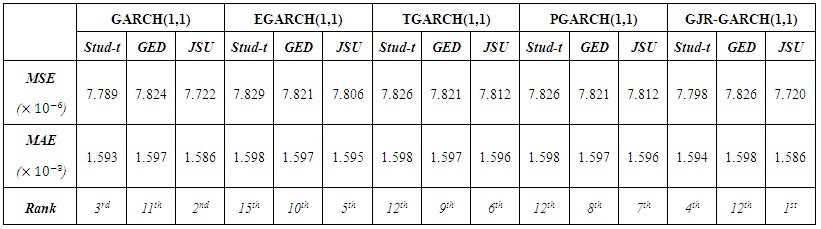 | Table 9. Error Statistics values for the forecasting performance |
5. Conclusions
- The exchange rate volatility is one of the most influencing actors in the Mauritian economic environment. There have been therefore numerous economics and statistics studies which have been analysed, modelled and forecasted the fluctuations in the foreign exchange market. The importations of Mauritius are generally done in US dollars and the volatility in the USD/MUR exchange rate has a considerable impact on the local economy. This study studied the forecasting ability of asymmetric GARCH models (EGARCH(1,1), TGARCH(1,1), PGARCH(1,1) and GJR-GARCH(1,1)) as compared to the symmetric GARCH(1,1) model on the volatility of USD/MUR exchange rate.The underlying error distributions employed in the models are the Student’s-t, Generalised Error Distribution (GED) and the reparametrised Johnson SU distribution (JSU). The daily observations of the USD/MUR exchange rates (from January 5, 2004 to June 3, 2015) are used for the estimation procedures. The distribution of the return series exhibiting fatter tails that the Gaussian distribution, supports the use of the Student’s-t, the GED and the JSU to model the innovation. The use of the skewed JSU distribution is empirically validated by the return distribution being positively skewed.The results from the model fitting analysis show that there is evidence of the presence of volatility clustering and leverage effect in the financial series. In terms of the in-sample performance, the JSU EGARCH(1,1) proves to be the best model followed by the JSU TGARCH(1,1) and the JSU PGARCH(1,1). Their respective Student’s-t and GED homologues also perform better that the GJR-GARCH(1,1) and the symmetric GARCH(1,1) models. The JSU error distribution performs best as compared to the Student’s-t and the GED distributions under all GARCH models. The MAE and the MSE metrics for measuring the forecasting accuracy show that all the GARCH-type models exhibit relatively same forecasting power. A slight advantage is however noted for the JSU GJR-GARCH(1,1) and the JSU GARCH(1,1). As in the in-sample analysis, the JSU underlying distribution outperforms the Student’s-t and the GED under all GARCH models.The in-sample and out-of-sample estimation results show the suitability of asymmetric GARCH-type models in predicting the volatility of USD/MUR exchange rates. It is to be noted that the best models in both analyses have an underlying JSU distribution. As an extension to this study, other skewed innovation distributions such as the skewed Student’s-t and the skewed GED could be employed under the asymmetric GARCH models. Another further research would be to implement multivariate GARCH processes in modelling volatility for various MUR foreign exchange rates.