-
Paper Information
- Paper Submission
-
Journal Information
- About This Journal
- Editorial Board
- Current Issue
- Archive
- Author Guidelines
- Contact Us
International Journal of Statistics and Applications
p-ISSN: 2168-5193 e-ISSN: 2168-5215
2015; 5(5): 231-236
doi:10.5923/j.statistics.20150505.07
Pairwise Comparison of Coefficients of Variation for Correlated Samples
 Abstract
 Reference
 Full-Text PDF
 Full-text HTML
Aruna Kalkur T. 1, Aruna Rao K. 2
1Dept. of Statistics, St. Aloysius College, Mangalore, India
2Dept. of Statistics, Mangalagangothri, Karnataka, India
Correspondence to: Aruna Kalkur T. , Dept. of Statistics, St. Aloysius College, Mangalore, India.
| Email: |  |
Copyright © 2015 Scientific & Academic Publishing. All Rights Reserved.
In this paper we propose pairwise comparison procedure for testing equality of Coefficients of Variation (C.V) of two or more groups when the observations are correlated and normally distributed. Twelve versions of the Wald test based on C.V and Inverse Coefficients of Variation (I.C.V) are proposed. The simulation results indicate that Wald test based on I.C.V, which uses the upper αth percentile value of the central Chi square distribution with 1 degree of freedom as critical value maintain experiment error rate and emerges as the best test in terms of power of the test. The procedure is illustrated by analyzing the stock prices of Bombay Stock Exchange, India.
Keywords: Pairwise Comparison, Coefficient of Variation, Normal Distribution, Chi Square Distribution, Stock Exchange
Cite this paper: Aruna Kalkur T. , Aruna Rao K. , Pairwise Comparison of Coefficients of Variation for Correlated Samples, International Journal of Statistics and Applications, Vol. 5 No. 5, 2015, pp. 231-236. doi: 10.5923/j.statistics.20150505.07.
Article Outline
1. Introduction
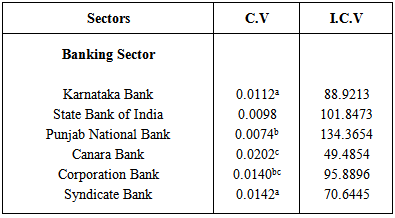
- Multiple testing is a part of any scientific investigation [2], when the null hypothesis of testing for equality of several parameters is rejected. The interest boils down to identify the subsets of parameters which are equal. Such procedures will help to identify the best treatment effect. Although Fisher proposed the Least Significance Difference (LSD) test for pairwise comparison of means, the growth of the research papers in this area started from late 1940 and early 1950. Multiple comparison procedure of means has independent existence and is commonly applied when the analysis of variance F test is significant. Rao and Swaroopchand [16] have classified such procedures into four categories.a) Pairwise multiple comparison procedure: In this we test for equality of parameters θi – θj, for i≠j.b) Pairwise comparison of treatment with control: Agricultural and pharmaceutical experiments normally have a control treatment or group which is identified before the experiment. Call this group c. Here we test for the equality of θi and θc, where i refers to the treatment groups.c) Comparison with the best: Consider θi – max(θj, j=1,...k), i=1,…,kd) Multiple comparison with mean: Here the primary interest is in the comparison of
 or
or  for all i=1,…k, where
  and
and  are the unweighted and the weighted mean of
  Text books on Design and Analysis of Experiments discuss several well-known procedures like Fisher’s Least Significance test, Bonferrroni procedure, Tukey’s procedure, Sheffe’s procedure and Duncan’s multiple range procedure for mean [3]. The text book by Hochberg and Tamhane and Hochberg [21] discusses various multiple comparison procedure and list of references till that time. This is updated in the text book by Hsu [6]. There were several review papers in the literature like Ludbrook [13], Sarkar [20] and Pennello [15] which discuss the recent work on multiple comparison procedures for means. In an extensive review paper, Rao and Swaroopchand [16] cited 572 references. Research is still carried out in this area and some of the recent research references are Ramsey et al. [18], Ramsey et al. [19], Gelmane et al. [4], Jafari and Kazemi [8] and Koopel and Alvandi [12].In the recent years various papers have appeared for testing equality of Coefficients of Variation of Normal and other distributions. Some of the recent references are Rao and Raj [17], Boiroju and Reddy [1], Krishnamoorthy and Lee [11] and Hayter and Kim [5]. For earlier works on CV refer to the citations in the preceding papers.All these papers consider the case of independent samples. Using the idea of generalized p value Jafari and Behboodian [7] proposed the test for testing the equality of C.Vs of two or more related normal distributions. The implementation of the test is not simple as it requires generation of random samples from Wishart distributions and is thus not appealing to the applied researchers. Kalkur and Rao [9] derived Likelihood Ratio, Wald and Score test for testing equality of C.Vs for the bivariate normal distribution. They concluded that Wald test based on Inverse Coefficient of Variation (I.C.V) maintains the level of significance and has better power properties compared to other tests. Kalkur and Rao [10] used the Wald test based on I.C.V for the pairwise comparison of C.V of several stock prices. In pairwise comparison procedure the hypothesis θi – θj is tested at the level of significance α. When we pool the results of these tests, the family (Experiment) wise error rate may not be equal to α. Kalkur and Rao [10] did not attempt to check the family wise error rate of the test based on I.C.V. In this paper, we have attempted to estimate the family wise error rate of the tests based on C.V and I.C.V using simulation.We have restricted our attention to the Wald test based on C.V as well as I.C.V. When we have samples from Multivariate Normal Distributions, no simple tests exists for testing equality of C.V. Simulation result indicate that the pairwise comparison procedure based on the Wald test can also be used for testing the equality of C.Vs of correlated normal samples.The organization of the paper is as follows.Description of pairwise comparison procedures of C.Vs are presented in the section 2. In section 3, the procedures are compared through simulation. The result suggest that Wald test based on I.C.V maintain type I error rate and have larger power for contiguous alternatives and converges faster to the value of 1 compared to other tests. In Section 4, we use this test for analyzing the stock market data. The paper concludes in section 5.
2. Pairwise Comparison Procedures for Testing Equality of C.Vs
2.1. Test Statistic
- Given a random sample of size n from a multivariate normal distribution with parameters
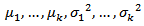 and the common correlation coefficient
  Let
Let  denote the C.V for the ith component namely
  Let
Let  denote the I.C.V for the ith component namely
  Let
Let  denote the m.l.e. of
  and
and  respectively.
 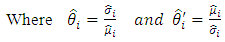 Let
Let 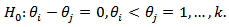 The Wald test statistic for testing the equality of C.V is given by
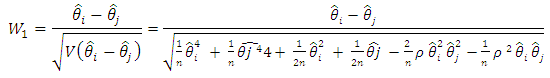 The Wald test for testing the equality of I.C.V is given by
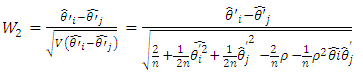 Under H0, W12 and W22 are asymptotically distributed as central Chi-square with 1 degree of freedom.When we have a random sample from a k(>2) variate normal distribution with parameters
 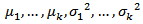 and the common correlation coefficient
  the pairwise procedure consists of testing
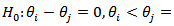
 The hypothesis
  is declared as significant if any one of the pairwise comparison is significant. This constitutes the experiment wise error rate for testing equality of C.V’s for k normal distribution. For the pairwise comparison we can either use the test statistics
  or
or  where
where  and
and  refer to
  and
and  The pairwise procedures for C.V used in this paper are suitable modification of the pairwise procedures for mean.
2.2. Description of the Pairwise Procedures
- 1. Procedure 1
 In a similar manner to Fishers LST, we use test statistic
  and the critical value
  where
where  refers to upper
  percentile value of the central Chi-Square distribution with
  degrees of freedom (d.f).2. Procedure 2
  We use Bonferroni approach and use the statistic
  and the critical value
  3. Procedure 3
  We use the test statistic
  and the critical value
  The reasoning for this approach is that the Wald test for equality of C.V uses the critical value
  4. Procedure 4
  We use the test statistic
  and the critical value
  where
where  refers to upper
  percentile value of the F distribution with
  and
and  d.f. This approach is similar to the procedure P3.5. Procedure 5
  This procedure is similar to the Bonferroni approach using F distribution and is similar to the procedure P2. We use the test statistic
  and the critical value
  6. Procedure 6
  In this procedure we use the test statistic
  and the critical value
  This is motivated by the test statistic used in the analysis of variance.The procedures
  to
to  uses the test statistic
  and the associated critical value as in
  to
to 
3. Finite Sample Comparison of the Tests
3.1. Simulation Experiment
- The purpose of this paper is to suggest a pairwise comparison procedure of C.V which maintain both comparison wise and experiment wise error rate. This will enable the applied researchers to use the suggested procedures. In order to compare the 12 procedures, a simulation experiment was carried out using 10,000 simulations. For the estimation of family wise type I error rate, a sample of size n (n=10, 20, 40) was generated from a k (k=3, 6) variate normal distribution with a common value of C.V θ (θ=0.1, 0.3, 0.5, 0.7, 0.9). The values of correlation coefficient used in the investigation ranges from -0.9 to 0.9 with an increment of 0.2. In addition of these values ρ=0 is also included. If any one of the pairwise comparison test statistic exceeds the critical value, the null hypothesis of equality of C.V is rejected. The experiment wise error rate is the number of times the null hypothesis is rejected out of 10,000 simulations. The upper αth percentile value of the simulated distribution of the test statistic was also noted down. For estimating the type I error rate, the values of
 and
and  used in simulation are
  and
and 
 For the power comparisons the value of C.V is changed in either direction from the null hypothesis. The details are presented in section 3.3. The level of significance is taken as α=0.05. The estimated experiment wise error rate for the tests P1’ for k=3 and 6 are presented in table 3.1a and 3.1b respectively. (As is the only test maintaining experiment wise error rate for all values of C.V. and correlation coefficient).
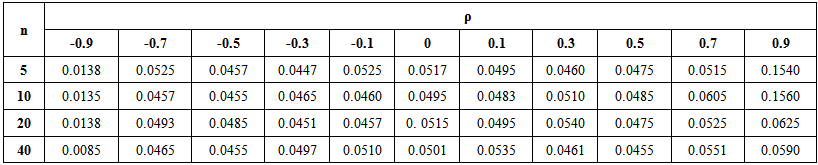 | Table 3.1a. Type I Error Rate for the test P1(θ=0.1), k=3 |
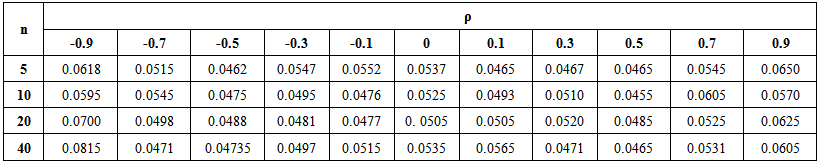 | Table 3.1b. Type I Error Rate for the test P1(θ=0.1), k=6 |
3.2. Estimated type I Error Rate
- From the tables 3.1 a, b it follows that Wald test for I.C.V (P1’) maintains type I error rate for all the values of correlation coefficient, all the values of C.V, all the sample sizes and all the values of k, considered in the simulation. We say that a test maintains type I error rate if the size of the test is in the interval (0.045, 0.055) that is 0.05 ±0.005. A similar approach is used by Nairy and Rao [14]. It may be noted that for the test the critical value is the upper αth percentile value of the central Chi square distribution with 1 degree of freedom. For other five tests based on I.C.V, type I error rate is maintained for smaller values of C.V (<0.4) and for the correlation coefficient between -0.7 to 0.7. These five tests used modified critical value as explained in section 3.1. For the six tests based on C.V, type I error rate is not maintained.
3.3. Estimated Power Function
- For comparing the power of the various tests, it is important to ensure that all the tests have the same size. Since 11 tests do not maintain experiment wise type I error rate, for the computation of the power of the test, for these 11 tests the critical value is taken as αth percentile value of the simulated distribution. Fixing the value of
 the values of
  and
and  for remaining (k-1) groups are fixed using the relation
 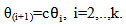 Deciding the value of
  is computed using the relation
  the value of
  is kept the same across the groups and is equal to 100. The power function is computed for different values of c. In the figures 3.3a, 3.3b, 3.3c, 3.3d, 3.3e and 3.3f, the estimated power curve for the sample size n=20 when k=3, 6 and correlation coefficient ρ=0.1(Although the power of the test is considered for all values of ρ and C.Vs, only ρ=0.1 and C.V=10% is presented here) are presented, the values represented along the x-axis are
  this is done so as to have an easy interpretation. From the figures and the results which are not presented here for other sample sizes and correlation coefficients it follows that for local alternative the power of the Wald test P1’ is greater compared to the other 11 tests. As we move away from the null hypothesis in either direction, it is difficult to distinguish the power curves of the 6 tests based on I.C.V. The behavior of the power curves for the 6 tests based on C.V are similar. However the rate of convergence of the power curves to the value 1 is faster for the test based on I.C.V.
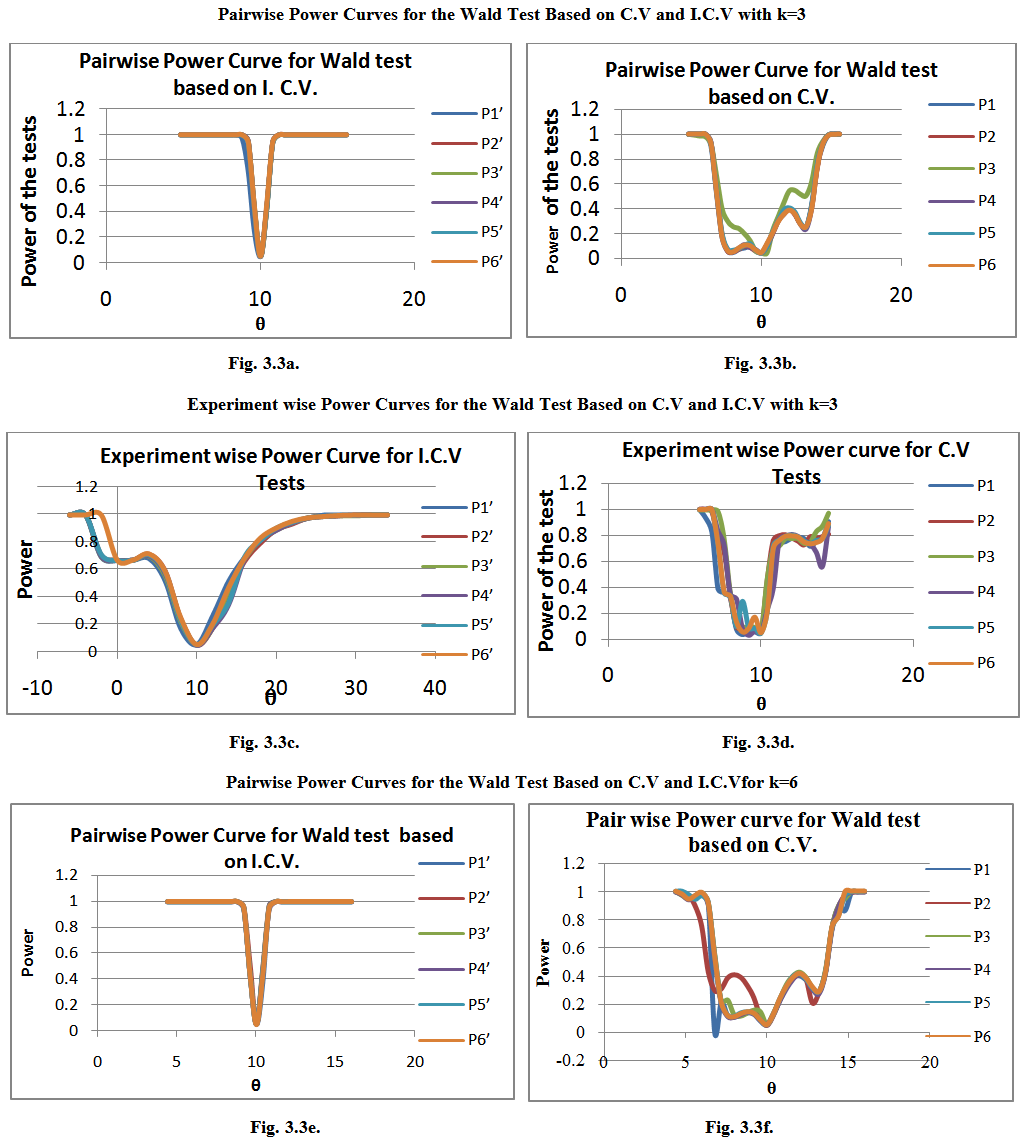 | Figure 3.3. |
3.4. Discussion
- From the estimated experiment wise type I error rate and power of the test for all configurations, it follows that Wald test based on I.C.V (P1’) with a critical value of
 is the best test as it maintains type I error rate for all values of C.V and correlation coefficient. When the power function of the entire test procedures are compared, the procedure P'1 emerges as the best test as it has higher power for local alternatives and the power curve converges faster to the value 1.All test procedures based on I.C.V has marginally high power for modest alternatives compared to the test procedures based on C.V. The salient difference is that the rate of convergence of the power function to 1 is faster for all test procedures based on I.C.V compared to C.V.When k=6 there are
  comparisons and the estimation of the type I error rate and the computation of the power curve takes a very long time on a PC. For the computation of type I error rate, the average time is approximately 6 to 8 hours. This computational burden has prevented us to make the comparison for higher values of k.
4. Analysis of Stock Market Data
- The purpose of this paper is to use the procedure developed in the previous sections for the analysis of Stock market data. The data corresponds to average daily price of different stocks reported by Bombay Stock Exchange (BSE) India Limited. The reference period is 10-01-2014 to 10-02-2014. Six sectors were considered for the analysis. They correspond to Banking, Information Technology, Pharmaceutical, Infrastructure, Consumer goods and Automobile sectors. Two scenarios were considered. In the first scenario 3 stocks were randomly selected from each sector and in the second scenario 6 stocks were considered from each sector. Log transformation is used before the analysis as a customary in the stock analysis.The Q-Q plot not reported here for the transformed observations indicated that the underlying distribution is normal. Although the analysis is carried for the 6 sectors, the results are presented only for banking sector. Table 4.1 presents the maximum likelihood estimates of the C.Vs. The C.V’s having common letters are not significantly different from each other.
|
5. Conclusions
- Testing for equality of C.Vs of two or more groups is often encountered by the applied researchers. When the null hypothesis is rejected the interest lies in forming groups, where the C.Vs between the members of these groups are equal and the C.Vs between the members of this group and a member from any other group are not equal. Pairwise comparison procedure for C.V is not done in the past and we have proposed tests based on C.V and I.C.V. The pertinent question then is to check the experiment wise error rate of these procedures. The simulation result indicates that Wald test based on I.C.V (P1') which uses the upper αth percentile value of central Chi square distribution with 1 d.f as critical value, maintains comparison wise and experiment wise type I error rate for small and modest number of groups. The power comparison indicates that the test is powerful enough to detect small departure from the null hypothesis.The advantage of pairwise comparison procedure is that the same procedure can be used for testing equality of C.V of more than two groups. When the observations are correlated for testing the equality of C.V of more than two groups, Jafari and Behboodian [7] proposed a test based on the generalized p value. In their paper, as in our paper, he assumes that the observations follow a k variate normal distribution. This procedure is computationally tedious and the procedure proposed in our paper is computationally simple and can be used by applied researchers. For each component of the multivariate normal distribution, Q-Q plot can be used to check whether it follows univariate normal distribution and thereby to check whether the observations are from the k variate normal distribution. In most application, the variables are transformed variables for the normal distribution and the proposed test can safely be used by the applied researchers. The research on C.V, till now have concentrated around normal distribution. In reliability and survival analysis Lognormal, Weibull and Loglogistic distribution is very often used. These three distributions belong to the class of log locations scale family. The future research work on C.V should concentrate around the distribution belonging to log locations scale family.