Ghasem Rekabdar , Bahare Soleymani
Department of Mathematics, Abadan Branch, Islamic Azad University, Abadan, Iran
Correspondence to: Ghasem Rekabdar , Department of Mathematics, Abadan Branch, Islamic Azad University, Abadan, Iran.
| Email: |  |
Copyright © 2015 Scientific & Academic Publishing. All Rights Reserved.
Abstract
In this study, the effect of stratified sampling design has been studied on the accuracy of Fisher's linear discriminant function or Anderson's  . For this purpose, we put on weighted estimators in function
  instead of simple random sampling estimators. The results of a simulation study indicated that the performance of
  affected by alteration of sampling methods. The performance of proposed discriminant function
  in comparison to the classical discriminant function is more appropriate. Specially, in case of the mean of strata have significant difference compared with the overall mean of each group.
Keywords:
Fisher's linear discriminant function, Multivariate normal distribution, Stratified sample design
Cite this paper: Ghasem Rekabdar , Bahare Soleymani , Effect of Sampling Methods on Misclassification of Fisher's Linear Discriminant Analysis, International Journal of Statistics and Applications, Vol. 5 No. 5, 2015, pp. 208-212. doi: 10.5923/j.statistics.20150505.04.
1. Introduction
The discrimination between two groups using multivariate data has been recognized as an important problem that was firstly studied by Fisher (1936). The linear discriminant function (LDF) is a standard approach to yield optimal results when the two groups have a conditional multivariate normal distribution with distinct mean vectors and common covariance matrix (Mardia & et al, 1979). Computing the misclassification probabilities or error rates of the discriminant function are interesting issues. When competing groups have known parameters, the LDF distribution can be obtained exactly by univariate normal distribution (Johnson & Wichern, 1992). In practice, the parameters of the LDF are unknown. Then we estimate these parameters by means of independent random "training samples". The sample distribution of LDF has been studied by several authors. Anderson (1973) obtained the asymptotic expansion of the distribution of the sample Fisher's linear discriminant function  in terms of order
  . Atakan (2009) compared the performance of seven well known methods in literature to estimating probability of misclassification by bootstrap percentile confidence intervals. This research can provide a good literature review for more study.In several researches, the sampling design effects on statistical methods have been studied. Especially, in regression analysis effect of sampling designs on least square estimator studied by some authors (DuMuchel & Duncan, 1981; Horton & Fitzmaurice, 2004). Also, in analysis of variance about mean difference of groups, effect of cluster sampling design on ratio studied in social and psychological survey, frequently (Hegges & Rhoads, 2011). In multivariate statistical analysis, complex sampling design lead to complicated methods. However, little study has been dedicated to the effect sampling methods on LDF because analytical complexity. Nonetheless, some researchers examining the effect of sampling design on the misclassification probability of the LDF (Kao & McCabe, 1991; Leu & Tsui, 1997). In light of stratified random sampling, Tsui & Leu (1998) indicated that asymptotic expansion of LDF has an error of order
  . Therefore, using of LDF without correction can increases the probability of misclassification. Recently, Shahrokh Esfahani & Dougherty (2014) by simulation study showed that separate sampling with an inappropriate sampling ratio can significantly reduce classification accuracy of LDF.The main contribution of the present paper is to approximate LDF probability of misclassification using weighted estimators. In some researches, we have auxiliary information about the groups and it is beneficial to use it to construct LDF. For example, we can be able to categorize each group on the basis of a qualitative variable. In this case, stratified sampling design can be used to draw data from each group. In this study, we substitute unbiased weighted estimators in LDF when the sample design is stratified. Also, a comparison between two linear discriminant functions is made by a simulation study.
2. Preliminaries for the LDF
In this section, we introduce some preliminaries of the LDF. Suppose  and
and  denote two distinct groups whose known multivariate probability density functions of p-dimensional random vector
  are denoted by
  and
and  , respectively. We use
  to denote the probability of misclassification an observation
  into group
  when, in fact, it belongs to the group
  . Let
. Let  and
and  be the prior probabilities of the groups, then the total probability of misclassification (TPM) is defined as
 According to the Bayes optimal classification rule, TPM is minimized when a new observation
  is classified into group
  by
by | (1) |
Where 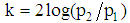 . If the prior probabilities in each group are taken equal, then cut-off value is
  . Also, if the multivariate normal densities with common covariance matrices are used in previous equation, then the LDF is given by
 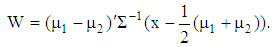 | (2) |
Using the Equation (2), a new observation  is assigned into the group
  when
when  . In the case of,
  , this observation is assigned into the group
  . Suppose that the prior probabilities are taken to be equal i.e.
  , then the TPM is defined as
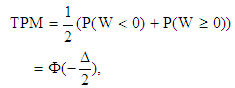 | (3) |
where  is the cumulative distribution function of standard normal random variable and
  is Mahalanobis distance between the groups, i.e.,
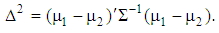 | (4) |
3. Sample LDF
In this section, we illustrate the sample representation of the Fisher's linear discriminant function (2) under random sampling and stratified designs.
3.1. Random Sampling
Suppose we have  observation
  drawn from
  and
and  observation
  drawn from
  , where
  . We estimate the parameters (2) by the unbiased sample means
 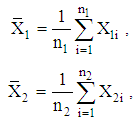 and
and 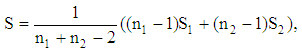 where
where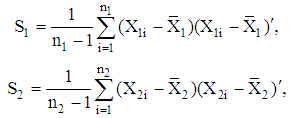 respectively. Then, the discriminant functions (2) can be modified as
  yields a plug-in discriminant function is given by
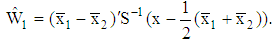 | (5) |
In this case a natural estimate of (4) is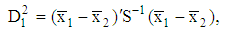 | (6) |
and the estimated of the total misclassification probability is given by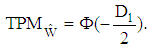 | (7) |
3.2. Stratified Sampling
Suppose the groups  where
where  split into
  parts
parts  where
where  . If the group size is denoted
  then
then 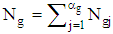 , where
  is denoted size of
  . Also, we select a random sample
  of fixed size
  from each group, where
 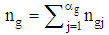 . We furthermore assume throughout that the designs are simple without replacement within each stratum. In light of this design, the unbiased estimation of means in each group is given by
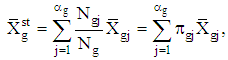 where
where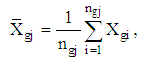 is mean estimation of the
  stratum of group
  and weight of stratums are
  . Also, if we suppose the covariance matrix into each stratum is common then unbiased estimation of the covariance matrix
  is defined by
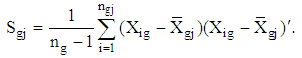 If weighted estimation
 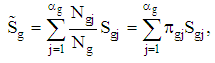 is assumed in each group then the pooled covariance matrix is given by
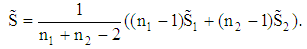 By substituting these unbiased estimators into (2), we obtain a new sample LDF
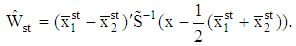 | (8) |
Similar to (6) we define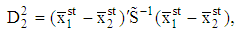 | (9) |
therefore, the total probability of misclassification is estimated by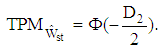 | (10) |
Clearly, in the case of Mahalanobis distance (9) is greater than (6), then the Equation (10) is less than (7). Thus, the stratified sampling designs can provide greater efficient estimates than corresponding random sampling in discriminant analysis.
4. Simulation Study
In this section, we examine the performance of sample discriminant function  in comparison
  by conducting numerical experiments. It is further noted that Mathematica software was used to write program codes for numerical calculation. The package is available from the authors upon request.Suppose the group sizes are equal i.e.,
  and each group is categorized into two stratums. The first group size of stratums are considered
  and the second group
  . Therefore, the weights of stratums are
  respectively. The covariance matrix structure considered in this examination in each group and stratums by
 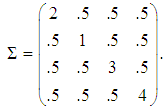 The stratum means of each group are defined by
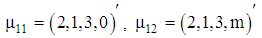 and
and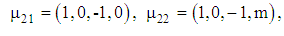 The parameter controlling distance between two stratums and we consider its values 0, 2 and 5, respectively. Therefore, the vector mean of each group is given by
 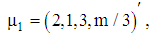 and
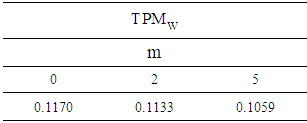
and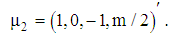 The exact total probability misclassification of population discriminant function (2) in terms of (3) is demonstrated in Table 1. From the table, we can see that the
  of
of  is scale down when
  is increasing.
Table 1. Exact
 of population LDF of population LDF
 |
| |
|
In each simulation, we generate random samples from four normal populations conditional distributions  where
where  . In each simulation the size of samples considered
 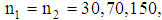 respectively. The samples divided in each group equally. Also, each simulation was run 100 times. Thus, the results presented in Table 2 are the average of estimated total probability misclassification. When the parameter
  increased then
  of
of  decreased for all sample sizes. While, by increasing
  the
the  of discriminant function
  has been increased except for sample size 30. Also, when the sample size increased then
  of discriminant functions
  and
and  tend to
  of
of  obtained in Table 1. For
  the
the  of
of  is closer to exact
  while for
  , we can see from Table 2 the
  of
of  are closer to the
  of
of  than discriminant function
  .
.Table 2. Estimated
 of sample LDF of sample LDF
 |
| |
|
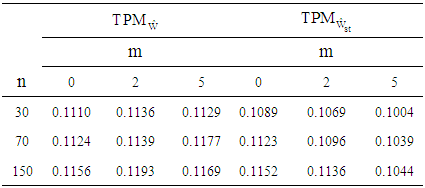
In Figure 1, we display the histogram of discriminant functions by performing 200,000 iterations of the Equations (5) and (8). As can be seen in figure, the histograms of discriminat function  are almost symmetrical for all values but they aren't seem normally distributed. Nonetheless, the histogram of discriminat function
  is symmetrical for
  . In other words, when strata of the groups are significantly diversity in means then the limited distribution of
  is symmetric and unimodal.
 | Figure 1. Histogram of the discriminant functions  |
5. Discussions
In many studies, particularly in the field of human sciences such as psychology, education, financial management and medical researches the sampling method is stratified. A common error in this type of research is the inadvertence of sampling designs and using analytical methods in statistical software in which the sampling method assumes that the simple random. In this study, in case of stratified sampling, we present a linear discriminant function by replacing the usual unbiased sample estimators with unbiased weighted estimators. In simulations, we demonstrate discriminant function  has better performance in comparison
  when the groups consist of strata with distinct means. This discriminant function can be used to obtain error rate between groups that are categorized by an auxiliary variable such as gender, job, etc. An expansion of distribution
  remains as open problem which it can study in future research.
ACKNOWLEDGEMENTS
This article is resulted from a research project which financed by Islamic Azad University Abadan branch.
References
| [1] | Anderson, T. W. (1973). An asymptotic expansion of the distribution of the studentized classification statistics W. The Annals of statistics, 1, 964-972. |
| [2] | Atakan, C. (2009). Bootstrap percentile confidence intervals for actual error rate in linear discriminant analysis. Hacettepe Journal Mathematics and Statistics, 38, 357- 372. |
| [3] | DuMuchel, W. H. & Duncan, G. J. (1983). Using Sample Survey Weights in Multiple Regression Analysis of Stratified Samples. Journal of the American Statistical Association, 78, 535-543. |
| [4] | Fisher, R. A. (1936). The use of multiple measurements in taxonomic problems. Annals of Eugenics, 7, 179-188. |
| [5] | Hedges, L. V. & Rhoads, C. H. (2011). Correcting an analysis of variances for clustering. British Journal of Mathematical and Statistical psychology, 64, 20-37. |
| [6] | Horton, N. J. & Fitzmaurice, G. M. (2004). Regression analysis of multiple source and multiple informant data from complex survey samples. Statistics in Medicine, 23, 2911-2933. |
| [7] | Johnson, R. A., Wichern, D. W. (1992). Applied Multivariate Statistical Analysis. New Jersey: Pearson Prentice Hall. |
| [8] | Kao, T. C. & McCabe, G. P. (1991). Optimal Sample Allocation for Normal Discrimination and Logistic Regression under Stratified Sampling. Journal of the American Statistical Association, 86, 432-436. |
| [9] | Leu, C. H. & Tsui, K. W. (1997). Discriminant analysis of survey data. Jornal of Statistical Planning and Inference, 60, 273-290. |
| [10] | Mardia, K. V., Kent, J. T., & Bibby, J. (1979). Multivariate Analysis. London: Academic Press. |
| [11] | Shahrokh Esfahani, M., & Dougherty, E., R. (2014). Effect of separate sampling on classification accuracy. Bioinformatics, 30(2), 242-250. |
| [12] | Tsui, K. W. & Leu, C. H. (1998). The Effect of Sampling Design on Anderson's Expansion of the Distribution of Fisher's Sample Discriminant Function. Statistica Sinica, 8, 1115-1130. |
 Abstract
 Reference
 Full-Text PDF
 Full-text HTML