N. Uthayakumaran , S. Venkatasubramanian
National Institute of Epidemiology, Indian Council of Medical Research, Chennai, Tamilnadu, India
Correspondence to: N. Uthayakumaran , National Institute of Epidemiology, Indian Council of Medical Research, Chennai, Tamilnadu, India.
| Email: |  |
Copyright © 2015 Scientific & Academic Publishing. All Rights Reserved.
Abstract
The standard simple random sampling procedure becomes tedious when the study population is large. Researchers often opt for multi stage/phase sampling for estimation. Multi stage sampling cuts/omits portions of the populations in stages, as a result production of unbiased estimates to population parameter become questionable. The authors advocate - “UV Cubical Circular Systematic Sampling Approach” in this paper. This is an attempt to produce reliable estimate for the study variable in a large population by considering the whole population while identifying the sample in a single attempt cyclically by ensuring an equal probability sample. The sample mean under this scheme coincides with the population mean in the presence of linear trend. Hypothetical data through a linear model and real life data (census of Tamilnadu – 2001) are used to illustrate the proposed new sampling methods. The proportion of illiteracy in Tamilnadu as per census 2001 is 0.35. The census data is utilized to generate sample by the newly developed WPS UV cubical circular systematic sampling procedure. The estimated proportion of illiteracy in Tamilnadu is 0.33, the 95% CI being 0.28 - 0.37.
Keywords:
Cubical Circular Systematic Sampling, Equal Probability Sample, Linear Trend
Cite this paper: N. Uthayakumaran , S. Venkatasubramanian , An Alternate approach to Multi-Stage Sampling: UV Cubical Circular Systematic Sampling Method, International Journal of Statistics and Applications, Vol. 5 No. 5, 2015, pp. 169-180. doi: 10.5923/j.statistics.20150505.01.
1. Introduction
The technique of selecting a sample is of fundamental importance in sampling theory. Development of sampling designs that improve estimation would play a vital role in providing more reliable estimates. A multi-stage sample is one in which sampling is done sequentially across two or more hierarchical levels, such as first at the county level, second at the census track level, third at the block level, fourth at the household level, and ultimately at the within-household level. Cochran (1939), Hansen and Hurvitz (1943) and in India Mahalanobis (1940), Sukhatme (1953), Lahiri (1954)- crop survey have found multi-stage sampling to be very useful for estimation. Many probability sampling methods can be classified as single-stage sampling against multi-stage sampling. Single-stage samples include simple random sampling, systematic random sampling, and stratified random sampling. In single-stage samples, the elements in the target population are assembled into a sampling frame; one of these techniques is used to directly select a sample of elements. In contrast, in multi-stage sampling, the sample is selected in stages, often taking into account the hierarchical (nested) structure of the population. Multi-stage sampling represents a more complicated form of cluster sampling in which larger clusters are further subdivided into smaller ones- more targeted groupings, for the purposes of surveying. In traditional cluster sampling, a total population of interest is first divided into ‘clusters’ (for example, a total population into geographic regions, household income levels, etc), and from each cluster individual subjects are selected by random sampling. This approach however, may be considered overly-expensive or time consuming for the investigator. Multi-stage sampling begins first with the construction of the clusters. Next, the investigator identifies the sample from within the clusters for the survey.But there is the possibility of bias in multi stage sampling, if, for example, only if a small number of regions are selected. The method is not truly random as the sample is identified in several stages omitting parts of the population in each stage. The omitted portion of the population can never become part of the sample. Also it should be noted that, if the population is heterogeneous, the areas chosen should reflect the full range of the diversity. Otherwise, choosing some areas and excluding others (even if it is done randomly) will result in a biased sample. It may be noted that the technique of dual circular systematic sampling method (N. Uthayakumaran and S. Venkatasubramanian, 2013) based on the procedure of circular systematic sampling (Lahiri, 1951) has greater flexibility for population arranged in two dimensions according to the associated variables i.e considering the associated variables to the study variable while constructing the sample is an attempt to overcome this problem. As an extension of the above sampling methods, the proposed UV cubical circular systematic sampling methodology and weight proportional to size is viewing the population in three dimensions. The proposed method while removing the disadvantage of multi stage sampling i.e., omitting parts of the population in each stage of sample selection, by selecting the sample in a single attempt from the whole population also provide reliable estimate of the study variable . Estimation will be improved by the adoption of the above methodology as care is being taken to spread the population units in the sample in broad manner and they very closely represent in real life situation. The corrected estimator of UV cubical circular systematic sampling method in the context of three dimensions which may coincide with the population mean of the study variable in the presence of a linear trend has also been described.
2. UV Cubical Circular Systamatic Sampling Method
A three dimensional population element may be represented by study variable Yijm, i,j,m = 1,2,…,N where Yijm is the value of the ith altitude, jth row and mth column. The population contains N3 units. The sample contains n3 units. The sampling interval k is the integer part of the ratio N/n.A UV cubical circular systematic sample is selected by drawing three independent starting coordinates r,c,t at random, each between 1 and N. A sample of size n3 contains all units whose coordinates are of the form 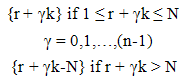 | (2.1) |
 | (2.2) |
 | (2.3) |
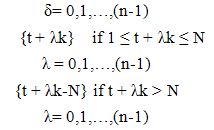
This technique ensures equal probability of inclusion in the sample for every unit. Let x1,x2,…,xn and z1,z2,…,zn and l1,l2,…,ln be integers corresponding to altitude, row and column labels of the sampled units respectively when they are arranged in an original serial order of the population as in cubical form: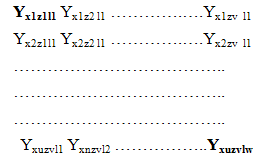 | (2.4) |
In the above expression of Yijm, i = xu, j =zv, m=lw where u,v,w = 1,2,…..,n.Estimation of population mean of study variableFor the sampling method described above, one can estimate population mean of study variable using sample mean of study variable: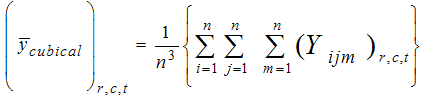 | (2.5) |
The variance of the above estimator can be established by considering 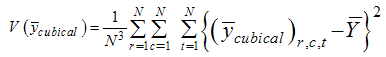 | (2.6) |
where population mean of study variable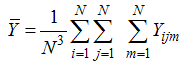 | (2.7) |
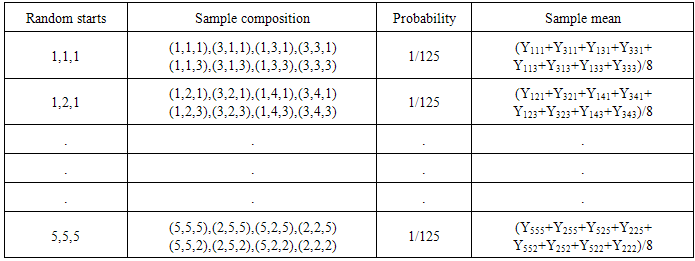
The methodology of cubical circular systematic sampling is illustrated below.Sampling of eight units:To estimate population mean of study variable, if one identifies the areas like group of districts (I), group of taluks (J) and group of villages (M) according to its increasing order of geographical size, it is possible to arrive at better estimate under the assumption that study variable exhibits linear trend.In this illustration, altitude dimensions are 5 groups of districts, row dimensions are 5 groups of taluks and column dimensions are 5 groups of villages. The technique of UV cubical circular systematic sampling can be illustrated by applying it to the case of sampling n3= 8 units from the population arranged in three-dimension of N3 = 125 units.Step 1:A random number is drawn from 1 to 5 of I (say 3). Sampling interval k=N/n=5/2=2, using (2.1), the following ith label of sampling units are selected.{3, 5} Step 2:A random number is drawn from 1 to 5 of J (say 5). Sampling interval k=N/n=5/2=2, using (2.2), the jth label of sampling units are selected.{5, 2}Step 3:A random number is drawn from 1 to 5 of M (say 4). Sampling interval k=N/n=5/2=2, using (2.3), the mth label of sampling units are selected.{4, 1}Step 4:The following sample units of three-dimensional population are selected using the labels selected from the step1, step2 and step 3.(3,5,4) (3,2,4) (3,5,1) (3,2,1) (5,5,1) (5,2,1) (5,5,4) (5,2,4) Illustration:This sampling method is discussed theoretically with study variable exhibiting linear trend through the model Yijm = i+j+m, i,j,m=1,2,…,5.
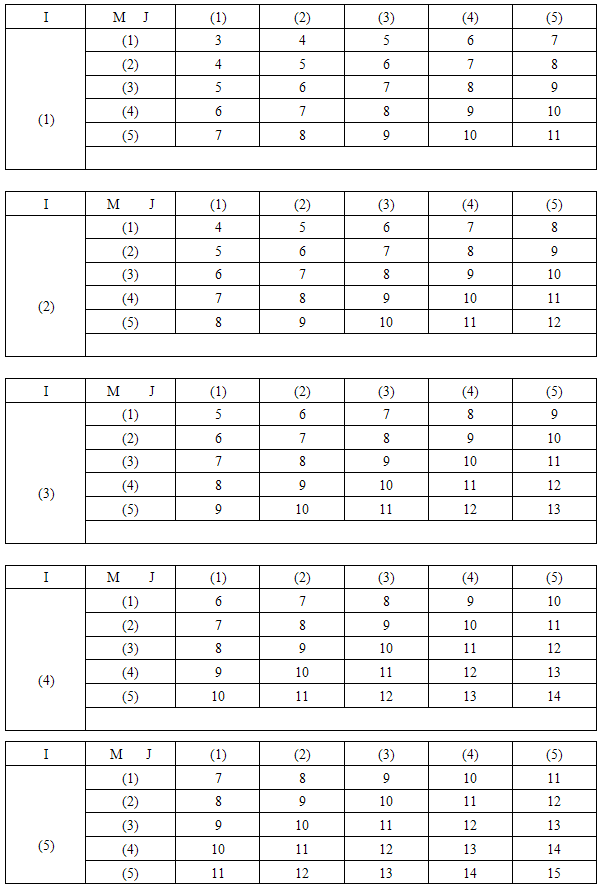 In the above illustration, if we assume, sample survey is carried out to find out the estimate sample mean in the randomly selected 2 x 2 x 2 sampling units, it can be noted that Yijm deducted from the selected cells are 12, 9, 9, 6, 11, 8, 14 and 11. Using (2.5), the estimated sample mean is 80/8=10, which is close to the population mean of 3(N+1) /2= 9.The possible 125 samples together with the sample means of UV cubical circular systematic sampling method is shown in Table-1.
Table 1. Sample mean under UV cubical circular systematic sampling method
 |
| |
|
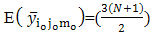
The expected value of sample mean of the UV cubical circular systematic method is just the simple average of column (4) in Table-1, which turns out to be population mean of study variable.In practice, there is a chance to come across three-dimensional different array populations and hence an attempt is required to extend the UV cubical circular systematic method with necessary trimmings. Here N3=N1 x N2 x N3; n3 =n1 x n2 x n3. Theorem-1: The sample mean under UV cubical circular systematic sampling scheme coincides with the population mean in the presence of linear trend.The sample mean  , where io =1,2,……,k ; jo =1,2,……, k ; mo =1,2,……,k corresponding to the random start io, jo, mo under the UV cubic circular systematic sampling coincides with the population mean
  in the presence of linear trend
  = i+j+m.
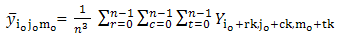 We note that the total number of possible cubic sample of size n3 is k3.
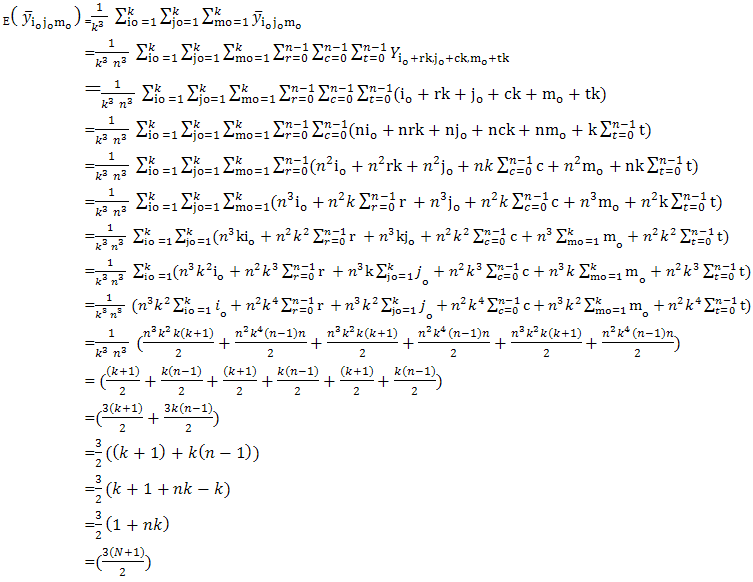
 , which is nothing but population mean under the linear model
  =i+j+m.It is shown in the following proof.
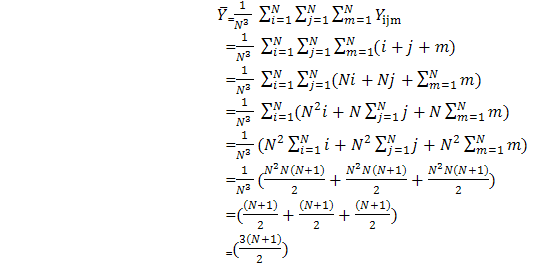
3. Corrected Estimator
It is well known that linear systematic sampling scheme performs better than simple random sampling in the presence of linear trend. Yates (1948) suggested a modification over the usual expansion estimator in order to estimate the population mean of study variable in the presence of linear trend without any error. Proceeding along these lines, Bellhouse and Rao (1975) suggested a corrected estimator meant for circular systematic sampling to estimate the population mean of study variable in the presence of linear trend without any error. Encouraged by the above work, Uthayakumaran (1998) suggested a new estimating procedure that is quite general in nature and applicable under various systematic sampling methods for population viewed in single dimension. Uthayakumaran and Venkatasubramanian (2013) extended this procedure for population arranged in two dimensions according to the associated variables. In order to extend this technique for the population arranged in three dimensions, the following procedure is introduced.The values of the longest diagonal elements in (2.4) are given unique weight R. The weight R is selected in such a way that the corrected sample mean of study variable coincides with the population mean of study variable under the linear model Yijm = i+j+m, i,j,m = 1,2,…,N. This can be achieved by equating the corrected sample mean of study variable to the population mean of study variable.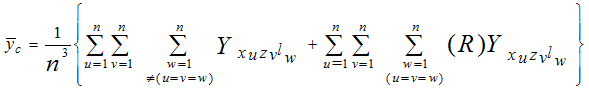 | (3.1) |
where Yijm = i+j+m, i = xu, j =zv, m=lw, where u, v, w = 1,2,…..,n coincides with the population mean of study variable.That is, unique weight R can be chosen in such a way that  ,where
 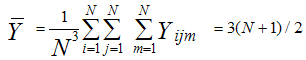 | (3.2) |
By solving equations (3.1) and (3.2), we get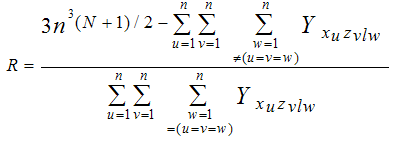 | (3.3) |
In may be noted that the unique weight R = 3/5 in the above mentioned illustration when the corrected estimator  = 3(N+1)/2= 9 coincides with the population mean of the study variable.
4. Weights Proportional to Size (WPS) UV Cubical Circular Systamatic Sampling Method
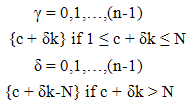
The method of selecting samples according to size has some definite probability and is often advocated. The entire area containing the population under study is divided into a finite number of distinct and identifiable units (sampling units). A group of such units is called as cluster. After dividing the population into specified clusters the required number of clusters can be selected either by equal or unequal probabilities of selection. All the elements in selected clusters are enumerated. Researchers are always in pursuit of developing estimators with increased precision by incorporating the information of suitable auxiliary (size) variables either in the sampling design or in the estimator. For two-dimensional population, a method of sampling, which uses size information, is weight proportional to size dual circular systematic sampling (Uthayakumaran and Venkatasubramanian, 2013) for estimating finite population total. In this section, an attempt has been made towards incorporating size information in the estimator for three-dimensional population. A three dimensional population element may be represented by study variable Yijm, i,j,m = 1,2,…,N where Yijm represents the cell study variable of the ith altitude and jth row and mth column. Let Xijm , i,j = 1,2,…,N be the size variable. Altitude total Ai, Row total Rj, and column total Cm, i,j,m = 1,2,…,N are defined on the Altitude, row and column units respectively for Xijm. TN denotes the size of the population. A WPS UV cubical circular systematic sample can be drawn as follows:In sampling n3 units with this procedure, the Cumulative totals Ti= A1 + A2 + … + Ai, Tj= R1 + R2 + … + Rj and Tm = C1 + C2 + … + Cm, i,j,m = 1,2,…,N, are determined. The population contains N3 units. The sampling interval k is the integer part of the ratio TN/n.A WPS UV cubical circular systematic sample is selected by drawing three independent starting coordinates r,c,t at random, each between 1 and TN. A sample of size n3 contains all units whose coordinates are of the form 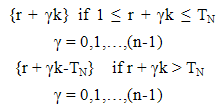 | (4.1) |
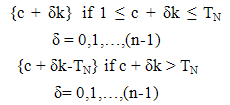 | (4.2) |
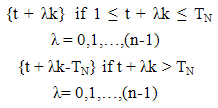 | (4.3) |
For the values obtained from the above form of coordinates are taken as sampled units using the cumulative total of altitude (Ti , i=1,2,..N) row (Tj , j=1,2,..N) and column (Tm, m=1,2,…N). Let A1,A2,…,AN and R1,R2,…,RN and C1,C2,…,CN be integers corresponding to altitude and row and column totals of the population units respectively when they are arranged in an linear order of the population.Estimation of population total of study variableSurvey analysts normally need to prevail over the problem of estimating population total for the study variable with size information. For the sampling method described above, an estimator of the population total of the study variable (Y) is given by 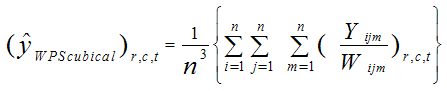 | (4.4) |
where Wijm =AiRjCm/(TN)3The approximate expression of variance of the above estimator can be found by considering (Hartley and Rao, 1962)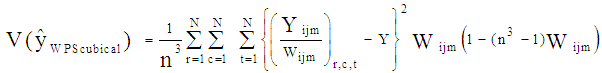 | (4.5) |
where population total of the study variable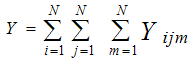 | (4.6) |
Illustration using hypothetical data exhibiting linear model:It is significant to note that complete sampling frame is not required for this sampling scheme. The linear arrangement of the variables of the population in three dimensions by size indirectly ensures the linear trend assumption for the study variable. By this arrangement the proposed sampling scheme ensures closeness of the estimate of the study variable to the population. The random starts for three dimensions and fixing the cells with the use of size information establish the sample. Let populations at districts, taluks and villages be considered as known details. If one deals with the population at districts and appropriate and easily available variables such as population at taluks and villages which are linearly arranged, it is possible to arrive at very closer estimate of the study variable of the population. In this illustration, altitude dimensions are 5 groups of districts and row dimensions are 5 groups of taluks and column dimensions are 5 groups of villages according to its range of population. Labels of group of districts (I), labels of group of taluks (J) labels of group of villages (M) are given from 1 to 5 according to its ascending order of populations Ai, Rj and Cm respectively. The study variable and size variable can be generated under the following linear modelsYijm = i+j+m, where i,j,m=1,2,… ,5Xijm = β (i+j+m), where β =100 and i,j,m=1,2,… ,5 Yijm and Xijm can be the respective prevalence cases and population. Let Ai, Ri and Cj be the total populations of 5 group of districts, 5 group of taluks and total populations of grouped villages respectively. Let Ti,Tj and Tm be the cumulative totals of population of districts (Ai), population of taluks (Rj), and population of grouped villages (Cm) respectively. Let Y be the total prevalence cases. Let TN be the total population. Towards this, the technique of WPS UV cubical circular systematic sampling can be illustrated by applying it to the case of sampling 27 units from the three-dimensional population of 125 units for the hypothetical data generated using the model described above. Distribution of Study and Size variables for the hypothetical data according to districts, taluks and villages.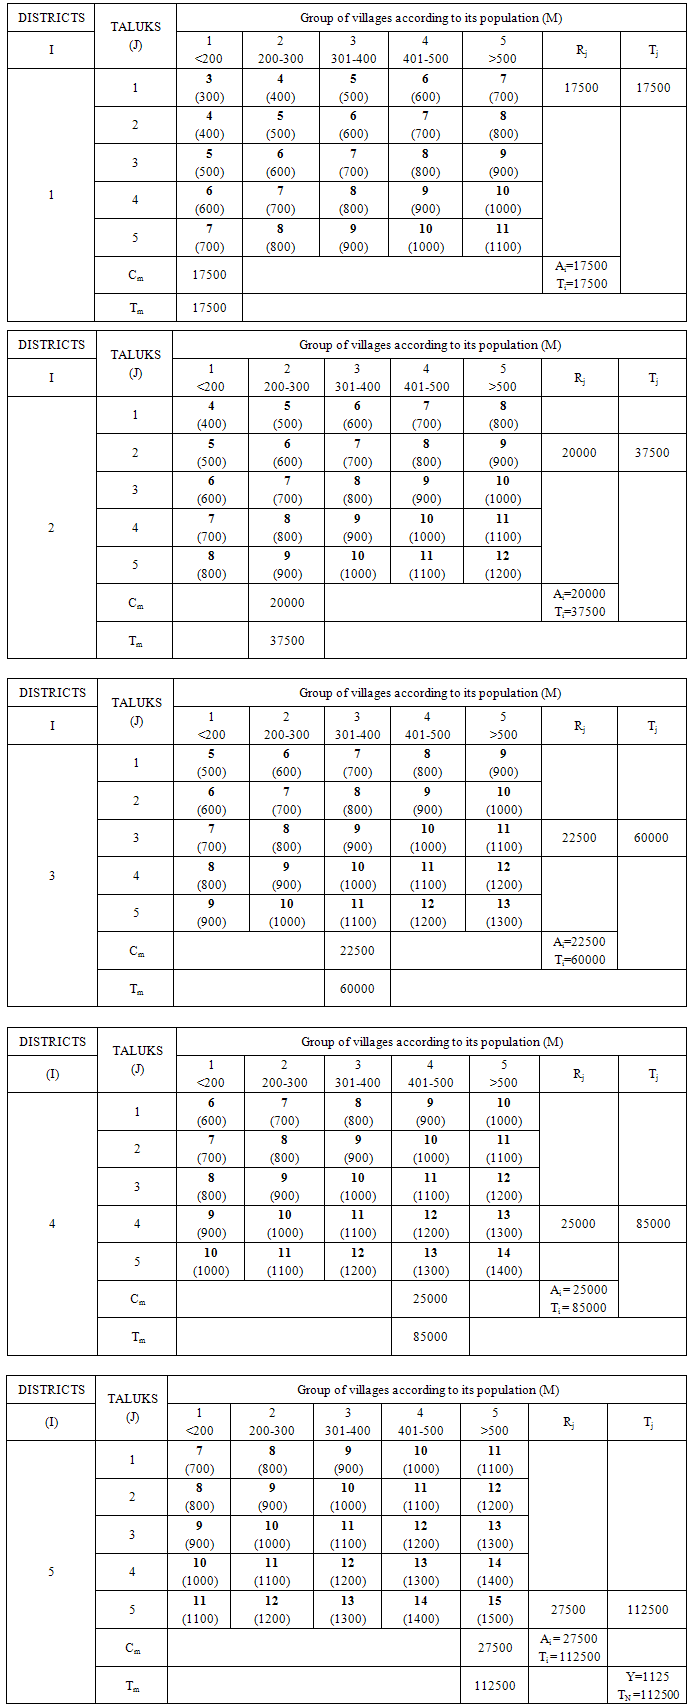 • Numbers in bold are prevalence cases Yijm - study variable• Numbers in parenthesis are cell population Xijm - size variable Step 1:A random number is drawn from 1 to 112500 of I (say 7000). Sampling interval k=TN/n=37500, using (4.1), the following coordinates are identified. {7000, 44500, 82000} For the values obtained above, corresponding ith labels are taken as sampled units using the cumulative total of altitude.{1,3,4}Step 2:A random number is drawn from 1 to 112500 of J (say 30000). Sampling interval k=37500, using (4.2), the jth label of sampling units are selected.{30000, 67500, 105000}For the values obtained above, corresponding jth labels are taken as sampled units using the cumulative total of row.{2,4,5}Step 3:A random number is drawn from 1 to 112500 of M (say 50000). Sampling interval k=37500, using (4.3), the mth label of sampling units are selected.{50000, 87500, 12500}For the values obtained above, corresponding mth labels are taken as sampled units using the cumulative total of column.{3,5,1}Step 4:The following sample units of three-dimensional population are selected using the labels selected from the step1, step2 and step 3.(1,2,3) (1,2,5) (1,2,1) (1,4,3) (1,4,5) (1,4,1) (1,5,3) (1,5,5) (1,5,1) (3,2,3) (3,2,5) (3,2,1) (3,4,3) (3,4,5) (3,4,1) (3,5,3) (3,5,5) (3,5,1)(4,2,3) (4,2,5) (4,2,1) (4,4,3) (4,4,5) (4,4,1) (4,5,3) (4,5,5) (4,5,1)In the above illustration, if one assumes that the sample survey is carried out in the randomly selected 3 group of districts, 3 group of taluks and 3 group of villages (3x3x3=27 cells) to find out the estimate of study variable , it can be noted that value of the study variable deducted from the selected cells are 6, 8, 4, 8, 10, 6, 9, 11, 7, 8, 10 ,6, 10, 12, 8, 11, 13, 9, 9, 11, 7, 11, 13, 9, 12, 14 and 10. Using (4.4), the estimated total for the study variable is 1128 (Estimated proportion = 0.0100), while population total of the study variable is 1125 (Actual proportion = 0.0100). Real life situation using a 2001 census data:The methodology of WPS UV cubical circular systematic sampling is discussed using a dataset from the 2001 census data. Census - 2001 conducted in Tamilnadu State, had 30 districts, 202 taluks, 29683 villages/wards and 62405679 population. According to this census, the number of illiterates was 21881134 (35%). The distribution of population according to districts, taluks and villages/wards, is made into 10x10x10 groups merging approximately uniform neighborhood units. These groups are then arranged by increasing size. It is possible to arrive at reliable estimate of study variable (proportion of illiterates) of the population using the proposed UV cubical circular systematic sampling, under the assumption that the increasing arrangement of the size variable (population) in three dimensions according to size may furnish the closer estimate of the variable of interest.The only needed information is, total populations at each ten groups of districts (Ai, i=1,2,..,10), taluks (Ri, j=1,2,..,10 ) and villages/wards (Cm, m=1,2,..10) for the selection of sample. Here study variable Yijm, i,j,m = 1,2,..,10 are the distribution of illiterates and size variable Xijm, i,j,m = 1,2,..,10 are distribution of the population in 2001 census. Let Ti, Tj and Tm are cumulative totals of population of each ten groups of districts, taluks and villages/wards respectively. Let Y be the total illiterates. Let TN be the total population. The technique of WPS UV cubical circular systematic sampling can be discussed by applying it to the case of sampling 8 units from the above mentioned three-dimensional population of 1000 units as, usually in multi-stage surveys, it is in practice to cover less than 1% of the population in the sample due to various logistic reasons.Tamilnadu population: TN = 62405679Population arranged in three dimensions i.e., group of districts, taluks, villages/wards: N N x N= 1000 cells (N=10)Sample selected from three dimensional arrangement of population: n n x n= 8 (n=2) Sampling Interval: k =TN/n= 31202839Step 1:A random number is drawn from 1 to 62405679 of I (say 10000000). Sampling interval k=31202839, using (4.1), the following coordinates are identified. {10000000, 41202839} For the values obtained above, corresponding ith labels are taken as sampled units using the cumulative total of altitude.{3,8}Step 2:A random number is drawn from 1 to 62405679 of J (say 30000000). Sampling interval k=31202839, using (4.2), the jth label of sampling units are selected.{30000000, 61202839}For the values obtained above, corresponding jth labels are taken as sampled units using the cumulative total of row.{6,10}Step 3:A random number is drawn from 1 to 62405679 of M (say 50000000). Sampling interval k=31202839, using (4.3), the mth label of sampling units are selected.{50000000, 18797160}For the values obtained above, corresponding mth labels are taken as sampled units using the cumulative total of column.{9,4}Step 4:The following sample units of three-dimensional population are selected using the labels selected from the step1 and step 2.(3,6,4) (3,6,9) (3,10,4) (3,10,9) (8,6,4) (8,6,9) (8,10,4) (8,10,9)
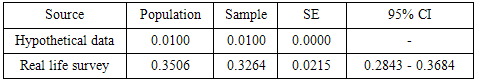
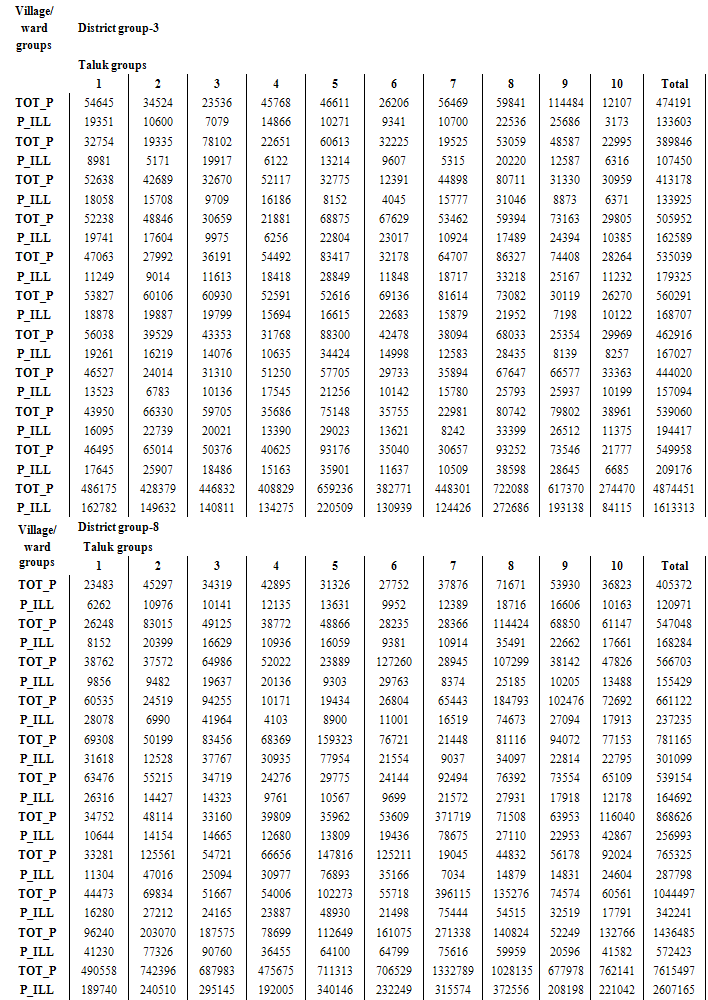 In the above illustrated real life situation, if we assume, special purpose sample survey is carried out to find out the estimate of illiteracy in the randomly selected each two groups of districts, taluks and villages/wards (2x2x2=8 cells), it can be noted that the illiteracy deducted from the selected cells are 23017, 13621, 10385, 11375, 11001, 21498, 17913 and 17791 from 228 villages/wards [The approximate average village/ward population is 1700 or 425 households] size of under 2x2x2=8 cells. The estimated proportion of illiterates is 0.33(W.G Cochran, 1977), which is closer to the actual proportion of illiterates in TamilNadu i.e., 0.35.INTERVAL ESTIMATIONIn practice, interval estimation is very much useful to study and interpret the estimate to its logical conclusions. It is also a useful tool to derive simple and intuitive way to interpret the results of public health studies. In conjunction with the statistical power, the interval estimates help to interpret the study findings in a more realistic way. So, the 95% Confidence Interval (CI) for the estimate can easily be obtained by using the formula for the variance of estimation. Using the above concept, the 95% CI for estimate in the above situations is shown in the following table.
The 95% CI for the illiteracy in different situations
 |
| |
|
5. Discussion
Multi stage sampling method refers to the method which selects sample by stages, the sampling unit at each stage being sub-sampled from the larger units chosen at the previous stage. The sampling units pertaining to the first stage are termed as primary or first stage units; and similarly for second stage units, third stage units etc. Generally, three-stage sampling method is used for large scale surveys. The major disadvantage of multi-stage sampling is that it omits parts of the population in different stages. Because of this, multi-stage sampling poses difficulties in production of unbiased /representative estimates for the variable of interest. It is interesting to note that dual circular systematic sampling method (N. Uthayakumaran and S. Venkatasubramanian, 2013) is considering the whole population, which is arranged in two dimensions. Extending the technique of dual circular systematic sampling method, the proposed UV cubical circular systematic sampling methodology is an attempt to produce reliable estimate for the study variable by considering the whole population arranged in three dimensions. The sample is selected in a single attempt cyclically. The UV cubical circular systematic sampling scheme is explained through the linear model in section 2. In the case of corrected estimator in UV cubical circular systematic sampling method, the values of the diagonal elements in (2.4) are given a unique weight R to estimate the population mean of study variable in the presence of linear trend without any error. It is pertinent to note that the corrected sample mean (3.1) of UV cubical circular systematic sampling method coincides with the population mean in the presence of linear trend. In the weights proportional to size (WPS) UV cubical circular systematic sampling method, approach of using three-dimensional population procedures is advocated in this paper in section 4. This is an attempt to reduce the variance and enhance the quality of the estimate of the study variable. The weights based on size information (4.4) are providing strength to the estimate. The requirement and specific arrangement of the three dimensional population in the UV cubical circular systematic sampling method discussed in this paper , in effect ensure - the observance of the study variable on a much enhanced setup. The use of size variable in arranging the total population for the selection of the sample indirectly satisfy the linear trend assumption for the study variable. The random starts for altitude, row and column and fixing the cells with the use of size information uniquely determine the sample. Also, this approach is comparatively easy and provides a good representative sample, as care is being taken to spread the population units in the sample. Hypothetical data through a linear model and real life data (census of Tamilnadu – 2001) are used to illustrate the proposed new sampling methods. The proportion of illiteracy in Tamilnadu as per census 2001 is 0.35. The census data is utilized to generate sample by the newly developed WPS UV cubical circular systematic sampling procedure. The estimated proportion of illiteracy in Tamilnadu is 0.33, the 95% CI being 0.28 - 0.37.The hypothetical data generated through models and use of real life data towards explaining the UV cubical circular systematic sampling schemes demonstrate its ease and practical utility for estimation.
6. Conclusions
For population arranged as N x N x N cells (even if N3 ≠ n3k3), the suggested new methods are useful in selecting the samples. To estimate proportion of study variable in the population, if one identifies the area in the sample using the above described methods; it is possible to arrive at reliable/accurate estimate. Estimate will be accurate (for the census data used in the illustration the standard error is 2%) by the adoption of the above methodology as care is being taken to spread the sampling units into the population as much as possible. Extension to our proposed methodology, for example, arrangement of population in a manifold fashion may also be thought of for the production of large scale estimate to the variable of interest. The suggested corrected sample mean discussed in section 3 is equal to the population mean when the population is arranged as per the suggested methods in three-dimension population exhibiting linear trend. This methodology will be an alternate and beneficial to all the large scale, multi-stage surveys. Authorities/Government agencies require data on micro and macro level for better planning. Market research agencies and other organizations like, television networks, federation of industries, political organizations etc., often need to conduct studies to get reliable data on various parameters to decide about investment/production policies, popularity of TV serials, evaluation of programs etc. For example, in India, the National Family Health Survey (NFHS), National Sample Survey (NSS) and Sample Registration System (SRS) are multi-stage surveys. Three NFHS surveys have been conducted so far since 1992-93. The NFHS surveys provide estimates both at state and national level on fertility, infant and child mortality, the practice of family planning, maternal and child health, reproductive health, nutrition, anemia, utilization and quality of health and family planning services. We anticipate the use of UV cubical circular systematic sampling schemes in real life situations will demonstrate its ease and practical utility for estimation. More research with the multi-stage surveys using our proposed sampling methodology will enhance and provide reliable estimates in the estimation of parameters of variable of interest in the field of sampling.
References
| [1] | Bellhouse, D.R. and Rao, J.N.K., 1975: Systematic sampling in the presence of trend, Biometrika, 62, 694-697. |
| [2] | Cochran W.G, 1939: Use of analysis of variance in enumeration by sampling, JASA, Vol. 34, P492-510. |
| [3] | W.G Cochran, 1977: Sampling Techniques, Third Edition, Wiley Eastern, P227- |
| [4] | Hansen, M.H and W.N. Hurwitz (1943): On the theory of sampling from finite populations, Ann. Math. Statist., Vol 14, P3333-362. |
| [5] | Lahiri D.B., 1951: A method for selection providing unbiased estimates, Int. Stat. Ass. Bull, 33, 133-140. |
| [6] | Lahiri D.N., 1954: Technical paper on some aspects of the development of the sample design, Sankhya, Vol. 14, P332-362. |
| [7] | Leslie Kish, 1987: Statistical Design For Research, John Wiley & Sons., P33- |
| [8] | Madow, W.G. and L.H. Madow, 1944: On the theory of systematic sampling, Ann. Math. Stat., 15, 1-24. |
| [9] | Mahalanobis, P.C, 1940: Report on the sample census of jute in Bengal, Ind. Central Jute Committee. |
| [10] | Midzuno, H., 1952: On the sampling system with probabilities proportionate to sum of sizes, Annals of Institute of Statistical Mathematics, 2, 99-108. |
| [11] | Sukhatme, P.V, 1950: Efficiency of sub sampling designs in yield surveys, J. Ind. Soc. Agr. Statist., Vol. 2, P212-228. |
| [12] | Sunter, A., 1986: Solutions to the problem of unequal probability sampling without replacement, In. Stat. Rev., 54, 33-50. |
| [13] | N. Uthayakumaran, 1998: Additional circular systematic sampling Methods, Biometrical Journal, 40, 4, 467-474. |
| [14] | N. Uthayakumaran, and S. Venkatasubramanian, 2013: Dual circular systematic sampling methods for disease burden estimation, International journal of statistics and analysis, Vol. 3, No. 3, Page No. 307-322. |
| [15] | Yates, F., 1948: Systematic sampling, Transactions Royal Society, London, A 241, 345-377. |
| [16] | Hartley H.O. and Rao J.N.K (1962): Sampling with unequal probability without replacement, Ann. Math. Stat., 33, 350-374. |
 Abstract
 Reference
 Full-Text PDF
 Full-text HTML