Kudakwashe Mutangi
Department of Mathematics, Harare Institute of Technology, Belvedere, Harare, Zimbabwe
Correspondence to: Kudakwashe Mutangi, Department of Mathematics, Harare Institute of Technology, Belvedere, Harare, Zimbabwe.
| Email: |  |
Copyright © 2015 Scientific & Academic Publishing. All Rights Reserved.
Abstract
In this paper, focus is on finding a suitable model for the annual Zimbabwe Traffic Accident statistics from 1997 to 2013 and to forecast the number of annual traffic accidents likely to occur in future. The Box-Jenkins model building strategy is used. The Augmented Dickey Fuller test showed that the accident data was non-stationary. After first order differencing, the data became stationary. Three ARIMA models were suggested based on the ACF and PACF plots of the differenced series, these were ARIMA(0,1,0), ARIMA(1,1,0) and ARIMA(1,1,1). The model with the smallest corrected Akaike Information Criteria (AICc) and Bayesian Information Criteria (BIC) was chosen as the best model. The Ljung-Box statistics among others were used in assessing the quality of the model. ARIMA (0,1,0) was the best model for the Zimbabwe annual Traffic Accident data. Forecasting retained the value at the forecast origin. The implications of these findings are that based on the annual road traffic accident data for the period under consideration, it is difficult to make reasonable forecasts of the number of road traffic accidents for the years ahead of 2013. This is due to the fact that the values at different times of a white noise process are statistically independent.
Keywords:
Zimbabwe, Traffic accidents, Stationarity, ARIMA, Forecast, White noise
Cite this paper: Kudakwashe Mutangi, Time Series Analysis of Road Traffic Accidents in Zimbabwe, International Journal of Statistics and Applications, Vol. 5 No. 4, 2015, pp. 141-149. doi: 10.5923/j.statistics.20150504.02.
1. Introduction
The state of roads in Zimbabwe is appalling. The Zimbabwe National Roads Authority (ZINARA) is failing to cope with the much needed rehabilitation and repairs of roads. The problem has been compounded by harsh economic conditions prevailing in the country. Potholes are littered around all major roads causing accidents to motorists and pedestrians alike. The total number of accidents in Zimbabwe went up by 61.2% from 2009 (17,388) to 2010 (28,037) and the number of deaths increased in the same period by 7.3% and by 12.8% from 2010 to 2011. [1] About 50 million people and 1.2 million people in the world are killed annually due to road traffic accidents (RTA). [2]The Zimbabwe vehicle population (VP) has been increasing annually from 2009 to date due to the dollarization of the economy which made it easy for individuals to acquire second hand vehicles mainly from Japan. Such an increase in VP was not followed by road expansion resulting in congestion in urban areas and minor accidents. Fatal accidents have mainly been confined to the highways. Road accidents have been increasing in developing countries and Africa in particular. [3], [4], [5] Significant progress towards prevention and control of RTA has been limited to high income and/or highly industrialised countries ([6], [7]) in [8].There are many causes of road traffic accidents, among them human error, vehicle conditions, road environment, over-speeding, road users and many more [9]. [10] in [5] suggest use of alcohol as one of the causes of accidents while [11] gives too much travelling in summer as a major cause of accidents. Zimbabwe has tightened laws governing the driving of public motor vehicles (PMV) by putting the minimum age of a PMV driver at 25 years with a minimum of 5 years driving experience and introducing re-tests every 5 years among other measures. Enforcement of such measures on the PMV drivers has been compromised by both corruption in the police force and low un-prohibitive fines of up to a maximum of twenty American dollars per count.The Box-Jenkins model building strategy (1976) has been used to analyse accident data by several authors [4], [12], and [13] and found to be effective. Road traffic accident data in Zimbabwe was analysed using generalised linear models [14]. The Box- Jenkins model will be used in this paper.
2. Methodology
2.1. Source of Data
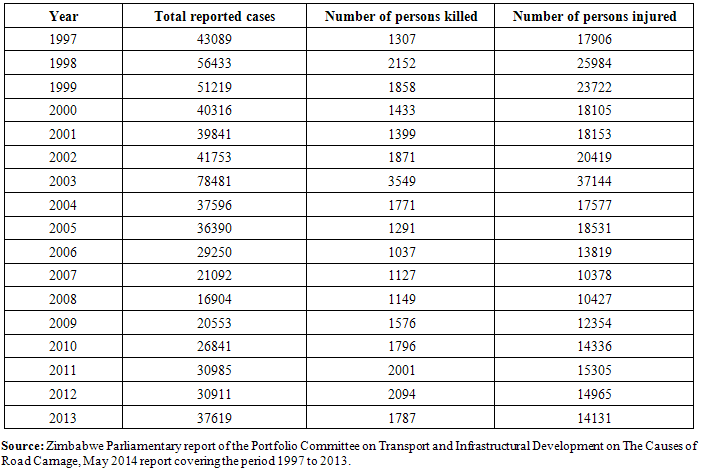
The data was obtained from Zimbabwe Parliamentary report of the Portfolio Committee on Transport and Infrastructural Development on The Causes of Road Carnage, May 2014 report covering the period 1997 to 2013. The data is based on reported traffic accidents. R software was used in the analysis.
2.2. The Box-Jenkins Model
The Box-Jenkins time series model was employed. Unit root tests were used to test for stationarity of the data and the non-stationary series ( ) was differenced d times to obtain a stationary series.
  is thus an ARIMA (p, d, q) model that conforms to the relationship:
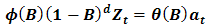 | (1) |
Where: | (2) |
 | (3) |
B is the backshift operator, p is the number of autoregressive parameters in the model while q represents the number of moving average parameters in the same model, and d is the differencing parameter signifying how many times the series has been differenced in order to achieve stationarity. Details of ARIMA (p,d,q) models can be found in [15] (pp 40-43).The autocorrelation function (ACF) and partial autocorrelation function (PACF) were used to determine the tentative time series models (model formulation). R software was used to estimate the parameters. The tentative model(s) were then subjected to rigorous diagnostic checks using residuals: ACF and PACF plots of residuals. The Akaike Information Criteria (AIC) and Bayesian Information Criteria (BIC) were used to select the best model. The final model was then used to make forecasts for 2014, 2015, 2016, 2017 and 2018.
3. Results and Discussion
3.1. Data Analysis and Tests for Stationarity: Total Reported Accidents
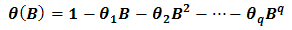
The Augmented Dickey Fuller test for stationarity was used to test for stationarity. [16], [17]The TS-plot of reported annual traffic accidents (ATA) (figure 1) is clearly non stationary. The augmented Dickey Fuller test on the data showed a p-value of 0.4075 suggesting further that the ATA data is non stationary. The mean is not constant and seems to be decreasing with time. After differencing once, the data became stationary with p=0.01 in the ADF test. [11], [12], [4], [13]. The ACF and PACF plots of the differenced series were obtained and appear in the following graphs (figure 2 and figure 3).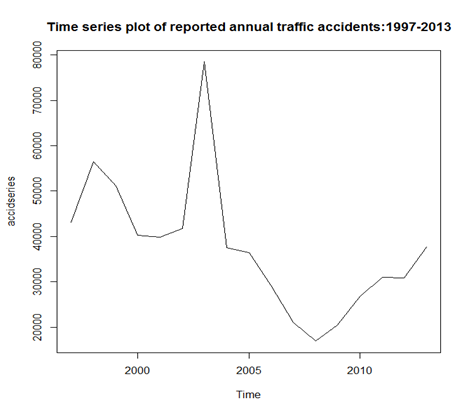 | Figure 1. Time series plot of reported annual traffic accidents |
 | Figure 2. ACF plot of reported annual traffic accidents |
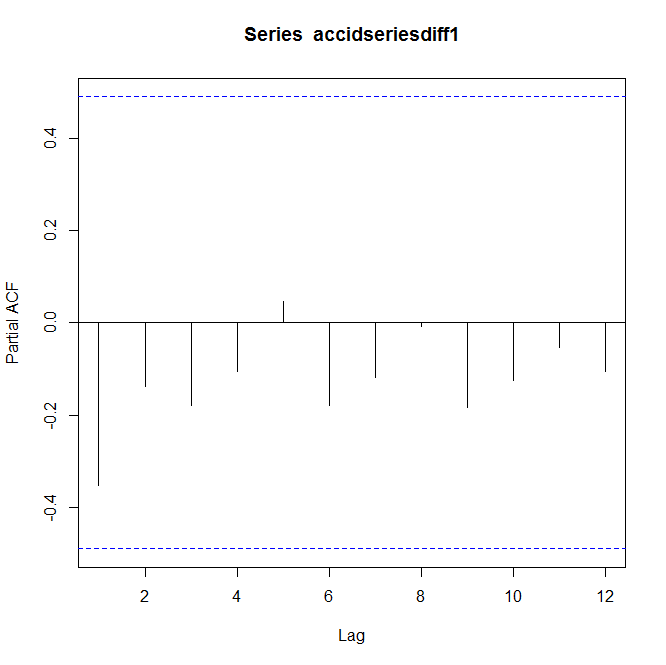 | Figure 3. PACF plot of reported annual traffic accidents |
3.2. Model Selection and Diagnostics
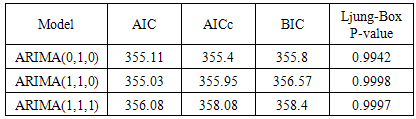
The ACF and PACF plots show no significant spike at any given lag suggesting that the differenced series could be a white noise process. Three different models were tried and these are ARIMA(0,1,0), ARIMA(1,1,0) and ARIMA(1,1,1). Table 1 below shows the results of the analysis for the three models.Table 1. Information criteria and Ljung-box p-values for the three models
 |
| |
|
Based on the corrected Akaike Information criteria (AICc) and the Bayesian Information criteria (BIC), an ARIMA(0,1,0) has the lowest AICc=355.4 and BIC=355.8 and was thus chosen as the tentative model for the ATA data [11], [12]. The Ljung Box test for the residuals of ARIMA(0,1,0) shows no evidence of non-zero correlations in the residuals with p=0.9942. An ADF test with p=0.02253 suggests that the residuals are stationary. The ARIMA(0,1,0) model was thus confirmed as the final model for the data. An auto. arima() function in R also yielded an ARIMA(0,1,0) model for the ATA data.An ACF plot (figure 4) of the residuals for an ARIMA(0,1,0) showing no significant spike.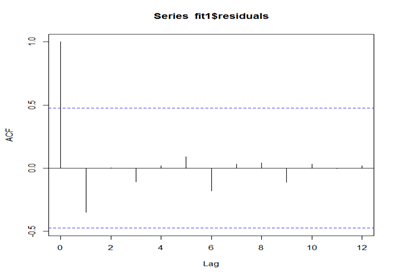 | Figure 4. ACF plot of residuals for ARIMA(0,1,0) model |
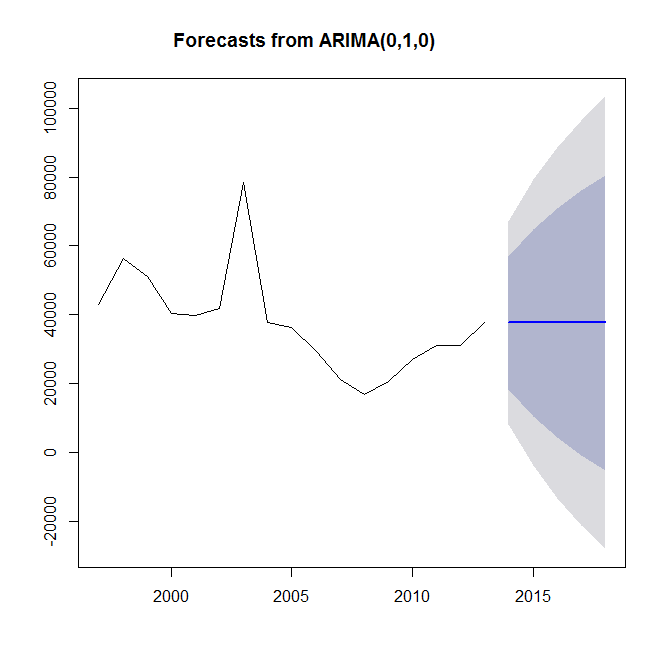 | Figure 5. The 80 % (dark shaded band region) and 95% (light shaded band region) confidence bands for the forecast of Zimbabwe Traffic accidents |
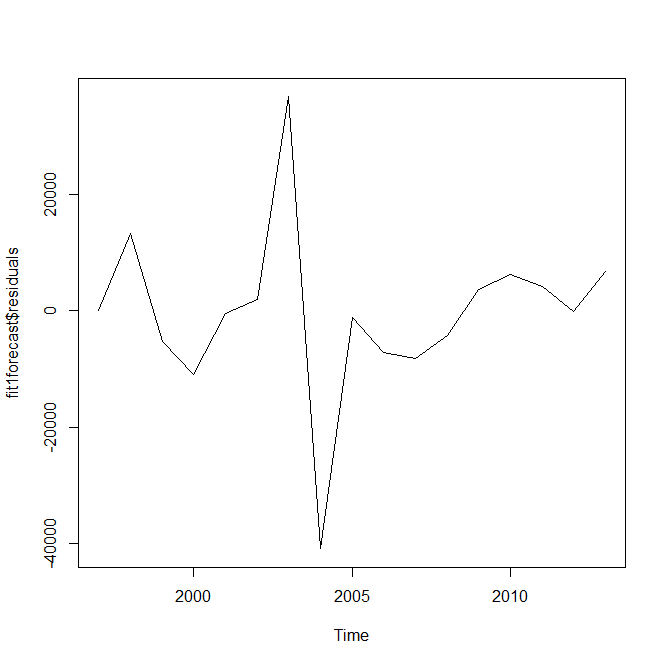 | Figure 6. Time series plot of forecast residuals |
3.3. Forecasting
As was expected, forecasting Zimbabwe Accident data yielded a value at the forecast origin, 37 619 accidents which corresponds to the number of accidents in 2013. Suppose  is the accident data series, then differencing once gives
  , which in this case was found to be white noise implying that
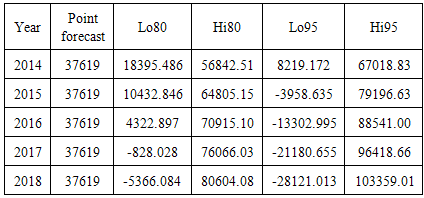
 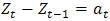 . The following table (table 2) shows forecasts for 2014-2018 and confirms the above theory.
Table 2. Forecasts and their corresponding 80% and 95% confidence limits
 |
| |
|
The in-sample forecast errors in figure 6 above seem to have a constant variance over time.Figure 7 shows ACF plot of the forecast errors with no significant spike suggesting lack of serious correlations among them. It also means the model may not be improved any further. The Box-Ljung statistic for the forecast errors is 4.6044 with a p-value of 0.9699 implying that there is no evidence of non-zero autocorrelations in the in-sample forecast errors.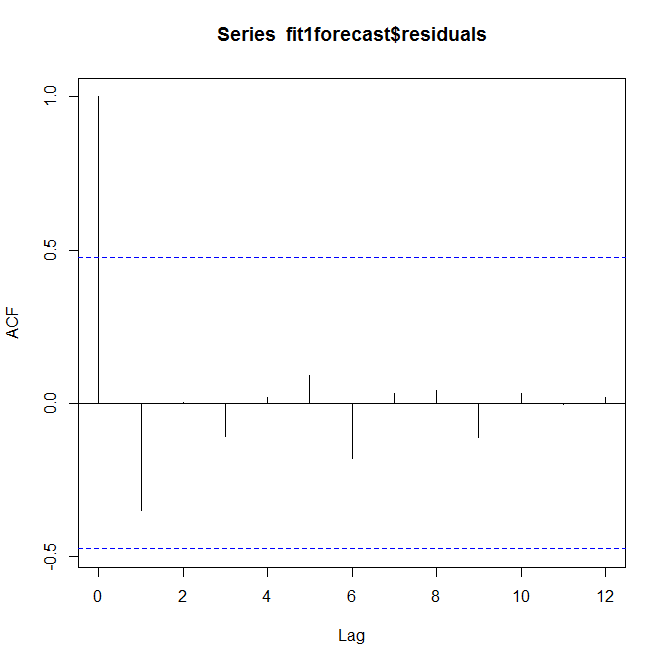 | Figure 7. ACF plot of forecast residuals |
 | Figure 8. Showing Number of persons killed in road accidents |
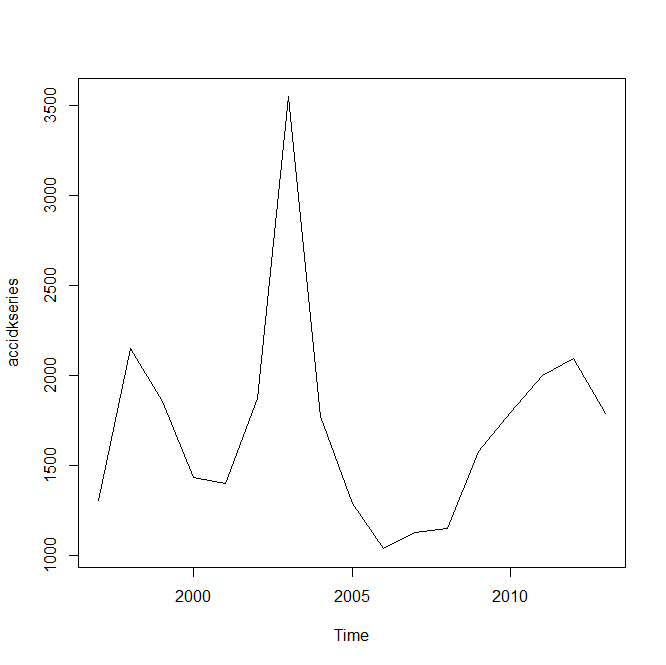
3.4. Data Analysis and Tests for Stationarity: Persons Killed in Accidents
In this section, analysis is focused on persons killed in road traffic accidents. The shape of the plot is the same as that for the total number of reported accidents. The number of people who died in road accidents increased from 1399 in 2001 reaching a peak of 3549 in 2003 which also corresponds to the high number of reported road accidents of 78 481 in 2003. The series is clearly non-stationary since its mean appears to be changing with time. Testing for stationarity using the ADF test gave a p = 0.07759 thus failing to reject the null hypothesis that the number of persons killed series is unit root non-stationary. The series became stationary after differencing once. An examination of the ACF and PACF of the differenced series follows in figures 9 and 10.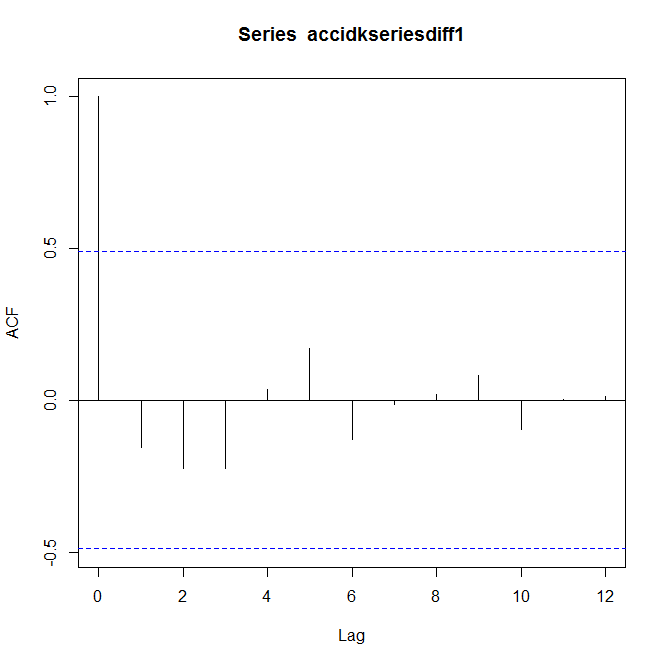 | Figure 9. ACF plot of differenced series of persons killed in accidents |
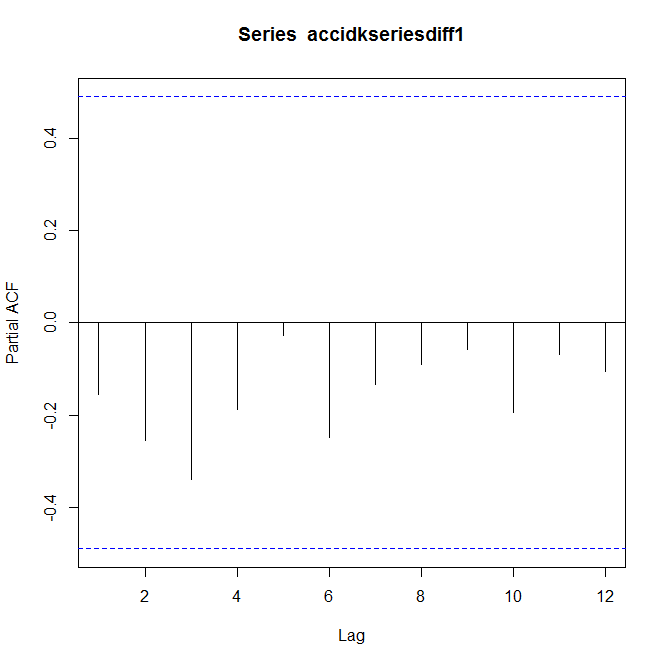 | Figure 10. PACF plot of the differenced series of persons killed in accidents in Zimbabwe |
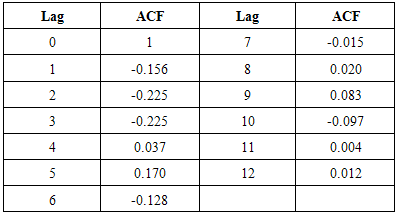
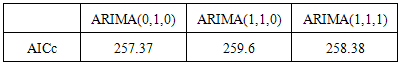
Both the ACF and PACF show no significant spike. ACFs or PACFs are significant if they exceed 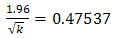 for k=17.Since none of the values of the ACF in table 3 exceeds 0.47537, the ACFs are not significant. This suggests an ARIMA (0,1,0) model, the same model fitted to the reported accidents data. A comparison of the AICc for the three possible models described earlier is based on data in table 4.
Table 3. ACF values for the number of persons killed in traffic accidents in Zimbabwe
 |
| |
|
Table 4. Information criteria for the proposed models
 |
| |
|
Clearly the AICc suggest the ARIMA(0,1,0) as a tentative model for the data. The Ljung-Box statistics showed non-zero correlations in the residuals with p=0.964. The residuals for this were found to be unit root stationary using the ADF test with p=0.01. Forecasting for this model was not necessary since it was going to give the value at the forecast origin as the forecast values for 2014-2018.
4. Conclusions
The research used annual data from the Zimbabwe Parliamentary report of the Portfolio Committee on Transport and Infrastructural Development on The Causes of Road Carnage, May 2014 report covering the period 1997 to 2013. The data was composed of three groups: total reported cases, persons killed in road accidents and persons injured. The data was unit root non-stationary based on results from the Augmented Dickey Fuller (ADF) test. First order differencing forced the data to become stationary. The Box-Jenkins model building strategy (1976) was applied on differenced series. The ACF and PACF of the differenced series gave a guideline on tentative models to be used. A spike in both plots (ACF and PACF) was considered significant if it was greater than 0.47537. There were no significant spikes in the ACF and PACF plots for the two data sets analysed. Three models were suggested: ARIMA(0,1,0), ARIMA(1,1,0) and ARIMA(1,1,1). The ARIMA model with the smallest AICc and BIC was chosen as the best model. Ljung-Box statistics were also used in assessing the quality of the model. ARIMA (0,1,0) emerged as the best model for Zimbabwe Total reported Traffic Accident cases as well as for the number of persons killed. Due to the nature of the model used which uses the value at the forecast origin as a forecast, forecasts for 2014-2018 yielded the same result. The implications of these findings are that making forecasts using a white noise process is difficult due to the fact that the values at different times are statistically independent.
Appendix 1
Zimbabwe Road Traffic Accident Data
 |
| |
|
References
| [1] | Zimbabwe National Statistics Agency (ZIMSTAT), August 2013 Report. |
| [2] | M. Peden, World Report on Road Traffic Injury Prevention. World Health Organisation, Geneva, 2004. |
| [3] | B. Agyemang, G.K. Abledu and R. Semevoh, Regression Analysis of Road Traffic Accidents and Population Growth in Ghana. International Journal of Business and Social Research, Vol 3(10), pp. 41-2013. |
| [4] | R.K Avuglah, K.A. adu-Poku and E. Harris, Application of ARIMA models to Road Traffic Accident Cases in Ghana. International Journal of Statistics and Applications, Vol 4(5), pp. 233-239, 2014. |
| [5] | G.U. Agbeboh and O.I. Osarumwense, Empirical Analysis of Road Traffic Accidents: A Case Study of Kogi State, North Central Nigeria. International Journal of Physical Sciences, Vol 8(40), pp. 1923-1933, 2013. |
| [6] | N. Soderland and A.B. Zwi, Traffic Related Mortality in Industrialised and less developed countries. Bulletin of World Health Organisation, Vol 73, pp.175-182, 2001. |
| [7] | S. Zaza and D.A. Sleet, Reviews of Evidence Regarding Interventions to Increase Use of Child Safety Seats. American Journal of Preventive Medicine, Vol 21(4S), pp.31-47, 2001 |
| [8] | A.O. Atubi, Time Series and Trend Analysis of Fatalities from Road Traffic Accidents in Lagos State, Nigeria. Mediterranean Journal of Social Sciences, Vol 4(1), pp. 251-260, 2013. |
| [9] | J.R. Aworeni, I.A. Abdul-Azeez and S.O. Olabode, Analytical Studies of The Causal Factors of Road Traffic Crashes in South Western Nigeria. International Research Journals, Educational Research, Vol 1(4), pp. 118-124, 2010. |
| [10] | A. Pludenmann, C.D.H. Parry, H. Donson and A. Sukhai. Alcohol Use and Trauma in Capetown, Durban and Port Elizabeth, South Africa: 1999-2001. Injury and Safety Promotion, Vol 11(4), pp. 265-267, 2004. |
| [11] | A.B. Monfared, H. Soori, Y. Mehrabi, H.Hatami and A. Delpisheh, Prediction of Fatal Road Traffic Crashes in Iran Using the Box Jenkins Time Series model. Journal of Asian Scientific Research, Vol 3(4), pp. 425-430, 2013. |
| [12] | A, Razzaghi, A. Bahrampour, M.R Baneshi and F. Zolala, Assessment of Trend and Seasonality in Road Accident data: An Iranian case study. International Journal of healthy policy and management, Vol 1(1), pp. 51-55, 2013. |
| [13] | Cejun Liu and Chou-Lin Chen, Time Series Analysis and Forecast of Annual Crash Fatalities. National Centre for Statistics, Research Note, March 2004. |
| [14] | I.S. Nduna, B. Magidi, F. Matarise, L. Siziba and A. Mhlanga, Generalised Linear Models and Their Application to Vehicle Accident Analysis in Zimbabwe. International Journal of Statistics and Systems, Vol 7(3), pp.315-331, 2012. |
| [15] | C. Chatfield, The Analysis of Time series: An Introduction, 5th Edition, Chapman and Hall, London, pp. 40-43, 1996. |
| [16] | A.C. Akpanta and I.E. Okorie, Application of Box-Jenkins Techniques in Modeling and Forecasting Nigerian Crude Oil Prices. International Journal of Statistics and Applications, Vol 4(6), pp. 283-291, 2014.DOI:10.5923/j.statistics.20140406.05. |
| [17] | Hyeok-Ku Kwon and Kyungwoo Kang, A Study of The trend Analysis in Road traffic Accidents Rates in Korea. Proceedings of the Eastern Asia Society for Transportation Studies, Vol 3(3), pp. 159-172, 2001. |
 Abstract
 Reference
 Full-Text PDF
 Full-text HTML