Ester L. Raagas
Kinaadman Research Center, Xavier University – Ateneo de Cagayan, Corrales Avenue, Cagayan de Oro City, Philippines
Correspondence to: Ester L. Raagas, Kinaadman Research Center, Xavier University – Ateneo de Cagayan, Corrales Avenue, Cagayan de Oro City, Philippines.
| Email: |  |
Copyright © 2015 Scientific & Academic Publishing. All Rights Reserved.
Abstract
The main purpose of this paper is to develop nonlinear models that estimate the probability of a household's access to basic infrastructure services (i.e., potable water, water for general use, sanitation and electricity) and the odds ratios on access to these basic services. The unit of analysis is primarily the households of one community in Southern Philippines where a relocation site was built and developed in early 2012. This relocation site accommodated more than 500 families of displaced survivors from the severe flood caused by Typhoon Washi that hit Southern Philippines in December, 2011. Fourteen months after, a survey was conducted among 629 households from the host community and the relocation site. The microdata analysis, using logistic regression and odds ratios, resulted to four significant nonlinear models to estimate households' access to basic infrastructure services. The nonlinear models show that poor households among the residents of the barangay and those from the relocation site, have less chances of availing the basic infrastructure services. For access to potable water, the odds ratios of the poor households is almost 3 times lower than non-poor households. However, households from the relocation site have higher odds ratio on access to sanitation, almost 24 times higher than those households of the host community. These findings indicate that households in the relocation site were better served than the host community considering access to some basic infrastructure services, pointing to the need of an inclusive access to basic services not only among the households of the relocated survivors but also the poor residents of the host community.
Keywords:
Access to basic infrastructure, Logistic regression models, Relocation site, Host community
Cite this paper: Ester L. Raagas, Logistic Regression on Access to Basic Infrastructure: The Case of Households from a Relocation Site and Its Host Community in Southern Philippines, International Journal of Statistics and Applications, Vol. 5 No. 3, 2015, pp. 124-131. doi: 10.5923/j.statistics.20150503.05.
1. Introduction
1.1. Background
When Typhoon Sendong hit Southern Philippine in December of 2011, it caused severe flooding to different areas including a highly urbanized city in the country. Hundreds died and thousands of families were displaced. The city government relocated the survivors to different sites, usually to upland areas. One of these areas hosted more than 500 households. The entry of more than 500 displaced families to the community poses a big challenge to the capacity of the local government unit to provide basic services to both the relocated survivors and the host community residents. These basic services, among others, include water, sanitation and electricity. However, not all have easy access to these basic services. Oftentimes, the ability of a household to access basic services is shaped by its inherent characteristics [1].
1.2. Objectives of the Study
More than a year after the displaced survivors have settled in a relocation site, a survey was conducted among households from one relocation site and its host community to find out their access to basic infrastructure services. More specifically, this paper identifies circumstance variables, using the logistic regression analysis, that raise or deter a household's access to basic infrastructure services. The analysis is guided by the following objectives: 1) to develop nonlinear models that estimate the probability of a household's access to basic infrastructure services, i.e., potable water, water for general use, sanitation and electricity; and 2) to determine the odds ratios of household's access to these basic services.
2. Materials and Methods
2.1. Setting, Sampling Procedure and Participating Households
The estimation of nonlinear models for household's access to basic infrastructure services utilizes a microdata obtained from a survey conducted from January to February, 2013 in Barangay Lumbia, 13 to 14 months after Typhoon Sendong. This barangay is located at the southernmost part of Cagayan de Oro City, 11 kilometers away from the city with 174 meters elevation above sea level. One relocation site is built in this barangay in early 2012 to accommodate hundreds of displaced families due to Typhoon Sendong. The barangay has strong partners in the development of the relocation site.The data gathering procedure made use of the systematic random sampling in selecting participating households. Systematic random sampling assumes that the population elements are ordered in some fashion. Using Cochran's sample size estimation [2], the sample size of the survey was n=629 from a population of N=3831. The ratio N/n (=k) was also used to obtain the sampling interval. A random number is selected between 1 and k inclusively, every kth household in the population is then included in the survey.Information on the households' circumstance variables and access or non-access to basic infrastructure services were gathered through direct interviews using the Community Based Monitoring System [3] upon the approval of the Barangay Council. The respondent for each participating household is the household head or his/her representative.
2.2. The Logistic Regression Analysis
One of the most popular approach to modeling binary responses is the logistic regression. Logistic regression forms a best fitting function using the maximum likelihood method, which maximizes the probability of classifying the observed data into the appropriate category given the regression coefficients [4]. In this study, the logistic regression analysis was done using a standard statistical software [5].There are characteristics in logistic regression that would allow researchers to undergo a deeper analysis of macro or micro data sets. These are embodied in its assumptions: a) logistic regression does not assume a linear relationship between the dependent and independent variables; b) the regressors need not be interval, nor normally distributed, nor linearly related, nor of equal variance within each group.The Logistic regression model is given as follows; 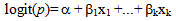 | (1) |
and the probability (p) estimate is shown below: 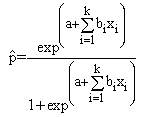 | (2) |
where x1...xk refer to the k indepedent variables. The significance of each of the coefficient is based on the Wald statistic, as follows: Wald = [/s.e.B]2 which has a Chi-square  distribution with df=1.Furthermore, one form of inference that is accomplished using logistic regression is derived from the use of the odds ratio. The odds ratio is designed to determine how the odds of success, (p)/(1−p), increases as certain changes in regressor values occur [6].The logistic regression is only one of the popular methods used to analyze binary responses [16]. It generates the same results with that of probit analysis. However, the latter is commonly used in the analysis when the data is assumed to be normally distributed.
3. Results and Discussion
3.1. Results
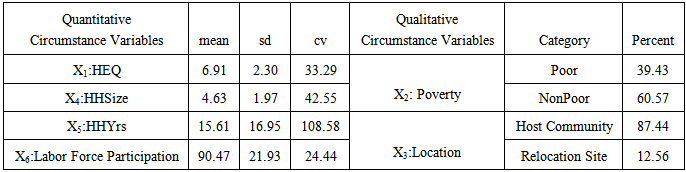
The statistical analysis is guided by the objectives set forth earlier. The presentation begins with the descriptive statistics of the circumstance and response variables and multicollinearity diagnostics. The subsequent presentations follow the sequence of the objectives taking into account the order of the response variables (y1, y2, y3, y4); first the nonlinear model then followed by the odds ratios of each of y1, y2, y3, and y4.Generally, the barangay households have 4 to 5 members with a mean of almost 16 years of stay in the barangay. The highest educational attainment of the household heads and the spouses is at the secondary level. In terms of poverty, 39% of the households in the barangay are categorized as poor while majority of the households are in the nonpoor category. The later maybe due to more than five housing subdivisions that are popular and affordable to the middle class families. The same trend of percentage distribution is reflected in the households access to basic infrastructure.Table 1. Descriptive Statistics of Circumstance Variables (n=629)
 |
| |
|
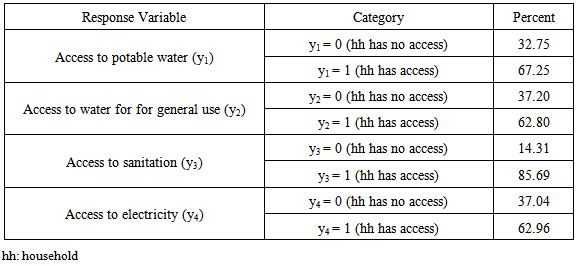
Table 2. Descriptive Statistics of Response Variables (n=629)
 |
| |
|
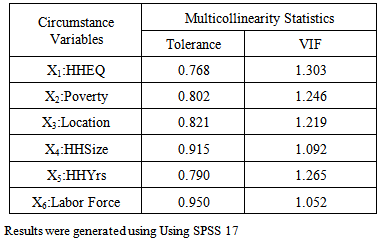
The Multicollinearity Diagnostics (Table 3) show the Tolerance and the VIF columns. These are both measures of multicollinearity among the variables (VIF stands for variance inflation factor). These show the degree to which each circumstance variable is explained by the other variables. Multicollinearity does not exist among the circumstance variables since all the tolerance values are higher than 0.10, and the VIF values are smaller than 5.Table 3. Multicollinearity Diagnostics
 |
| |
|
3.1.1. Household's Access to Potable Water (y1)
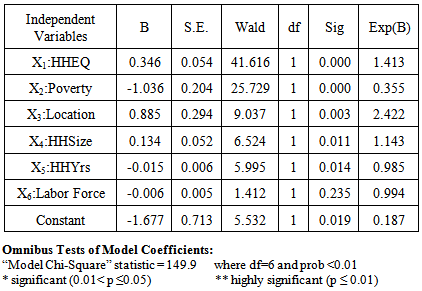
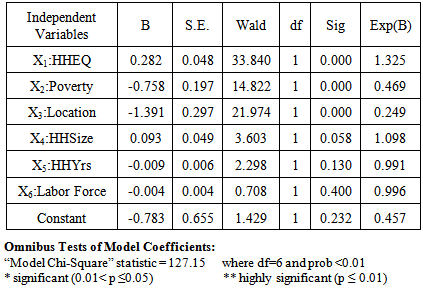
The response variable y1 is a dichotomous variable where y1=1 if the household has access to potable water, otherwise, y1=0. The logistic regression analysis started with the following six circumstance variables: x1=educational attainment of the household head and spouse (HHEQ), x2=poverty (where x2 =1, if household is poor, otherwise x2=0), x3=household location where x3=0, i.e., a household of a resident in the host community, otherwise x3=1, i.e., a household of a survivor in the relocation site, x4=household size (HHSize), x5=years of stay in the barangay (HHYears), and x6=count of household members in the labor force.The initial results of the logistic regression analysis are shown in Table 4 where y1 refers to household's access to potable water. These findings indicate a highly significant model  based on the Omnibus tests of model coefficients for the statistical significance of the overall model.
Table 4. Initial Logistic Regression Analysis of Households' Access to Potable Water (n=629)
 |
| |
|
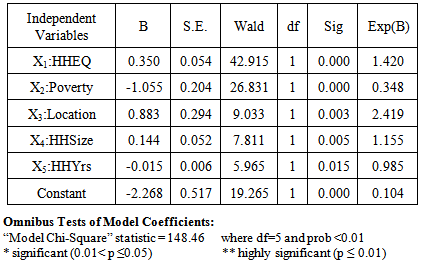
Only one independent variable, the labor force participation, does not explain significantly household's access to potable water. This result may present a disconnect to the effect of employment of household members to better access of basic services. This may not be the case in this study. The nonsignificant result may be attributed to the behavior of the labor force participation(x6) as a variable. As shown in the descriptive statistics, the coefficient of variation, 23%, (mean=90.48, sd=21.93) would show that x6 behaves almost like a constant and thus in the modeling process, the variation in y1 cannot be explained by x6 . In fact, among all the circumstance variables, x6 has the smallest coefficient of variation indicating its level of homogeneity. In the preceding models, x6 remains nonsignificant.Thus, a final logistic regression analysis was done with only the significant circumstance variables. These are shown in Table 5.Table 5. Final Logistic Regression Analysis of Households' Access to Potable Water (n=629)
 |
| |
|
The final logistic regression results of y1, as shown in table 5, indicate a highly significant model  with the inclusion of all the five significant circumstance variables. Model 1:
  | (3) |
Probability Estimate 1: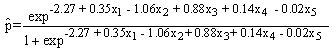 | (4) |
These results indicate that a household's access to potable water is highly dependent on the following circumstance variables: educational attainment, poverty level, location, household size and household's years in the barangay. The two circumstance variables, educational attainment and household size contribute significantly to the increase in the log odds of households' access to potable water. For poor households (below the poverty line), there is a 1.06 unit decrease in the log odds on access to potable water controlling for the other variables. While for households in the relocation site, there is a 0.88 unit increase in the log odds for access to potable water holding the other variables constant. A household with the following characteristics: 6 members, classified as poor, secondary level educational attainment of both household head and spouse and household has been in the relocation site for 1 year, has an estimated probability of 0.79 on access to potable water compared to a household of the same characteristics from the community where the estimated probability is 0.70. The odds ratios on access to potable water due to the different circumstance variables (x1, x2, x3, x4, x5) showed that households in the relocation site have a higher odds ratio on access to potable water is exp(B)=2.42, i.e. 2.42 times higher than those households in the community, holding educational attainment, poverty, household size and years of stay in the barangay constant. While the odds of poor households on access to potable water is almost 3 times lower than non-poor households, generated from Exp(B)=0.348 in table 5.
3.1.2. Household's Access to Water for General Use (y2)
The response variable y2 is a dichotomous variable where y2=1 if the household has access to water for general use, otherwise, y2=0. The initial logistic regression analysis include all the six circumstance variables: x1=educational attainment of the household head and spouse (HHEQ), x2=poverty (where x2 =1, if household is poor, otherwise x2=0), x3=household location (where x3=1 if household is located in the relocation site, otherwise x3=0, where household is from the community), x4=household size (HHSize), x5=years of stay in the barangay (HHYears), and x6=count of household members in the labor force. The initial results are shown in Table 6.Table 6. Initial Logistic Regression Analysis of Households' Access to Water for General Use (n=629)
 |
| |
|
The logistic regression results in table 6 indicate a highly significant model  However, two circumstance variables, household years in the barangay and labor force, do not explain significantly household's access to potable water. Thus, a final logistic regression analysis was done with only the significant circumstance variables. These are shown in Table 7.
Table 7. Final Logistic Regression Analysis of Households' Access to Water for General Use (n=629)
 |
| |
|
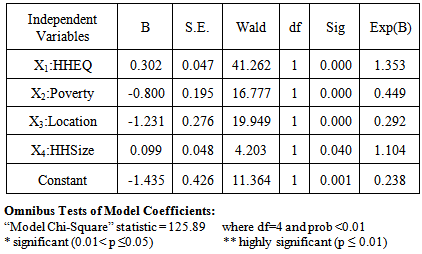
The final logistic regression results of y2, as shown in table 2b, indicate a highly significant model  with the inclusion of all the four significant circumstance variables.Model 2:
  | (5) |
Probability Estimate 2: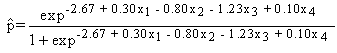 | (6) |
Model 2 indicates that a household's access to water for general use is highly dependent on the following circumstance variables: educational attainment, poverty level, location and household size. The two circumstance variables, educational attainment and household size contribute significantly to the increase in the log odds of households' access to water for general use. For poor households (below the poverty line), there is a 0.80 unit decrease in the log odds on access of water for general use controlling for the other variables. For households in the relocation site, there is a 1.23 unit decrease in the log odds for access to water for general use holding the other variables constant. From the probability estimate 2, a poor household with the following characteristics: 6 members, secondary level educational attainment of both household head and spouse, and household is located in the relocation site, has an estimated probability of 0.25 on access to water for general use compared to a poor household of the same characteristics from the community where the estimated probability is 0.50. The odds ratios on access to water for general use due to the different circumstance variables (x1, x2, x3, x4) showed that households in the relocation site have lower odds ratio on access to this basic infrastructure, i.e., around 3 times lower than those households from the community, from Exp(B)= 0.292 in table 2b. The odds of poor households on access to water for general use is around 2 times lower than non-poor households holding the other variables constant, Exp(B)= 0.449 in Table 7. The results shown in table 7 would indicate further that households in the community have higher access to water for general use compared to the households from the relocation site.
3.1.3. Household's Access to Sanitation(y3)
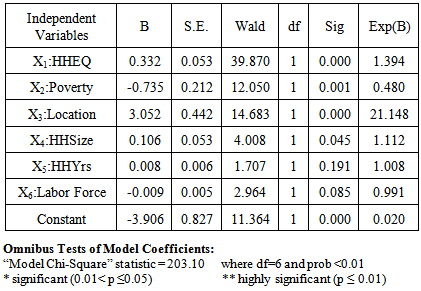
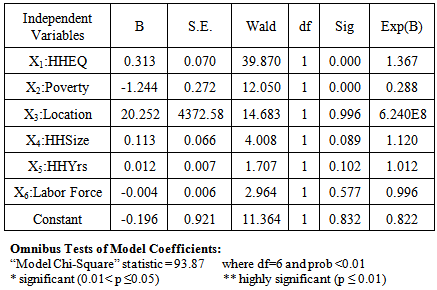
The response variable y3 is a dichotomous variable where y3=1 if the household has access to sanitation, otherwise, y3=0. The initial logistic regression analysis includes all the six circumstance variables: x1=educational attainment of the household head and spouse (HHEQ), x2=poverty (where x2 =1, if household is poor, otherwise x2=0), x3=household location (where x3=1 if household is located in the relocation site, otherwise x3=0, where household is from the community), x4=household size (HHSize), x5=years of stay in the barangay (HHYears), and x6=count of household members in the labor force. The initial results are shown in Table 8.Table 8. Initial Logistic Regression Analysis of Households' Access to Sanitation (n=629)
 |
| |
|
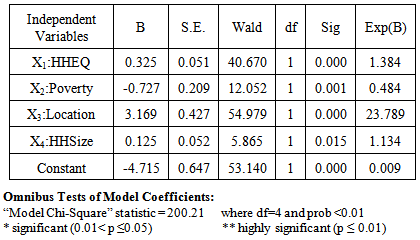
The final logistic regression results of y3, as shown in table 8, indicate a highly significant model  with the inclusion of all the four significant circumstance variables.Model 3:
  | (7) |
Probability Estimate 3: 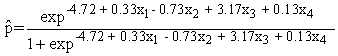 | (8) |
The logistic regression results in table 8 indicate a highly significant model  However, two circumstance variables, household years in the barangay and labor force, do not explain significantly household's access to sanitation. Thus, a final logistic regression analysis was done with only the significant circumstance variables. These are shown in Table 9.
Table 9. Final Logistic Regression Analysis of Households' Access to Sanitation (n=629)
 |
| |
|
These results indicate that a household's access to sanitation is highly dependent on the following circumstance variables: educational attainment, poverty level, location, and household size. The two circumstance variables, educational attainment and household size contribute significantly to the increase in the log odds of households' access to sanitation holding the other variables constant. For poor households (below the poverty line), there is a 0.73 unit decrease in the log odds on access to sanitation controlling for the other variables. For households in the relocation site, there is a 3.17 unit increase in the log odds for access to sanitation holding the other variables constant. A household from the relocation site with the following characteristics: 6 members, classified as poor, and a secondary school level educational attainment of both household head and spouse has an estimated probability of 0.79 on access to sanitation compared to a poor household of the same characteristics from the community where the estimated probability is 0.21. The odds ratios on access to sanitation due to the different circumstance variables (x1, x2, x3, x4) indicate that households in the relocation site have higher odds ratio on access to sanitation, exp(B)= 23.79, i.e., almost 24 times higher than those households from the host community. The odds of poor households on access to sanitation is 2 times lower than non-poor households from exp(B)=0.484). In general, the results shown in table 9 further shows that poor households from the host community have smaller probabilities on access to sanitation compared to the poor households from the relocation site.
3.1.4. Household's Access to Electricity(y4)
The response variable y4 is a dichotomous variable where y4=1 if the household has access to electricity, otherwise, y4=0. The initial logistic regression analysis include all the six circumstance variables: x1=educational attainment of the household head and spouse (HHEQ), x2=poverty (where x2 =1, if household is poor, otherwise x2=0), x3=household location (where x3=1 if household is located in the relocation site, otherwise x3=0, where household is from the host community), x4=household size (HHSize), x5=years of stay in the barangay (HHYears), and x6=count of household members in the labor force. The initial results are shown in Table 10.Table 10. Initial Logistic Regression Analysis of Households' Access to Electricity (n=629)
 |
| |
|
The logistic regression results in table 4a indicate a highly significant model 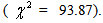 However, only two circumstance variables, educational attainment of the household head and spouse and household poverty explain significantly household's access to potable water. Thus, a final logistic regression analysis was done with only these significant circumstance variables included in the analysis. These are shown in Table 11.
Table 11. Initial Logistic Regression Analysis of Households' Access to Electricity (n=629)
 |
| |
|
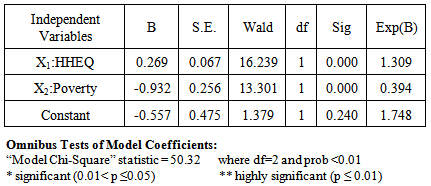
The final logistic regression results of y4, as shown in table 11, indicate a highly significant model  with the inclusion of the two significant circumstance variables. Model 4:
 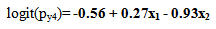 | (9) |
Probability Estimate 4: 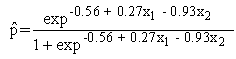 | (10) |
These results show that a household's access to electricity is highly dependent on educational attainment and household poverty level. Educational attainment contributes significantly to the increase in the log odds of households' access to electricity. For poor households (below the poverty line), there is a 0.93 unit decrease in the log odds on access to electricity controlling for the other variables. A poor household with a secondary level educational attainment has an estimated probability of 0.73 on access to electricity. This is also true to a poor household in the host community and the relocation site. The odds ratios on access to electricity due to the circumstance variables educational attainment and household poverty level showed that poor households from the host community and the relocation sites have odds ratio of almost 3, meaning these poor households' access to electricity is 3 times lower than the non-poor households, holding the other variables constant.
3.2. Discussion
From the results of the logistic regression analysis, the models consistently show the following circumstance variables: educational attainment and household size to contribute significantly to the probability of household's access to the following basic infrastructure services: access to potable water and water for general use, access to sanitation and access to electricity. The educational attainment of household head and spouse is a function of a household's economic condition. Higher educational attainment would imply better economic condition, which is a household enabler to access basic infrastructure. The necessity for potable water, water for general use, sanitation and access to electricity is not only for households with few members but much more for large households. According to Koskei [7], households' access to safe drinking water and sanitation is closely related to household size and educational level of household head.The resulting models (Models 1, 2, 3, and 4) and the odds ratios also underscore the fact that for access to potable water, the odds ratios of poor households is almost 3 times lower than non-poor households. This result indicate inequality in access to sanitation. According to Son [8], inequality in access to basic services caused by circumstances is considered unjust and unacceptable, and should thus be reduced. However, between the host commnunity and the relocation site, households from the relocation site have higher odds ratio on access to sanitation, almost 24 times higher than those households from the host community. This is an indication of a better delivery of service to the relocation site, an outcome of better coordination and planning between the local government and its strong partners in the development of the relocation site. In fact, Xavier Ecoville, the relocation site, is supported by multigroups which include a Jesuit University. The later provided a multidisciplinary and a wholistic program that supported the relocated survivors. On the other hand, Model 2: logit(p)= -2.67 + 0.30x1 - 0.80x2 -1.23x3 + 0.10x4 indicated that households from the host community have better access in water for general use than household in the relocation site. Furthermore, the results indicated a lower odds ratio among poor households on access to water for general use than non-poor households. The poor households from the host community and the relocation site have the same odds ratio in access to electricity, 3 times lower than the non-poor households. In the absence of electricity, households usually opt for kerosene lamps. This type of electricity replacement may cause eye irritation, coughing, and nasal problems and in some cases accidental kerosene poisoning [9]. The absence of electricity even for purposes of good lighting limits the productivity of household members, hindering the ability of household members to carry out basic activities at night or in the early morning, including household chores, reading and schoolwork [10]. Energy is essential for the provision of health care; clean water and sanitation; and reliable and efficient lighting, heating, and cooking [11].
4. Conclusions
In sum, the findings of this study revealed that circumstance variables namely: educational attainment and household size, significantly raise the probability of household's access to potable water and water for general use, access to sanitation and access to electricity (Model 1: logit(p)=-2.27 + 0.35x1 - 1.06x2 + 0.88x3 + 0.14x4 - 0.02x5 ; Model 2: logit(p)= -2.67 + 0.30x1 - 0.80x2 - 1.23x3 + 0.10x4 ; Model 3: logit(p)= -4.72 + 0.33x1 - 0.73x2 + 3.17x3 + 0.13x4 ; Model 4: logit(p)= -0.56 + 0.27x1 - 0.93x2). The major deterrent to this access is poverty among households from the relocation site and its host community. Households of the host community and the relocated survivors have the same probability of access to electricity with the later having higher odds ratio on access to potable water, and sanitation, from 2 to 24 times higher than those households from the host community. These findings indicate that households in the relocation site were better served than the host community considering access to basic infrastructure services. The findings further imply that provision for basic services should not only focus on the relocated survivors but can be made inclusive of the poor households of the host community to strike a balance in access to basic services.
ACKNOWLEDGMENTS
This paper is part of a research project, led by this author, funded by the Philippine Commission on Higher Education (CHED) and Xavier University-Ateneo de Cagayan through the Xavier University-Ateneo de Cagayan Higher Education Regional Research Center (XU-HERRC).
References
| [1] | Rahman, Mustafa A.2013. "Household Characteristics and Poverty: A Logistic Regression Analysis". The Journal of Developing Areas, Volume 47 No. 1 Spring 2013; Retrieved November 18, 2014, ProQuest from http://library.xu.edu.ph/index.htm. |
| [2] | Cochran, W. G. Sampling Techniques. 1977. 3rd ed. New York: John Wiley & Sons, Inc. |
| [3] | Community-Based Monitoring Survey CBMS-Lumbia, 2012, Barangay Lumbia, Cagayan de Oro City, Philippines. |
| [4] | Burns, Robert and Richard Burns. 2008. "Logistic Regression" in Business Research Methods and Statistics Using SPSS. SAGE Publications Ltd, London. |
| [5] | SPSS Inc. Released 2008. SPSS Statistics for Windows, Version 17.0. Chicago: SPSS Inc. |
| [6] | Walpole, Ronald, Myers, R.H., Myers, S.L. and Ye K. 2012. "Multiple Linear Regression and Certain Nonlinear Regression Models" in Probability and Statistics for Engineers and Scientists. 9th ed. New York: Prentice Hall. |
| [7] | Koskei, E.C., Ondimu, K.N., Obwoyere, G.O. and Mironga, J.M. (2013), “Determinants of variation in households’ level of access to improved water sources and basic sanitation in Bomet municipality, Kenya”, International Journal of Development and Sustainability, Vol. 2 No. 2, pp. 1499-1512. |
| [8] | Son, Hyun H. 2013. Inequality of Human Opportunities in Developing Asia. Asian Development Review, vol. 30, no. 2, pp. 110–130 C; Retrieved November 17, 2014, ProQuest from http://library.xu.edu.ph/index.htm. |
| [9] | Paes de Barros, Richard, Francisco Ferreira, Jose R.Molinas Vega, and Jaime Saavedra Chanduvi. 2008. Measuring Inequality of Opportunity in Latin America and the Caribbean. Conference Edition. Washington, DC: World Bank. |
| [10] | Murphy, Daniel, Sharma, Arsh. 2014. Scaling Up Access to Electricity: The Case of Lighting Africa. World Bank, Washington, DC. © World Bank.https://openknowledge.worldbank.org/handle/10986/18681 License: CC BY 3.0 IGO.” |
| [11] | Ghosh, Banerjee S., Portale, Elisa. 2014. Tracking Access to Electricity. World Bank, Washington, DC. © World Bank. https://openknowledge.worldbank.org/handle/10986/18413 License: CC BY 3.0 IGO. |
| [12] | Biller, Dan; Andres, Luis; Herrera Dappe, Matias. 2014. Infrastructure Gap in South Asia: Inequality of Access to Infrastructure Services. World Bank Group, Washington, DC. © World Bank.https://openknowledge.worldbank.org/handle/10986/20344 License: CC BY 3.0 IGO. |
| [13] | World Bank. 2005. Philippines: Meeting the Infrastructure Challenges. Washington, DC. © World Bank. https://openknowledge.worldbank.org/handle/10986/8459 License: CC BY 3.0 Unported. |
| [14] | National Statistical Coordination Board, 2013. 2012 Full Year Official Poverty Statistics of the Philippines. Makati City 1200, Philippines. |
| [15] | Crane, Randall, Amrita Daniere. 1996. "Measuring access to basic services in global cities: Descriptive and behavioral approaches". American Planning Association. Journal of the American Planning Association; 62, 2; Retrieved November 18, 2014, ProQuest from http://library.xu.edu.ph/index.htm. |
| [16] | Hailpern, S, Paul Visintainer. 2003. "Odds ratios and logistic regression: further examples of their use and interpretation". The Stata Journal (2003) 3, Number 3, pp. 213–225. |
 Abstract
 Reference
 Full-Text PDF
 Full-text HTML