-
Paper Information
- Paper Submission
-
Journal Information
- About This Journal
- Editorial Board
- Current Issue
- Archive
- Author Guidelines
- Contact Us
International Journal of Statistics and Applications
p-ISSN: 2168-5193 e-ISSN: 2168-5215
2015; 5(3): 99-108
doi:10.5923/j.statistics.20150503.01
A Joint Modeling Approach to Assess the Impact of CD4 Cell Count on the Risk of Loss to Follow up in HIV/AIDS Patients on Antiretroviral Therapy
 Abstract
 Reference
 Full-Text PDF
 Full-text HTML
Gurprit Grover1, Prafulla Kumar Swain1, Vishal Deo2, Manoj Kumar Varshney3
1Department of Statistics, University of Delhi, india
2Department of Statistics, Ramjas College, University of Delhi, India
3Department of Statistics, Hindu College, University of Delhi, India
Correspondence to: Prafulla Kumar Swain, Department of Statistics, University of Delhi, india.
| Email: |  |
Copyright © 2015 Scientific & Academic Publishing. All Rights Reserved.
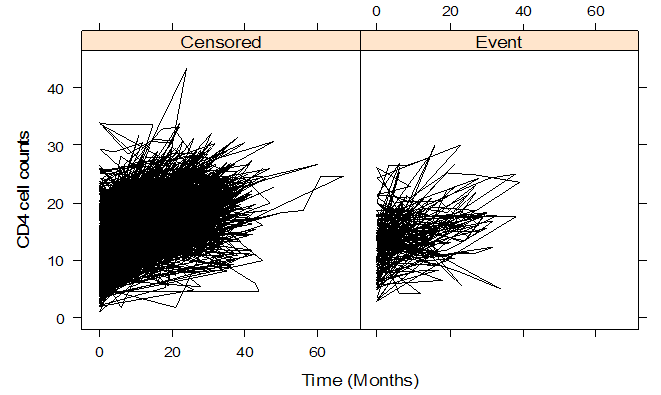
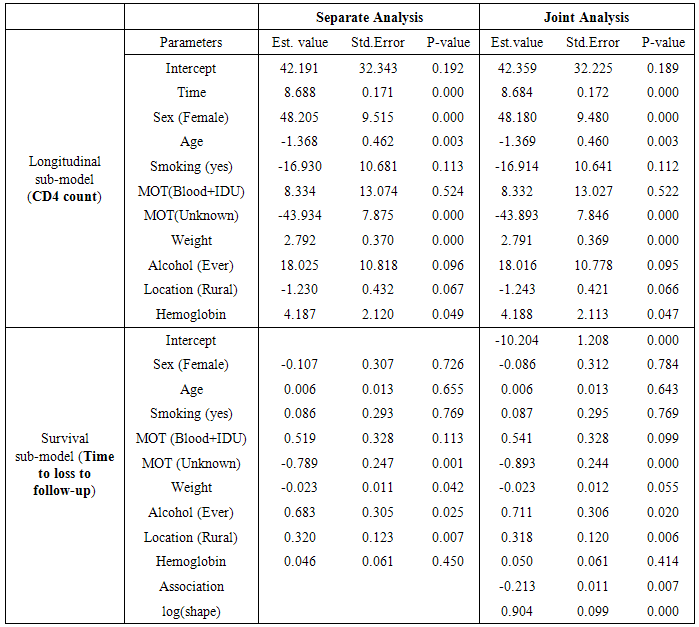
Lately, joint modeling has been reckoned as a very efficient technique for studying combinations of longitudinal and survival data generated from medical studies. In this paper we have developed a joint model to simultaneously study the longitudinal repeated measures on CD4 cell counts and the time to event (event being defined as loss to follow up) process of HIV/AIDS patients undergoing Anti-retroviral therapy (ART) treatment at Dr. Ram Manohar Lohia Hospital’s ART centre, New Delhi, India. Apart from increasing the risk of the HIV infection to progress to AIDS, the event of loss to follow up in patients undergoing ART seriously interferes with the development, improvement, and validation of treatment techniques being used in the therapy. The fact that the problem of loss to follow up from ART has been understated in studies based on ART centers in India has motivated us to investigate the effect of various clinical, socioeconomic and demographic factors on the hazard of loss to follow up in patients undergoing ART treatment. The results of the joint model have been compared with those of the separate analyses of the longitudinal and the survival data. The parameter estimates of both methods are consistent; however, the joint analysis supports the dependence of the hazard of lost to follow up from ART treatment on the rate of change in CD4 counts, apart from the patient’s baseline CD4 count. The estimated overall survival probability for HIV/AIDS patients retained on antiretroviral therapy was 0.81; 95%CI (0.76- 0.87).
Keywords: HIV, AIDS, Antiretroviral Therapy, Joint modeling, Longitudinal data
Cite this paper: Gurprit Grover, Prafulla Kumar Swain, Vishal Deo, Manoj Kumar Varshney, A Joint Modeling Approach to Assess the Impact of CD4 Cell Count on the Risk of Loss to Follow up in HIV/AIDS Patients on Antiretroviral Therapy, International Journal of Statistics and Applications, Vol. 5 No. 3, 2015, pp. 99-108. doi: 10.5923/j.statistics.20150503.01.
Article Outline
1. Introduction
- Longitudinal data and survival data often arise together in biomedical and clinical studies, where patients are followed up over time, and biomarkers are recorded repeatedly at different time points. There are various dynamic medical scenarios (viz. Liver cirrhosis studies in which our interest lies in the association of serum bilirubin and the time to death, Cancer studies in which we investigate the association between prostate specific antigen levels and the time to development of prostate cancer, HIV studies where interest lies in the association between CD4 cell counts (or viral load) and time to AIDS or death, or even Diabetics research where interest lies in the association of patients’ hemoglobin level and time to death) where both the association structure of repeated biomarkers measurements and the primary survival endpoints are studied. Various standard methods are available for analyzing such data separately, viz. linear mixed effects (LME) models for longitudinal data, and Cox proportional hazard (PH) models for survival data. LME model describes the process of the repeated measures on biomarkers over time while Cox PH model evaluates the effect of covariates on the hazard of an event. However, the use of separate models may be inappropriate and may provide biased inferences because they fail to take into account the association between the two components of the data [1]. One approach of studying the two components together is to incorporate the longitudinal measurements directly into the Cox model as time varying covariates, but this method does not account for the measurement errors in the time varying covariates and, therefore, can cause the estimated relative risk parameter in the time dependent Cox model to be biased towards the null [2]. Moreover, the time varying covariates are assumed to experience changes in their values at the times of follow up visits only and are assumed to remain constant during the time intervals in between these follow up visits, which is unrealistic in most of the situations. In the circumstances discussed above, a joint model is desirable over separate models or even over the time dependent Cox model, to understand the association between the longitudinal and the time to event processes. Joint modeling can be perceived to be a sophisticated and complex approach in terms of estimation, however, its superiority comes from its ability to model the longitudinal repeated biomarkers measurements and the survival processes together while also taking into account the association between them. By including the random effects model for longitudinal data in the survival model, the patterns of a biomarker’s performance and the relationship between its progression and survival time can be characterized. In this way, joint modeling provides less biased estimates and more efficient inferences than separate models [3, 4].Joint modeling has been extensively studied by many authors in the last two decades. Tsiatis and Davidian (2004) [5] provided a very thorough overview of early work on joint models, including those of De Gruttola and Tu (1994) [6], Wulfsohn and Tsiatis (1997) [4], Henderson et al. (2000) [7], and Wang and Taylor (2001) [8], among others. More recent work, including Ding and Wang (2008) [9], Nathoo and Dean (2008) [10], Ye et al. (2008) [11], Albert and Shih (2010) [12], Jacqmin-Gadda et al. (2010) [13], Rizopoulos, (2012) [14], Wu et al. (2010) [15], and Huang et al. (2011) [16], have extensively discussed the development, estimation and applications of joint models.Yi-Kuang Tseng et al., [17] used a joint modeling (graphic approach) to model survival time and time dependent CD4 count simultaneously for AIDS patients in Taiwan. Rui Martins et al. (2012) [18] developed a Bayesian hierarchical model for jointly modeling longitudinal and spatial survival data for a cohort of patients with HIV/AIDS in Brazil. Yi- Kuang Tseng et al. (2005) [19] proposed a viable joint modeling approach for accelerated failure time data and longitudinal and time-independent covariates. Thiebaut R. et al. (2005) [20], proposed a parametric joint modeling of bivariate longitudinal markers and a lognormal survival model for the time to drop out of HIV 1 infected patients starting antiretroviral treatment in Europe.Although many authors have applied joint modeling in HIV/AIDS epidemiology, most of their work has covered the joint modeling of the longitudinal CD4 cell counts and the survival times for the event death. In this paper we have made an attempt to develop a joint model of longitudinal CD4 cell counts and time to loss to follow up in HIV/AIDS patients undergoing antiretroviral therapy in an ART centre in Delhi, India. The introduction of free ART services in India in 2004 has significantly reduced the mortality and morbidity in HIV populations. However, a successful treatment of individual patients and the monitoring and evaluation of ART programmes, both depend on regular and complete patient follow up [21]. Possible loss to follow up occurred after initiation of ART may be due to the regime side effects or due to their poor health conditions like having lower CD4 counts or due to migration or even due to some social and psychological causes. Patients who are lost from ART programme develop drug resistance virus which ultimately results in drug failure [22]. As a result, such patients are at a higher risk of illness and death because of AIDS related conditions. The severity of the problem of discontinuation of patients from the ART programme, leading to loss to follow up, makes it essential to conduct a proper investigation to identify the responsible factors. The factors leading to loss to follow up may also vary from country to country because of the dissimilarity in their socio-economic structures and also due to the difference in the level of awareness among the patients and their family members in those countries. However, there is a dearth of literature on investigating predictors of loss to follow up after initiation of ART in India, [23]. Besides, accurate measures of loss to follow up are valuable for understanding processes and programmatic details, and they are critical to evaluating clinical outcomes. Therefore it is very important to study the loss to follow up in the presence of associated risk factors and biomarkers. The main objective of this paper is to build a joint model; simultaneous modeling of longitudinal CD4 counts and time to event (i.e loss to follow up) process and linking them using unobserved random effects through the use of a shared parameter model. The results are also compared with those obtained from separate analyses of the longitudinal and the survival data. The diagrammatical representation of joint modeling of longitudinal data and survival data has been depicted in the figure 1.
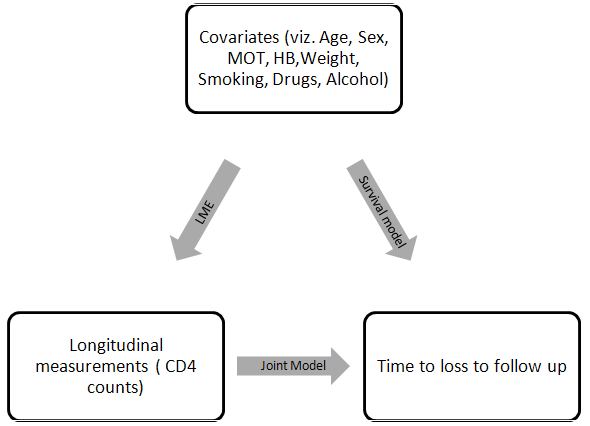 | Figure 1. Schematic representation of Joint model for HIV/ AIDS patients on ART |
2. Material and Methods
2.1. Study Population
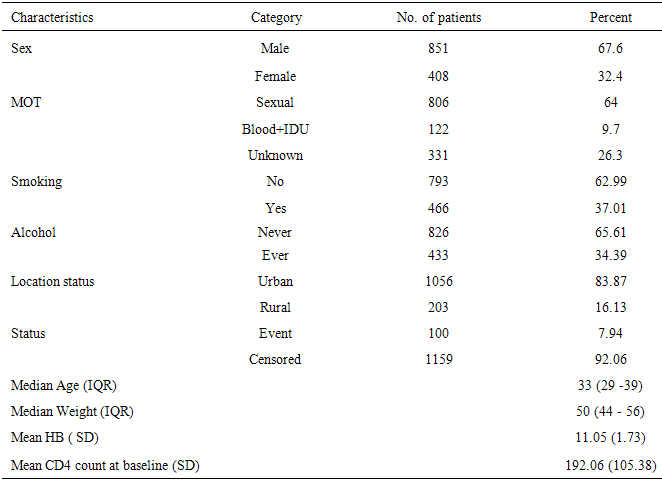
- We have considered 1259 adult (>18 years age) HIV/AIDS patients who were undergoing Antiretroviral Therapy in the ART centre of Dr. Ram Manohar Lohia Hospital, New Delhi, India, during the period April 2004 to November 2009, and were followed up through the ART routine register records till December 2010. Both longitudinal and survival data were recorded. The longitudinal response variable CD4 cell counts per mm3 of blood were measured approximately every 6 months irrespective of their visit to ART centres. The event of interest was time to loss to follow up of the patients from ART treatment. As per National AIDS Control Programme (NACO) guidelines patients missing ART refills/ appointments for more than three consecutive months at an ART centre are considered as lost to follow up. During the study period 15.7% of the total patients were dead and 7.9% patients were lost to follow up from the treatment care. The baseline information such as age, sex, CD4 count, mode of transmission (MOT), weight, smoking habit, alcohol habit and hemoglobin were collected. These variables were entered into the model as categorical variables – Sex (male/female), MOT (sexual/Blood+IDU/Unknown), smoking (yes/no), alcohol (never/ever) and continuous variables-Age, Hemoglobin and Weight. The category ‘sexual’ of the covariate MOT included both Homosexual and Heterosexual transmissions. The software packages survival and JM in R have been used for data analysis.
2.2. Methodology
- The study accommodates two different approaches of modeling the longitudinal CD4 data and the time to event data, viz. the separate modeling approach and the joint modeling approach (figure 1).
2.2.1. Separate Modeling
- A linear mixed model has been used for the longitudinal CD4 data and the time to event data has been modeled using a Cox proportional hazard model.
2.2.2. Joint Modeling
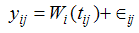
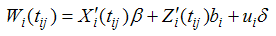
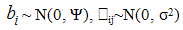
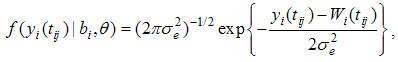
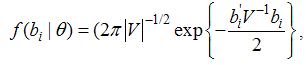
- Here our objective is to incorporate a time dependent covariate measured with error (longitudinal CD4 measurements of HIV/AIDS patients on ART) in a time to event model (loss to follow up being the event of our interest). Suppose we have a set of n individuals followed over time. Let Ti (i=1,2,…n) be the time to loss to follow up of ith HIV/AIDS patient on ART, and Ci be the corresponding censoring time. Let δi = I(Ti ≤ Ci ) be the censoring indicator such that δi = 0 if the survival time of ith individual is right censored and δi = 1, otherwise. Thus the observed survival data are {(ti, δi), i = 1,2,…n}, where ti = min(Ti, Ci ).A joint model is comprised of two sub-models, one for the longitudinal process and the other for the survival process. In this study, the joint distribution of the event times and longitudinal measurements is modeled via a set of random effects that are assumed to account for the associations between these two outcomes, as was earlier proposed by Gao et al. 2011 to analyze the direct impact of biomarkers variability on the survival outcome in a joint modeling set up. The Submodels Specifications In joint modeling framework, the longitudinal data are delineated by a conventional linear model assuming homogeneity within subject variance. However, such a homogeneity assumption automatically precludes the assessment of the research question “whether individuals with different levels of CD4 variability have different susceptibility to loss to follow from ART treatment”. Consequently, the joint model proposed in this study combines both approaches; that is, it relates the variability of longitudinal CD4 counts to time to loss to follow up of patients and also adds a frailty to the survival sub model. Frailty term in the survival sub model accounts for the heterogeneity among patients in terms of the CD4 trajectory affecting the time to event process. Longitudinal submodelLinear mixed effect models are widely used to model continuous longitudinal data (i.e CD4 counts). The sequence of measurements yi1, yi2, …yini for the ith subject at times ti1, ti2, …tini is modeled as (Laired and Ware, 1982) [26]
 | (1) |
 | (2) |

 Where yij is the observed longitudinal response for the ith patient measured at jth time point.
  and
and  are the design matrices for fixed (β) and random (bi) effects respectively. Furthermore, we also have a vector of covariates (possibly time dependent), ui
  Ui, and corresponding regression coefficient δ. We assume that the
  ij is independent of the random effects, and that cov(
 ij,
ij,  ik) = 0 (where i ≠ j). The term
  can be viewed as the true individual level CD4 trajectories after they have been adjusted for the overall mean trajectory and other fixed effects.Survival SubmodelThe Cox proportional hazard submodel is given by
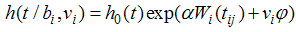 | (3) |
 is a set of regression coefficients associated with a set of covariates (again possibly time dependent), vi
  Ui. The value of the biomarker, as estimated by the longitudinal submodel, is included in the survival linear predictor as a time-varying covariate.If the covariate is included in both submodels, we can obtain an overall effect on survival as the longitudinal trajectory of the marker, multiplied by the association parameter, plus the direct effect on survival. Maximum Likelihood EstimationThe likelihood method is a widely used approach for the parameter estimation in the joint model. Assuming that censoring and timing of longitudinal measurements are non-informative, the likelihood function L with the observed data for each subject (Xi, δi, Zi, ti) is given by Wulfson and Tsiatis (1997).
 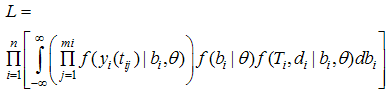 | (4) |
 | (5) |
 | (6) |
 | (7) |
3. Results
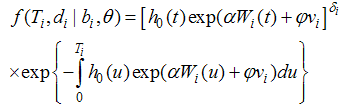
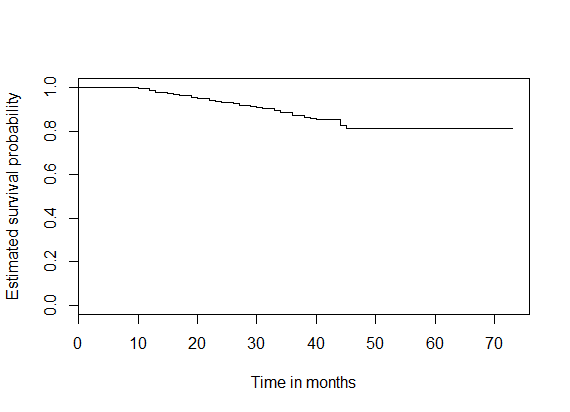
- Table 1 shows the baseline descriptive statistics of HIV/AIDS infected patients on ART. Out of the total 1259 patients 851 (67.6%) were males and the remaining 408 (32.6%) were females. Majority (64%) of the infected patients had reported sexual mode of HIV transmission, including both homosexual and hetro-sexual modes of transmission, followed by those with unknown mode of transmission who accounted for 26.3% of the total, and 9.7% of them had experienced blood+ IDU route of HIV infections. 37.01% and 34.4% of the infected patients had habits of smoking and drinking alcohol (ever) respectively. The median (IQR) age at the start of ART was 33 (29-39) years. The median weight at baseline was 50 kg (with IQR; 44-56). The mean (SD) hemoglobin level at the initiation of ART was 11.05 (1.73) and the mean (SD) CD4 count at baseline was 192.06 (105.28) cells/mm3. Figure 2 shows the profile of longitudinal CD4 cell count measurements over time for HIV/AIDS patients, separately for censored and event cases. The plotted profiles tend to generate a linearly increasing pattern which rationalizes the use of Linear Mixed Effect model to analyze the trajectory of CD4 cell count. Comparison of box plots (figures 4.1-4.4) constructed for different categories of patients formed on the basis of the factors, sex, mode of transmission, smoking habit and alcohol consumption exhibits higher median CD4 counts for (a) female patients as compared to that of males, (b) patients with unknown mode of transmission than those with known modes of transmission, (c) regular smokers as compared to that of non smokers, and (d) alcohol consumers as compared to that of non consumers.
 | Figure 2. Longitudinal CD4 cell count measurements over time for HIV/AIDS patients, separately for censored/event |
 | Figure 3. K-M Survival plot for HIV/AIDS patients retained on ART |
 | Figure 4.1. Box plot for CD4 counts by Sex |
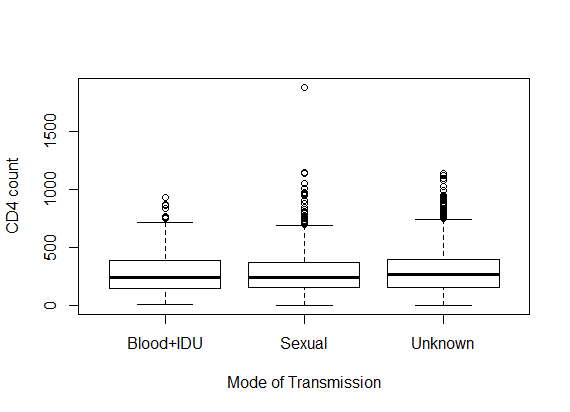 | Figure 4.2. Box plot for CD4 counts by mode of transmission |
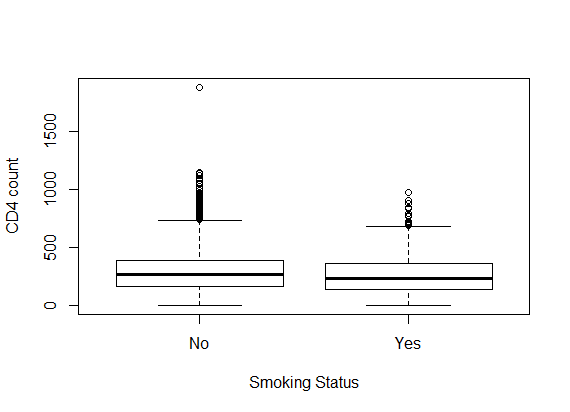 | Figure 4.3. Box plot for CD4 counts by smoking status |
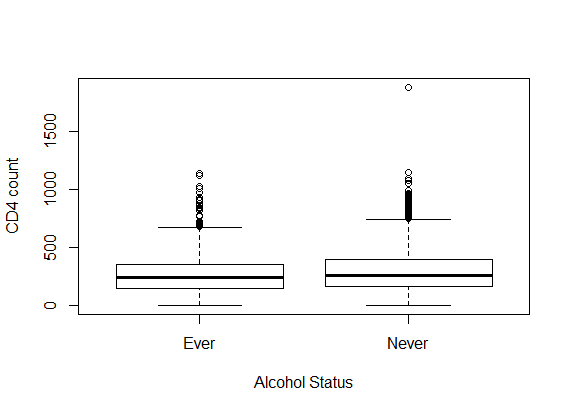 | Figure 4.4. Box plot for CD4 counts by alcohol status |
|
|
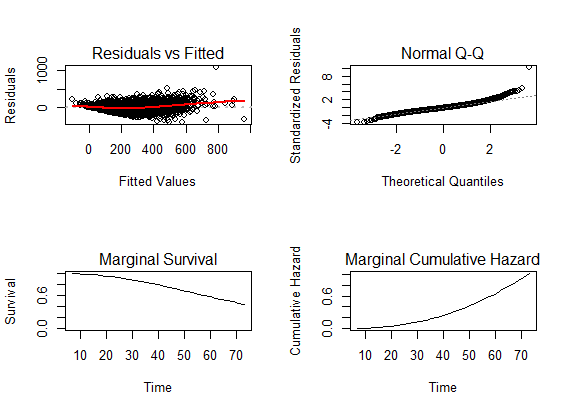 | Figure 5. Diagnostic plots for the fitted joint model for HIV/AIDS patients on ART |
4. Discussion
- In this paper, we have studied the relationship between the trajectory of CD4 counts over time and the risk of loss to follow up of HIV/AIDS patients who started on ART using joint modeling with longitudinal random effects sub-model and a Cox proportional hazard sub-model. Also we have compared the results of the joint model with those obtained from separate analyses of the longitudinal and survival data. The joint analysis has established significant dependence of the hazard of loss to follow up from ART treatment on the rate of change in CD4 counts, apart from the patient’s baseline CD4 count. So, in clinical perspective, the trajectory of the CD4 count of patients undergoing ART treatment can prove to be a vital indicator about the risk of losing them to follow up. This knowledge becomes very crucial for devising methods to minimize morbidity and mortality rates due to HIV/AIDS condition as loss to follow up is expected to result in magnified exposure to serious risks in patients. Although, the parameter estimates of both the separate analysis and the joint analysis are consistent, a considerable amount of difference is apparent between their values, possibly due to the model correction accounting for the correlation between the longitudinal CD4 counts and the time to loss to follow up from the ART treatment. To our knowledge, there is a dearth of literature that highlights the problems of loss to follow up among HIV/AIDS infected patients started on ART treatment in India. Gerardo Alvarez-Uria et al. 2013 [23], have described the predictors associated with loss to follow up in HIV infected patients in a large cohort study in Anantapur, Andhra Pradesh, India. In this study, they have reported 10.3% loss to follow up during their study period, which is slightly higher than that of our data. Dalal et al. (2008) [27] and Geng et al. (2008) [28] have reported high proportion of patients lost to follow during the course of ART Treatment in resource-limited settings in South Africa and Africa respectively. While predictors like mode of transmission, location status and weight at the start of ART, even being significant predictors of loss to follow up, cannot be controlled or improved upon during the course of ART, alcohol addiction can be dealt with by introducing a dedicated consultancy programme as a part of the ART. Since the risk of loss to follow up increases by around 2.036 times for alcoholic patients, curbing this addiction can significantly reduce the risk of losing the patients during the course of ART. Migration might also be one of the important factors that could increase the risk of loss to follow up from ART programme (Bygrave et al., 2010) [31]. There are many studies which have supported joint modeling of longitudinal data and survival time to the event process over separate modeling [1, 8], which has been again emphasized upon by the results of our study which has shown a very significant association between the longitudinal trajectory of the CD4 count and the time to event.The previous studies have claimed that the patients having low socioeconomic status and those who are illiterate are significantly associated with loss to follow up from the treatment. In this study we were not able to capture these two important predictors in our model. Presence of opportunistic infections including TB and the nature of ART initial regimen are some other important factors which can have significant effect on the event of loss to follow up and can be included in the joint model set up for further analysis. The travel time and travel costs can also be major impediments for HIV patients to come to the clinics [29, 30], supporting the current policy of decentralization of ART centres by the Government of India.Moreover, we have used only one ART centre data for analysis that may not be representative for the whole country. Considering the socioeconomic diversity of India, our results need to be substantiated by similar survival studies from other parts of India to conjure up a comprehensive picture of HIV/AIDS epidemiology in India.
5. Conclusions
- In conclusion, the retention of patients in HIV-care is still a great challenge and the trajectory of CD4 cell count promises to be a crucial factor in predicting the event of loss to follow up. Also, joint models give a proper platform to study such situations where the association of longitudinal data with the time to event has utmost importance. So, joint model should be preferred over separate models for longitudinal and survival data analysis.