Abidoye A. O., Jolayemi E. T., Sanni O. O. M., Oyejola B. A.
Department of Statistics, University of Ilorin, Ilorin, Nigeria
Correspondence to: Abidoye A. O., Department of Statistics, University of Ilorin, Ilorin, Nigeria.
| Email: |  |
Copyright © 2015 Scientific & Academic Publishing. All Rights Reserved.
Abstract
Comparison of mean measurements coming from various sources (groups) often is hampered or made difficult by the associated variances not being identical. This is particularly common, for example, in pharmaceutical products where various generic products exist and products have variances that are group dependent. In this work, the use of harmonic mean of sample variances is demonstrated using Analysis of Variances (ANOVA) methodology that removes the associated Behren’s – Fisher’s problem. The result shows that the modified F – test statistic is found to be appropriate for the data set obtained from the specific example considered in demonstrating the use of the test procedure.
Keywords:
Ordered alternative, Modified F – test statistic, Variances heterogeneity, Harmonic mean of variances
Cite this paper: Abidoye A. O., Jolayemi E. T., Sanni O. O. M., Oyejola B. A., On Application of Modified F – Statistic: An Example of Sales Distribution of Pharmaceutical Drugs, International Journal of Statistics and Applications, Vol. 5 No. 2, 2015, pp. 68-71. doi: 10.5923/j.statistics.20150502.03.
1. Introduction
Analysis of variance is one of the most popular models in statistics in which interest may be mainly in testing the homogeneity of the different group means using the classical Analysis of variance (ANOVA). In many practical situations the standard assumption of homogeneity of error variances are often violated. In general, ANOVA assumes that the sample data sets have been drawn from populations that have normal distributions. One – way or more complex analysis of variance usually evaluates the effect of a factor (s) on a single response variable. For example, a pharmaceutical industry may be interested in comparing a newly introduced product into the market for treating a particular ailment e.g Drugs use for controlling Blood pressure in patients with high blood pressure.To satisfy the assumptions, the sales of drugs are randomly monitored in some wholesale pharmaceutical shops, the value of the sales for the shops for each sampled within a given period. The observations can be assumed to have the normal distribution having variances that are group dependent. see Ott, 1984 and Abidoye et al (2014).The analysis of variance supports unequal sample sizes. This is important because designers of experiments seldom have complete control over the ultimate sample sizes in their studies. Each of the factors (products) must have at least two or more readings or sample observations. However, it is recommended that the error degrees of freedom should not be below ten (10).The conventional analysis of variance (ANOVA) is usually based on the assumption of normality, independence of errors and equality of the error variances. Past studies have shown that the F – test is not robust under the violation of equal error variances, especially if the sample sizes are not equal and some authors have developed an exact Analysis of variance for testing the means of independent normal populations by using one or two stage procedures. See Jonckhere (1954), Abidoye et. al (2013a), (2013b), (2013c), Barlow et al (1971), Dunnett (1980), Dunnett and Tamhane (1997), Gupta et al (2006) Behren – Fisher’s problem is one of the notable complications that arise in this regard. The hypothesis of homogeneity of means is to be tested. In some medicine researches where the interest is to investigate the effectiveness of certain brands of a drug meant for a particular ailment , there might be a pre- conceived belief that certain drug (s) are more effective than others. Thus, if  where, i = 1, 2, …, h represents the mean measurement of ith brand of drug, the test hypothesis here would be of the ordered type given above. See Barlow et al (1971), Dunnett (1980), Dunnett and Tamhane (1997), Gupta et al (2006) and Abidoye et. al (2013a), (2013b), (2013c).In some instances, however, it may be of interest to investigate the claim that some drugs perform better than others. Hence, in an attempt to compare these differing performances, we resort to the use of hypothesis against non - directional alternative. See Abidoye 2012, Yahya and Jolayemi (2003), Ott (1984), Montgomery (1981), Jonckheere (1954) and Bartholomew (1959).
2. Development of the Test Procedure
The One – way analysis of variance (ANOVA) model equation is: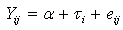 where
where  is the jth observation for the ith drug
  is a constant value
  is the effect of ith drug.
  j = 1, 2, …,ni .We are interested in developing a suitable test procedure to test the hypothesis:
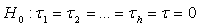 against the alternative
 | (2.1) |
as demonstrated in Abidoye et. al (2014)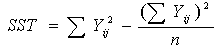 | (2.2) |
 | (2.3) |
 | (2.4) |
 | (2.5) |
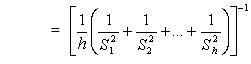
where  is the sample variance of the ith group.
  has been shown to have the
  distribution with r degrees of freedom (not necessary an integer) and is given by r = 22.096 + 0.266(n-h) - 0.000029
 See Abidoye (2012) and Abidoye et. al 2013a.
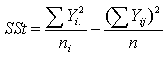
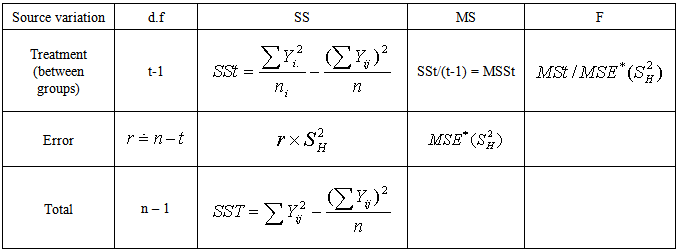
  is likened to the common MSE as defined in one- way Analysis of variance (ANOVA). It is a stabilized “pooled” variance, unaffected seriously by some outliers in group variances. The one – way ANOVA is presented in Table 2.1 below. In Table 1 the sum of squares between groups and adjusted sum of squares do not necessarily sum to total sum of squares. Analysis of Variance Table
Table 2.1. One – way analysis of variance with unequal group variances
 |
| |
|
Simulation study show that without any loss of generality, nearest integer values can be used to approximate the r degrees of freedom.
3. Application of the Test Procedure
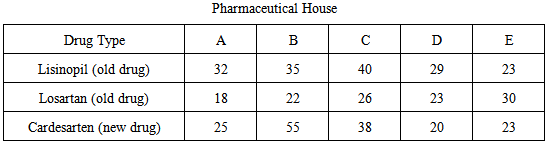
The data used in this study considered three drugs in use for treatment of Blood pressure (hypertension). The data used is a secondary data, collected from pharmaceutical premises in Ilorin, Kwara State, covering the period of six months ( April to September, 2014). Table 3.1. Wholesales of three drugs in five pharmaceutical companies in Ilorin, Kwara State, covering the same period
 |
| |
|
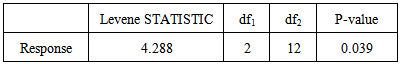
We need to verify the equality of the variances between these three drugs. This is shown in Table 3.2 using Levene’s test. Thus the group variances cannot be assumed equal (P = 0.039). Thus the regular ANOVA procedure can not be implemented. testing the hypothesisTable 3.2. Levene test for equality of variances
 |
| |
|
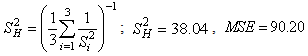
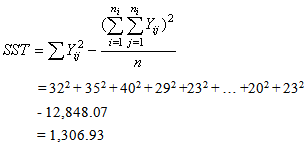
Computation on Sales of Data on Blood Pressure From the data set on sales of drugs for treatment of hypertension, the following summary statistics were obtained:Lisinopil: 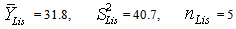 Losartan:
 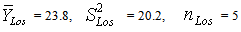 Cardesarten:
 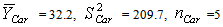 In the above, data set, ni = 5, h = 3,
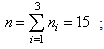
 The main hypothesis is
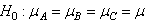


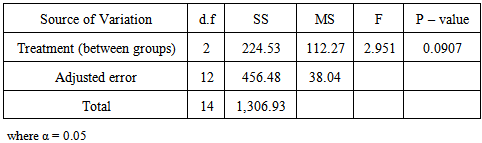
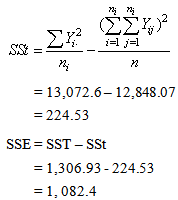 Note that F- statistic using equal group variances produced the p – value of 0.323 which is higher than the one in the modified F – statistic obtained from harmonic mean of sample variances, showing that regular ANOVA test is conservative even though the same conclusion is obtained here.Analysis of variance shows that the three drugs used for high blood pressure collected from some pharmaceutical premises in Ilorin, Kwara State are not significantly different.
Table 3.3. Analysis of Variance Table (ANOVA)
 |
| |
|
4. Conclusions
In this work, we examined a test statistic for testing equality of means under unequal population variances in a comparative drug experiment. We adopted the proposed modified F – test statistic, where the harmonic mean of variances replaced the sample pooled variance in order to avoid the Beheren – Fisher’s problem. Because the sample harmonic mean of variances has the chi – square distribution, the modified F –test is found to be appropriate for the data set used on the sale of hypertensive drugs. We can therefore conclude that the new drug (cardesartan) compete favourably well with the existing drugs for the treatment of Blood pressure (BP) as recommended by the caregivers.
References
| [1] | Abidoye, A. O (2012): Development of Hypothesis Testing Technique for Ordered Alternatives under heterogeneous variances. Unpublished Ph.D Thesis submitted to Dept. of Statistics, University of Ilorin, Ilorin. |
| [2] | Abidoye, A.O, Jolayemi, E.T, Sanni, O.O.M and Oyejola, B.A (2013a): On Hypothesis Testing Under Unequal Group Variances: The Use of the Harmonic variance.The International Journal of Institute for science, Technology and Education. Vol. 3, No 7, Page 11 – 15. |
| [3] | Abidoye, A.O, Jolayemi, E.T, Sanni, O.O.M and Oyejola, B.A (2013b): Development of a Test statistic for Testing Equality of Two Means Under Unequal Population Variances. The International Journal of Institute for science, Technology and Education. Vol. 3, No 10, page 10 -14. |
| [4] | Abidoye, A.O, Jolayemi, E.T, Sanni, O.O.M and Oyejola, B.A (2013c): Development of a Test Statistic for Testing Equality of Means Under Unequal Population Variances. The International Journal of Mathematics and Statistics Invention. Vol. 1, page 38 -43. |
| [5] | Abidoye, A.O, Jolayemi, E.T, Sanni, O.O.M and Oyejola, B.A (2014): On the Use of Analysis of Variance Under Unequal group Variances. International Journal of Mathematics and Statistics Invention. Vol. 2, page 7 – 10. |
| [6] | Barlow, R.E, Bartholomew, D.J, Bremmer,J.M and Brunk, H.D (1971): “Statistical Inference under Order Restrictions: The Theory and Application of Isotonic Regression.” Wiley, New York. |
| [7] | Bartholomew, D.J (1959): “A test of homogeneity for ordered alternative.” Biometrica, 46, 3648. |
| [8] | Dunnett, C. W and Tamhane, A. C (1997): Multiple testing to establish superiority / equivalence of a new treatment compare with k standard treatments. Statistics in Medicine 16, 2489 – 2506. |
| [9] | Dunnett, C.W (1980): “Pairwise multiple comparison in the homogeneous variance, unequal sample size case” Journal of the American Statistical Association. 75, 789 – 795. |
| [10] | Gupta, A.K, Solomon, W.H and Yasunori, F (2006): Asymptotics for testing hypothesis In some Multivariate variance components model Under non-normality. Journal of Multivariate Analysis archive. Vol. 97, pp 148-178. |
| [11] | Jonckheere, A.R (1954): “A distribution-free k-sample test against ordered alternative.” Biometrical, 41, 133-145. |
| [12] | Montgomery, D.C (1981): “Design and Analysis of Experiment.” Second Edition. John Wiley and sons Inc. New York. |
| [13] | Ott, L (1984): “An Introduction To Statistical Methods and Data Analysis”. Second edition. P.W.S Publisher. Boston. |
| [14] | Yahya, W.B and Jolayemi, E.T (2003): Testing Ordered Means against a Control. JNSA,16, 40-51. |
 Abstract
 Reference
 Full-Text PDF
 Full-text HTML