-
Paper Information
- Previous Paper
- Paper Submission
-
Journal Information
- About This Journal
- Editorial Board
- Current Issue
- Archive
- Author Guidelines
- Contact Us
International Journal of Statistics and Applications
p-ISSN: 2168-5193 e-ISSN: 2168-5215
2015; 5(2): 56-67
doi:10.5923/j.statistics.20150502.02
Efficiency of Higher Education in Turkey: A Bootstrapped Two-Stage DEA Approach1
 Abstract
 Reference
 Full-Text PDF
 Full-text HTML
Sibel Selim 1, Sibel Aybarç Bursalıoğlu 2
1Department of Econometrics, Faculty of Economics and Administrative Sciences, Celal Bayar University, Manisa, Turkey
2Department of Accounting & Tax Applications, Ahmetli Vocational High School, Celal Bayar University, Manisa, Turkey
Correspondence to: Sibel Selim , Department of Econometrics, Faculty of Economics and Administrative Sciences, Celal Bayar University, Manisa, Turkey.
| Email: |  |
Copyright © 2015 Scientific & Academic Publishing. All Rights Reserved.
The purpose of higher education is to provide training for individuals based on contemporary teaching methods, to meet the needs of the nation and country in the fields of training and education, scientific research, press and consulting services. For this purpose, the role of higher education institutions is great. Higher education institutions that shape today's information society are an important actor in providing economic development and growth, and competitive advantage to countries in the international arena, as well as in providing prestige and high level of income to individuals. In this regard, efficiency of higher education institutions in academic and research activities and investigating the factors that determine the efficiency are also important. Aim of this paper is to deal a two- stage data envelopment analysis for 51 public universities in Turkey in 2006-2010. The first stage is concerned with data envelopment analysis to measure the bootstrapped efficiency of the universities. This is followed by factors that affect the efficiency of the universities random effects Tobit model in the second stage. The results of the model demonstrate that, Turkish public universities are efficiency 37% in 2006, 39% in 2007, 47% in 2008, 35% in 2009, 37% in 2010. Also, number of female student has a positive and important effect on relative efficiency of universities in Turkey.
Keywords: Efficiency in higher education, Two-Stage DEA Approach, Bootstrapping, Panel Tobit model, Turkey
Cite this paper: Sibel Selim , Sibel Aybarç Bursalıoğlu , Efficiency of Higher Education in Turkey: A Bootstrapped Two-Stage DEA Approach1, International Journal of Statistics and Applications, Vol. 5 No. 2, 2015, pp. 56-67. doi: 10.5923/j.statistics.20150502.02.
Article Outline
1. Introduction
- Universities can be defined as institutions offering education and training, conducting scientific research and publishing such studies [1]. It has been observed that the concepts of university and higher education have sometimes been given separate meanings, but sometimes been put into the same framework in terms of their primary aims and functions. However, the common point in all of these different definitions is that higher education is an education level encompassing universities, academies and other schools of higher education. For this reason, it does not seem possible to separate higher education and universities form one another with definite lines [2], [1]. The purpose of higher education is to provide training for individuals based on contemporary teaching methods, to meet the needs of the nation and country in the fields of training and education, scientific research, press and consulting services. For this purpose, the role of higher education institutions is great. Higher education institutions that shape today's information society are an important actor in providing economic development and growth, and competitive advantage to countries in the international arena, as well as in providing prestige and high level of income to individuals.In this regard, efficiency of higher education institutions in academic and research activities and investigating the factors that determine the efficiency are also important.All universities and schools of higher education are affiliated to the Higher Education Council established in 1981 in Turkey. The Council is an autonomous public juridical body with the authority and responsibility to administer the activities of all institutions of higher education [3]. With over 3 million students currently enrolled at university or following distance education courses, Turkey currently has a mass higher education system. Over the last ten years, in order to facilitate student access throughout the country, the main objective of higher education policy has been to increase the number of universities. Consequently, 50 new public universities and 36 non-profit foundation universities were founded between 2006 and 2011 [4].The paper contributes to the literature public universities in Turkey by estimating the relative efficiency and the factors that affect the relative efficiency through a bootstrapped two-stage DEA approach in 2006-2010. The research literature on Turkish public universities’ relative efficiency is very limited. To our knowledge, no systematic empirical research exists in analysing the efficiency of 51 public universities in Turkey using a bootstrapped two-stage DEA approach. However, this study presents a comprehensive analysis for the 51 public universities with bootstrapped two-stage DEA and provides important findings on the determinants of public universities’ efficiency with panel Tobit model in Turkey. The number of students graduating who are employed is the most important variable for the efficiency of a university. For the first time, the number of students graduating who are employed is used in this study. The remainder of this study is organized as follows. Section 1 presents higher education system in Turkey. Section 2 presents literature review. Section 3 presents the methods employed in getting the results. Section 4 is devoted to presentation of the data and variables used. The results obtained from the two-stage DEA approach are presented in Section 5. Finally, conclusions are drawn in Section 6.
2. Higher Education System in Turkey
- In the history of our higher education, the departure from medresseh education and moving towards first secular education institutions happened in 1773. In this year, Mühendishane-i Bahr-i Hümayun and in successive years Mühendishane-i Berr-i Hümayun were founded in İstanbul. In 1827, School of Medicine and in 1834 War Academy was established. In the Ottoman Empire period, the establishment of Darülfünun could only be realized in 1863 ([5]; [1]). In order to achieve the objectives of the new republic in terms of the modernization of education, different models of university systems from the West were taken as models rather than simply improving already available “madrasah” system. Initiated with the establishment of Dar-ül Fünun in 1900, the historical development of Turkish Universities continued with the foundation of new universities and faculties in Ankara and İstanbul until 1950s and, later, in different cities located in Anatolian part of Turkey. During this period, Turkey and France shared the third place in the rank among OECD countries in terms of the annual rate of establishing new schools [6]. Within the period from 1960 to 1973, in other words, until the enactment of Law no. 1750, changes in the higher education system continued. In this scope, the main issues attracting the attention of public about education were the establishment of private higher education institutions in accordance with the Law no. 625 named “Private Higher Education Institutions Law” and the closure of such institutions according to the decision of the Constitutional Court.In 1981, with the passage of the basic Law on Higher Education (Law No. 2547) higher education in Turkey was comprehensively reorganized. The system thereby has gained a centralized structure, with all higher education institutions tied to the Council of Higher Education [7]. With the Law no. 2547, Turkish higher education system was regulated based on the principle of integrity and a new content for the system was introduced. After this restructuring, all institutions of higher education were designed as universities. Expansion of higher education throughout the country was achieved, application to higher education was centralized, and a central university exam and placement were introduced. In addition to public universities, the first non-profit foundation university in Turkey started to provide education for students in 1986. The Council of Higher Education has 21 members (Figure 1): One third of its members are directly appointed by the President of the Republic of Turkey consisting of former rectors and academic staff; one third are selected by the Council of Ministers (Cabinet) from among distinguished, high ranking civil servants; one third are selected by the Inter-University Council from among professors who are not members of that Council. The selections of members by the Council of Ministers and the Inter-University Council are subject to approval by the President of the Turkish Republic. Each member is appointed for a renewable term of four years. The President of the Council is appointed by the President of the Republic of Turkey from among the Council members. Nine members of the Council are elected to an Executive Board to carry out day-to-day functions of the Council. Members of the Executive Board are appointed on a full-time basis [8].
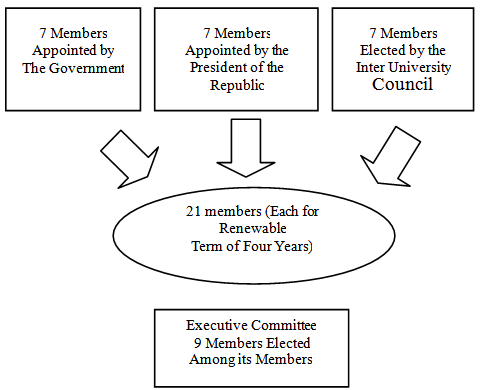 | Figure 1. Council of Higher Education in Turkey (CoHE) |
3. Literature Review
- Several studies have been conducted on the topic of relative efficiency of the universities. In this research, we focus on the researches that deal with efficiency and data envelopment analysis. Among them, Kempkes and Pohl [9], analyze the efficiency of 72 public German universities for the years 1998-2003, applying data envelopment analysis and stochastic frontier analysis. Contrary to earlier studies they account for the faculty composition of universities, which proves to be an essential element in the efficiency of higher education. Their main finding is that East German universities have performed better in total factor productivity change compared to those in West Germany. Aubyn et al. [10] studied by comparing used resources with education and research outputs and outcomes in the EU Member States are. Efficiency in public tertiary education systems across EU countries plus Japan and the US is assessed with semi-parametric methods and stochastic frontier analysis. Agasisti [11] aims an efficiency analysis concerning higher education systems in European countries. Data have been extracted from OECD data‐sets (Education at a Glance, several years), using a nonparametric technique – data envelopment analysis – to calculate efficiency scores. This paper represents the first attempt to conduct such an efficiency analysis at a system level in a cross-country comparison, while focusing only on tertiary education. The role of the public sector has also been analyzed, by looking at the percentage of public spending devoted to higher education. Toth [12] use DEA to compare the efficiency of higher education systems. The study examines whether their efficiency is influenced by the extent of the contribution of the state and the private sector or socio-economic factors like GDP per capita and education level of parents. Denaux et al. [13] analyzes public high school efficiency, defined as maximum level of educational attainment obtained with a given level of school inputs in the State Georgia. Using DEA, urban and rural public high school efficiency differences are evaluated using a two-step estimation process. Daghbashyan [14] investigates the economic efficiency of higher education institutions (HEI) in Sweden to determine the factors that cause efficiency differences. Stochastic frontier analysis is utilized to estimate the economic efficiency of 30 HEI using both pooled and panel data approaches. Merkert and Hensher [15] aim to evaluate key determinants of 58 passenger airlines’ efficiency. This paper applies a two-stage DEA approach, with partially bootstrapped random effects Tobit regressions in the second stage. Their results suggest that the effects of route optimization, in the sense of average stage length of the fleet, are limited to airline technical efficiency. Bifulco and Bretschneider [16] deal with performance-based school reform efforts. This study uses simulated data to assess the adequacy of two such methods, Data Envelopment Analysis and Corrected Ordinary Least Squares, for the purposes of performance-based school reform. Their results suggest that in complex data sets typical of education contexts simple versions of Data Envelopment Analysis and Corrected Ordinary Least Squares do not provide adequate measures of efficiency. Wang and Huang [17] apply the production framework associated with the data envelopment analysis method to evaluate the relative efficiency of R&D activities across countries. A three-stage approach, which involves using DEA for evaluating efficiency and using Tobit regressions for controlling the external environment, is applied to 30 countries in recent years. The results show that less than one-half of the countries are fully efficient in R&D activities. Bradley et al. [18] calculate the technical efficiencies, based upon multiple outputs-school exam performance and attendance rates- of all secondary schools in England over the period 1993-1998. Their results suggest that the greater the degree of competition between schools the more efficient they are. Hoff [19] presents two alternative approaches to second stage DEA, the results of which are compared with the Tobit approach through a case study for the Danish fishery. The three models are compared to OLS regression, representing a linear approximation to the models. McDonald [20] examines second stage DEA efficiency analyses, within the context of a censoring data generating process (DGP) and a fractional data DGP.Afonso and Aubyn [21] analyze the efficiency of expenditure in education provision among the educational systems of 25 countries with DEA. By regressing DEA output scores on non-discretionary variables, both using Tobit and a single and double bootstrap procedure, they find that inefficiency is strongly related to GDP per head and adult educational attainment. Alexander et al. [22] analyze the efficiency of New Zealand secondary schools with a two stage DEA and Simar-Wilson's double bootstrap procedure, which permits valid inference in the presence of unknown serial correlation in the efficiency scores. Their most important finding is that school type affects school efficiency and so too does teacher quality. Wolszczak-Derlacz and Parteka [23] analyze the efficiency of 259 public HEIs from 7 European countries (Austria, Finland, Germany, Italy, Poland, Switzerland, United Kingdom) over the years 2001-2005, using two-stage DEA (DEA and bootstrapped truncated regression). Their results indicate that a higher share of funds from external sources and a higher number of women among academic staff improve the efficiency of the HEIs. Cai and Hanley [24] use DEA and Tobit regression to determine the R&D efficiency in BRICS countries (Brazil, Russia, India, China, South Africa) and 17 non-BRICS countries. Their results indicate how innovation responds favorably to private-sector R&D. Miningou and Vierstraete [25] use DEA with bootstrap procedures to assess the efficiency with which basic education is provided throughout the 45 provinces of Burkina Faso. When they used the Simar and Wilson [26] procedure in order to explain inefficiency scores, they found that household's living situation can explain efficiency in primary education provision.Al-Baugoury [27] investigates the efficiency of African higher education systems in fifteen countries using DEA and Tobit regression. The results of analysis indicate the most influential factors affecting efficiency are the growth rate, private share and public expenditure on higher education. Simar and Wilson [26] propose single and double bootstrap procedures for DEA; both permit valid inference, and the double bootstrap procedure improves statistical efficiency in the second-stage regression. They examine the statistical performance of their estimators using Monte Carlo experiments. This paper describes a DGP that is logically consistent with regression of nonparametric, DEA efficiency estimates on some covariates in a second stage. In addition, we demonstrate that while conventional inference methods are inconsistent in the second-stage regression, consistent inference is both possible and feasible. Simar and Wilson [28], examines the wide-spread practice where data envelopment analysis (DEA) efficiency estimates are regressed on some environmental variables in a second- stage analysis. Their paper examines, compares, and contrasts the very different assumptions underlying these two models, and makes clear that second-stage OLS estimation is consistent only under very pecu-liar and unusual assumptions on the data-generating process that limit its applicability. In addition, we show that in either case, bootstrap methods provide the only feasible means for inference in the second stage. We also comment on ad hoc specifications of second-stage regression equations that ignore the part of the data-generating process that yields data used to obtain the initial DEA estimates.
4. Two- Stage Data Envelopment Approach
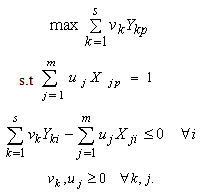
- There are various ways to measure technical efficiency. While DEA using linear programming constructs the efficiency frontier with the best performing farms of the sample, parametric methods rely on specifying a production function and estimating its parameters with econometrics. We use DEA approach since it is more suitable in terms of our data used in the analysis and the obtained results.Following Farrell [29], Charnes et al. [30] first introduced the term, DEA to describe what is a mathematical programming approach to the construction of production frontiers and the measurement of efficiency of the constructed frontiers [31]. DEA is receiving increasing importance as a tool for evaluating and improving the performance of manufacturing and service operations. It has been extensively applied in performance evaluation and benchmarking of schools, hospitals, bank branches, production plants, etc. [32]. The relative performance of a university in this study is defined as the ratio of the weighted sum of its outputs to the weighted sum of its inputs. Generally, a DEA production frontier can be operationalised non-parametrically either with an input or output orientation, under the alternative assumptions of constant returns to scale (CRS) or variable returns to scale (VRS) [15]. Within the family of the DEA models, the one initially proposed by Charnes et al. [30], is the model which points out differences among decision making units (DMUs) in most critical way. Some of the subsequent models, notably the one introduced by [33], incorporate some of the explanations to efficiency differences into the models themselves. BCC model takes into account the effect of “variable returns to scale” within the analyzed group of DMUs, while CCR model takes into accounts the effect of “constant returns to scale” [34]. The DEA method can be input or output orientated, of which the former determines the minimum input for which the observed production of the ith DMUs is possible, while the latter determines the maximum output of the ith DMU given the observed inputs [19]. This paper uses an output-oriented function.DEA determines the efficiencies of individual DMUs within a group relative to the other DMUs in the group. The most efficient DMUs constitute the efficient frontier of the group, relative to which the efficiencies of the remaining DMUs are measured. The frontier is non-parametric, i.e. no functional form needs to be specified, in contrast to stochastic production frontiers (SPF) [19]. DEA overcomes this problem by allowing each DMU to choose the vectors of the input and output weights, which maximize its own ratio of weighted output to weighted input, subject to the constraint that the weight vectors chosen by the ith DMU should not allow any DMU to achieve a ratio of weighted output to weighted input in excess of unity. Thus, each DMU is judged according to standards set by itself [17].Assuming that there are n DMUs, each with m inputs and s outputs, the relative efficiency score of a test DMU p is obtained by solving the following model proposed by [30]:
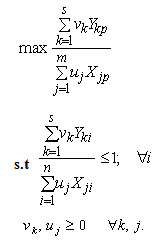 | (1) |
 | (2) |
 | (3) |
 | (4) |
 | (5) |
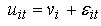
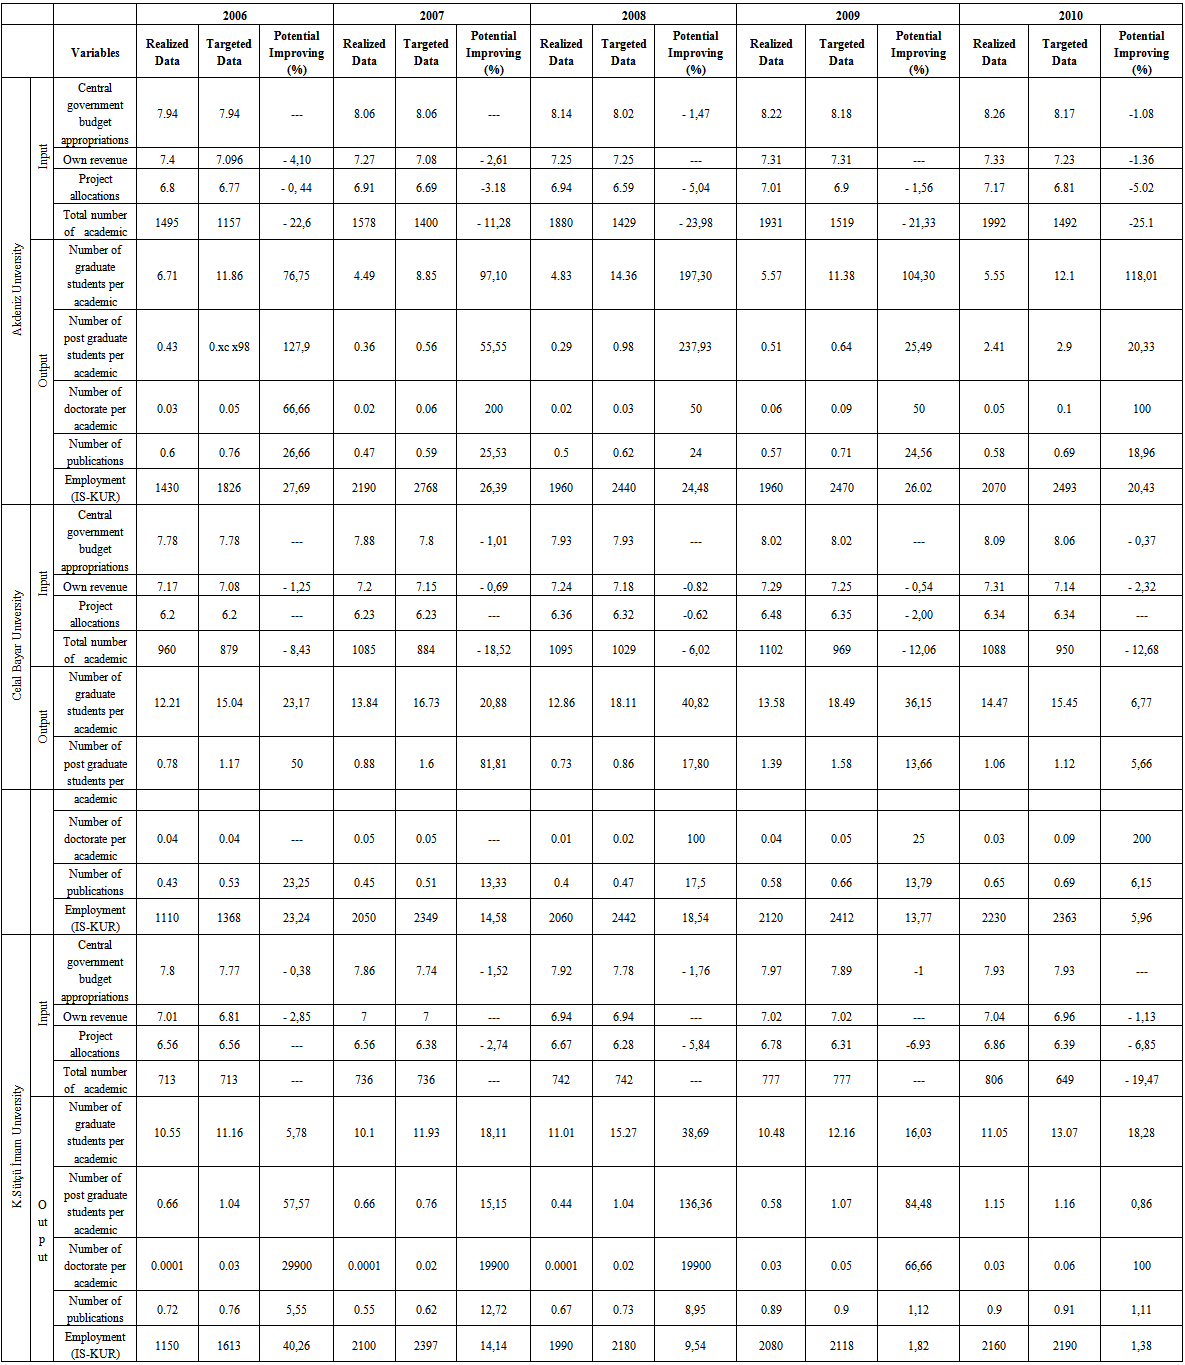
 in equation (2) could be freely correlated over time. Here we consider the error components model which splits the error
  into a time-invariant individual random effect (RE):
  and a time-varying idiosyncratic random error:
  ([36]; [37]).This paper builds on a two- stage DEA to determine factors on the efficiency of universities in Turkey in 2006-2010. The first stage is concerned with bootstrapped DEA approaches to measure the efficiency of the universities (for details, see [26]). The bootstrap procedure consists in re-sampling the observational data for the calculated efficiency scores in the first stage (see [38]). This procedure was firstly proposed by Simar and Wilson [39] ([40]). According to Simar and Wilson [26] and Simar and Wilson [40], a two-stage approach results in inconsistent and biased parameter estimates (e.g. as a result of the dependence of the DEA efficiency scores on each other) unless the DEA efficiency scores are corrected by a bootstrapping procedure. This avoids the serial correlation problem of conventional two-stage DEA studies [15]. It allows us to estimate a robust regression model in the second-stage analysis in order to determine factors on the efficiency of universities in Turkey. Thus, we apply the bootstrapped two- stage DEA approach by performing repeated sampling in this study. Our bias-corrected scores are derived from 2000 bootstrapped iterations. We use the software package FEAR 1.15 in order to carry out the DEA estimations. FEAR is based on the statistical package R. For more details about two-stage DEA, see [26]; [28]; [38], [39] and [40].
5. The Data and Variables
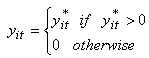
- The data employed in DEA in this study is derived from the CoHE, Employment Institution (EI), Measuring Selection and Placement Center (MSPC) and The Scientific and Technological Research Council of Turkey (TÜBİTAK). Based on a 5-year period (2006-2010) and 51 public universities, a panel dataset was constructed. The number of public universities in Turkey increased quantitatively in 1973-2008. We chose the 51 public universities which have been established before 2008 to reach the significant results.Analytical Budget Classification became law in 2004 and started to apply in 2006 in Turkey. So, we determine analysis period as 2006-2010 in this study. The other constraint of our analysis is impossible to reach the employment from MSPC and private sector. Therefore, we used employment data of the EI. They are presented in Table 1.
|
6. The Findings
6.1. The Results of the Bootstrapped DEA Approach
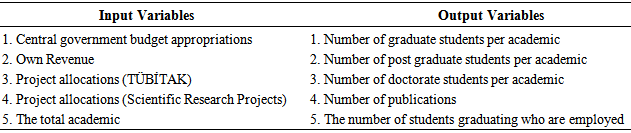
- DEA is used to estimate 51 public universities’ bootstrapped efficiency scores. This is a non-parametric technique that considers each public university as a DMU using inputs to produce outputs (in detail [41]). DEA mathematical formulation can deal with both constant returns to scale (CRS) and variable returns (VRS). In a CRS model, the single DMU’s dimension has no importance for defining efficiency performance. That is, DMUs have the same efficiency frontier independently of their relative size. The VRS results can be derived by introducing the dimension factor in DEA modeling. Each unit is analyzed with respect to another of the same relative size. Both CRS and VRS efficiency can be calculated for each unit [42]. In this paper, we used VRS formulation to take into account the different relative size of the public universities in Turkey.The DEA method can be input or output orientated. The output-oriented approach focuses on how high maximal output can be achieved with the same amount of resources. Tibenszkyné [43] states that the output-oriented approach is the appropriate one for higher education because the principle of cost minimization is not applied according to the market conditions [11]. In this paper, we used output-oriented approach to determine the output maximization of the public universities in Turkey. As it is seen, Data Envelopment Analysis with BCC Model (VRS surface) is chosen for analyzing 51 Turkish public universities in this study. The findings of the DEA analysis are given in Table 2.
|
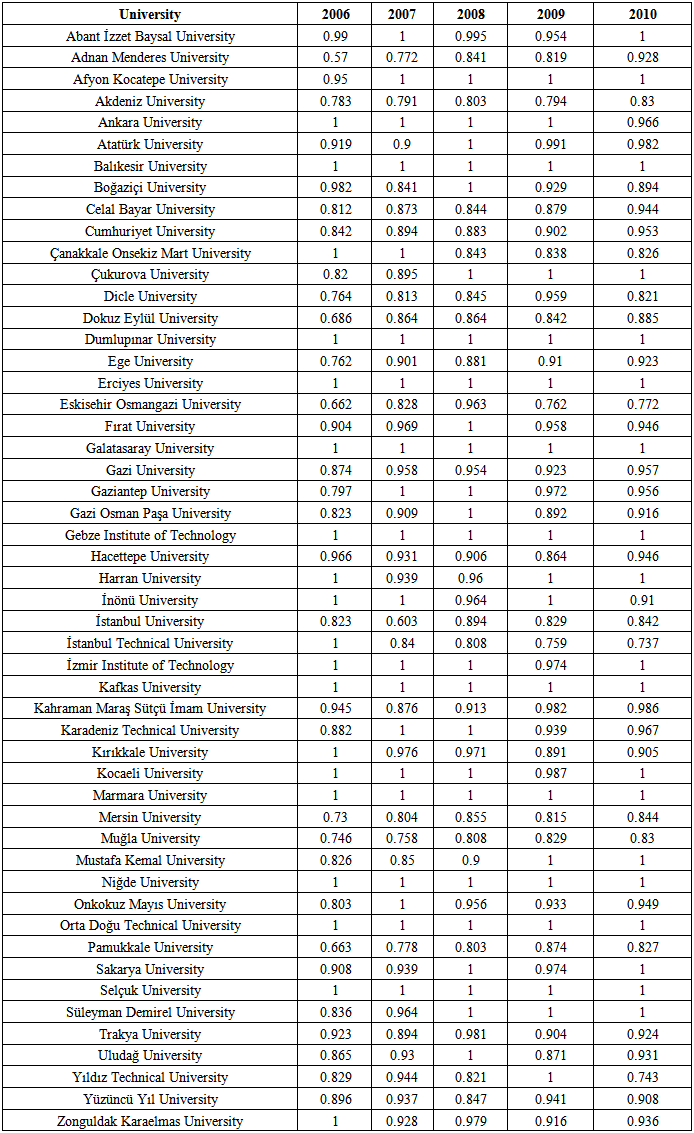
 | Table 3. The Potential Improving Rate for Some Inefficiency DMU |
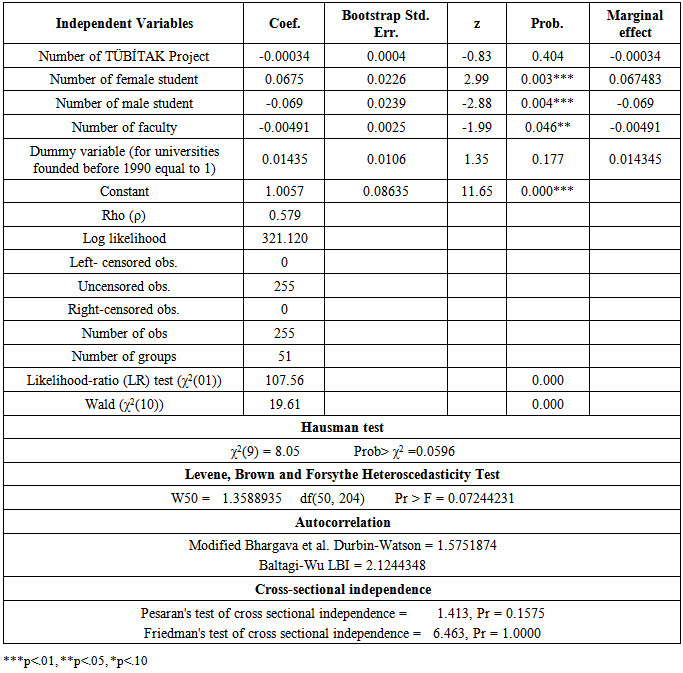
6.2. The Results of the Tobit Model with Random Effects
- Tobit model with random effects is used in the second part in this study. Estimated coefficients and marginal effects of the random effects Tobit model are presented in Table 4.
|
7. Discussion
- This paper builds on a two-stage DEA total efficiency approach to determine impact factors on 51 public universities efficiency in Turkey in 2006-2010. The DEA efficiency scores estimated in the first part of our study all lie in the 0-1 interval. Panel Tobit model is used in the second part in this study. Data Envelopment Analysis with BCC Model (VRS surface) is chosen for analyzing 51 Turkish public universities in this study. This analysis indicate that Turkish public universities are efficiency 37% in 2006, 39% in 2007, 47% in 2008, 35% in 2009, 37% in 2010. Balikesir University, Dumlupınar University, Erciyes University, Galatasaray University, Gebze Institute of Technology, Kafkas University, Marmara University, Niğde University, Middle East Technical University, Selçuk University are efficiency during the 2006-2010. Efficiency score of the other universities vary from year to year. Potential improving rate was created as an example only three universities (Akdeniz University, Celal Bayar University and K. Sütçü İmam University). Ordinary Least Square is not an appropriate method to determine factors on the efficiency of public universities in Turkey because of the nature of the dependent variable. The observed dependent variable may either be zero or positive. The data are censored in the lower tail of the distribution. Therefore Panel Tobit model is used in this study. The marginal effect results of the Tobit model with random effects demonstrate that, the effect of number of TÜBİTAK Project and the dummy variable representing universities established before 1990 and after 1990 found to be insignificant. Additionally, number of female student has a positive and important effect on relative efficiency of universities in Turkey. Number of male student, as expected, has a negative effect. Number of faculty has negative effect on efficiency. Due to the changing orientations in political and economic interests, the recent policies of Turkish higher education have been directed to European processes. The future policies and planning of Turkish higher education are now defined by European integration programmes and agreements. In order to become compatible with the European Higher Education Area, structural changes are required in curricula leading to the introduction of innovative teaching and learning processes as well as changes in legislation [44].
Note
- 1. An earlier version of this paper was presented at the 2nd Cyprus International Conference on Educational Research, (CY-ICER 2013)