Timothy Adampah 1, Derek Ngbandor Nawumbeni 2, Sylvester Dodzi Nyadanu 3, Ruth Polishuk 4
1MSc. Biometry-Department of Statistics, University for Development Studies, Ghana
2MSc. Applied Statistics- Department of Statistics, University for Development Studies, Ghana
3MSc. Health Informatics- Department of Computer Science and College of Health Sciences, Kwame Nkrumah University of Science and Technology, Ghana
4Nurse Practitioner- Richford Health Centre, Vermont, U.S.A
Correspondence to: Sylvester Dodzi Nyadanu , MSc. Health Informatics- Department of Computer Science and College of Health Sciences, Kwame Nkrumah University of Science and Technology, Ghana.
| Email: |  |
Copyright © 2015 Scientific & Academic Publishing. All Rights Reserved.
Abstract
This study seeks to obtain the best predictive model for a type 2 diabetes patients’ FBS level at the Diabetes Unit of Ketu-South Municipality of Ghana. A two year historical clinical data from the Diabetes Unit was used. Demographic data, and random variables: patients’ Fasting Blood Sugar (FBS) level, Body weight (BW) and Blood Pressure (BP) (systolic/diastolic) were monitored retrospectively every month. Mixed effects model for longitudinal data analysis approach was used. This approach had the added advantages of observing changes more accurately by increasing the power and validity of measuring the changes in FBS level. The analysis revealed cubic distribution trend in the mean FBS level of the patients, accounting for 91% of the variability in the data. The cubic trend implies that the FBS level fluctuates. Variance component was the fitted variance-covariance structure model for the mixed-effect regression model. Using a stepwise selection approach for the final model building, it was shown that the duration of treatment (time), weight, educational level, blood pressures (systolic and diastolic) significantly affect the FBS level. It is therefore recommended that upon further researches, the two linear regression prediction models viz. the reduced mixed-effect and trend models be encouraged and developed for healthcare providers, for strategic intervention and management of diabetes.
Keywords:
FBS level, Longitudinal Analysis, Variance Component, Body Weight and Blood Pressure
Cite this paper: Timothy Adampah , Derek Ngbandor Nawumbeni , Sylvester Dodzi Nyadanu , Ruth Polishuk , Mixed-Effects Model for Longitudinal Study of Type-2-Diabetes, International Journal of Statistics and Applications, Vol. 5 No. 2, 2015, pp. 47-55. doi: 10.5923/j.statistics.20150502.01.
1. Background
Although diabetes was thought to be rare in sub-Saharan Africa, recent studies from some countries suggests that the disease may now be more common in sub-Saharan Africa than previously thought (Cooper et al., 1997, Mbanya et al., 1997, Aspray et al., 2000). Evidence suggests that environmental factors are major determinants of the increasing rates of diabetes (WHO, 1999). Overweight and obesity are increasing dramatically and contribute to the burden of diabetes mellitus and other chronic health conditions. Indeed, the modern environment and sedentary lifestyles promotes the risk factors that cause diabetes. The identified risk factors are classified as non-modifiable and modifiable. Age, family history and ethnicity are the main non-modifiable determinants of diabetes prevalence in Africa. Among the modifiable risk factors, obesity, the environment and lifestyle seems to be major determinants, since urban residents have a 1.5 to 4-fold higher prevalence of diabetes compared to their rural counterpart (Gill et al., 1997). Kelley et al., (1993) also revealed that as weight loss progresses and is maintained, an improvement of glycaemia is evidenced by a reduction in glycosylated haemoglobin. Metcalf et al., (2014) conducted a cross-sectional survey of 461 type 2 diabetes mellitus patients to predict 10-year coronary heart disease (CHD).They used Framingham equation and a United Kingdom Prospective Diabetes Study (UKPDS) equation. It was deduced that Framingham CHD risk score tends to be lower than UKPDS scores primarily in people above standard thresholds for drug treatment. Spangler et al., (2013) evaluated the contribution of pre-existing diabetes prevalence to cancer mortality. Their findings supported the correlation between diabetes mellitus and cancer at the population level since diabetes explained 42% of the variance of total county level cancer mortality. Powers et al., (2008) also modelled the Effects of a Hypertension Self-Management Intervention on Diabetes and Cholesterol Control. This study used mixed effects models to compare changes in the HbA over time between two treatment groups (diabetes and LDL-C). The results showed a significant effect of self-management intervention on the unintended target of HbA, but not LDL-C. Irving et al., (2002) computed Insulin resistance using the Homeostasis Model Assessment (HOMA). They concluded that although association between hypertension and insulin resistance is unlikely to be explained by altered microvascular structure and function, changes in the microvasculature are found in subjects with early and subtle elevations in blood pressure or fasting plasma glucose in advance of their crossing conventional thresholds for the diagnosis of hypertension or diabetes mellitus. In Ghana, few works were done on diabetes but fitting models for prediction of FBS level is extremely limited in literature. Since diabetes is a lifestyle non-communicable disease, there cannot be a general model for all health facilities due to drastic changes in socio-demographic factors. However, each local facility can design its own predictive model to predict diabetes and monitor the performance of the diabetic treatment and management plans. This research seeks to unearth a model with a longitudinal study for reliable prediction of the FBS level of the patients and determine the factors that significantly affect the change in FBS level of patients on treatment using the medical records at the Ketu South diabetes clinic.
2. Materials and Methods
2.1. Data Used
Ketu South Municipal Hospital in Volta Region of Ghana is the only hospital in the municipality and at the Ghana-Togo border with diabetes clinic, serving both Ghanaians and Togolese along the southern border with diabetes. The study involved individuals who were clinically diagnosed of diabetes and put on therapeutic treatment at the Ketu South diabetes clinic from January 2012 to December 2013. The medical records of the diabetes patients within the stipulated study period were extracted from patients’ folder.
2.2. Data Collection Procedure
All the 105 type 2 diabetes (T2D) patients on treatment at the Ketu-South Municipal Hospital diabetes unit from January 2012 to December 2013 were followed retrospectively. The eligibility and inclusion criterion used was diabetes patients who were clinically and regularly reviewed at the diabetes clinic for at least 18 months out of the 24 months of the retrospective observation period. The inclusion criterion finally selected 80 eligible diabetes patients for the study. The outcome measures of the treatment of T2D extracted from the patients’ folder were the random variables Fasting Blood Sugar (FBS) level, Body Weight (BW), systolic and diastolic blood pressures(BP) and therapeutic regimen. The fixed demographic factors which include gender, marital status, educational level and religious affiliation were also obtained and used for the study.The random variables for this study included; FBS level, BW, BP and age of the patients on treatment were monitored monthly for 2 years. A total of 5,760 different observations of the continuous or random variables were expected but due to123 missing observations (2.1% missing data), an actual observation of 5,637 observations were recorded and used for the study. Dawson and Trapp, 2001 stated that the general rule of thumb for guidance recommends ten times as many subjects as the number of independent variables. In addition, to ensure that estimates of regression coefficients, R and R2 are accurate representatives of the actual population values. They also suggested that regression should not be performed unless at least five times as many subjects are included as there are independent variables Hence the sample size of 80 subjects with 5,637 observations in the study was statistically adequate for the regression modelling.
2.3. Statistical Analysis
2.3.1. Longitudinal Study
The data collected were entered into SPSS and then imported into STATA 12 format for analysis. The data was analysed at a time point of every three months to build the mixed-effect model. Generally, there are two different types of data that are measured overtime: time series and longitudinal data. This research wish to deal with the latter, in which there are small number of time points at which the individuals give responses and a large amount of data is measured at any given time point. Longitudinal data can be analysed using various different methods but the approach employed in this work was to fit linear mixed-effects (LME) model. This modelling approach is very flexible enough to account for the natural heterogeneity in the population, and can effectively handle drop-out and missing data. The longitudinal study analysis using STATA has imputation statistical approach to handle missing data (more accurately below 5%) by substituting some value especially the mean across all the subjects. It also takes into account within and between sources of variation.
2.3.2. Modelling Approaches
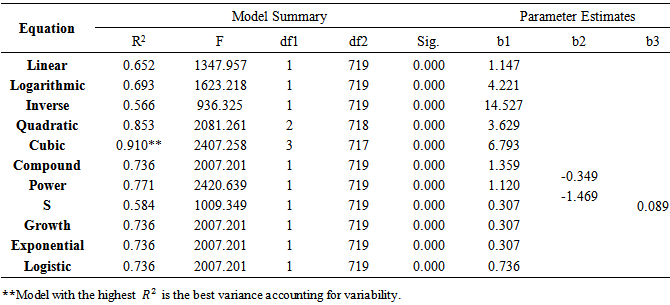
The normality of the data was checked by the normal Q-Q plot and further confirmed by the Shapiro-Wilks Test. The pattern of change in the FBS level with time was developed by regressing the time points over the change in FBS level. This gave the parameter estimates of the regression coefficients and  estimates of the trend of FBS level of patients on treatment. The model with the highest variability
  was selected and the trend of FBS level was fitted.Analysis of residuals was done to evaluate the fit of the regression equation and the trend model diagnosed using Shapiro-Wilk and ARCH-LM tests.The general structure for linear mixed-effects (LME) model is
 Where
Where 
 Fixed effects,
  Random effect for unit
 Between-unit covariance matrix
 Within-unit covariance matrix
 is an
is an  matrix with
  column, matrix
  is an
is an  matrix. Both
  and
and  depend on
  through
 Averaging over the distribution of the latent random effects
  the marginal (population-average) distribution of
  is
is Where
Where  If we take
  as random intercepts, then
  has compound symmetry. The elements of
  represent the effects of the variance in
  on the mean response, both for a single subject and on average for the population.The fixed parameter,
  for each predictor in this model, represents the average change in FBS level for a unit change in that predictor. For the modelling, the statistical analysis of the changes in FBS level of T2D (the response or dependent variable, yi) over time was done using linear mixed effects model adjusted for potential independent variables or predictors xi;BP, BW, age, gender, marital status, educational level, religious affiliation, drug regimen and time of follow-up.Hence the full model is
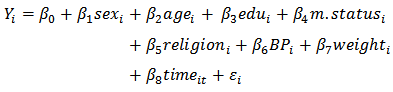 Where
Where  is a random-effect intercept that varies according to
  where the patient’s index t is the time.
  are fixed-effect parameters associated with the non-random predictors.The covariance structures analyses were done to fit the mixed-effects model. The co-variance and correlation matrix were estimated to determine which particular covariance model best fits the data. The Akaike's information criterion (AIC) and Bayesian Information Criterion (BIC) indices of relative goodness-of-fit were used to compare models with the same fixed effects but different covariance structures to justify the appropriate model selection. The model with the least AIC and BIC was the best and hence selected. The covariance structure selected reflects the correlation between successive FBS levels. To obtain the final reduced model, a stepwise multiple regression model building approach was used to include only variables that added to the prediction in statistically significant way. This provided the reduced mixed-effects model that requires less data collection for future application of the predictive model.
2.4. Ethical Consideration
Ethical approval was obtained from the municipal hospital. Since the research involved secondary data, without any direct contact with human subject, an informed written consent was sought from the management and the ethic committee of the hospital. The data collection procedures and analysis were free of any personal identifiable information to ensure confidentiality and anonymity.
2.5. Limitations
The data was extracted from routine medical records which omitted some vital information such as occupation, diet and body mass index (height was not available to compute this). Lack of regular clinical review attendance resulted inclusion of 80 out the 105 subjects followed with few missing values but this was catered for by the imputation component of the statistical analysis using STATA.
3. Results
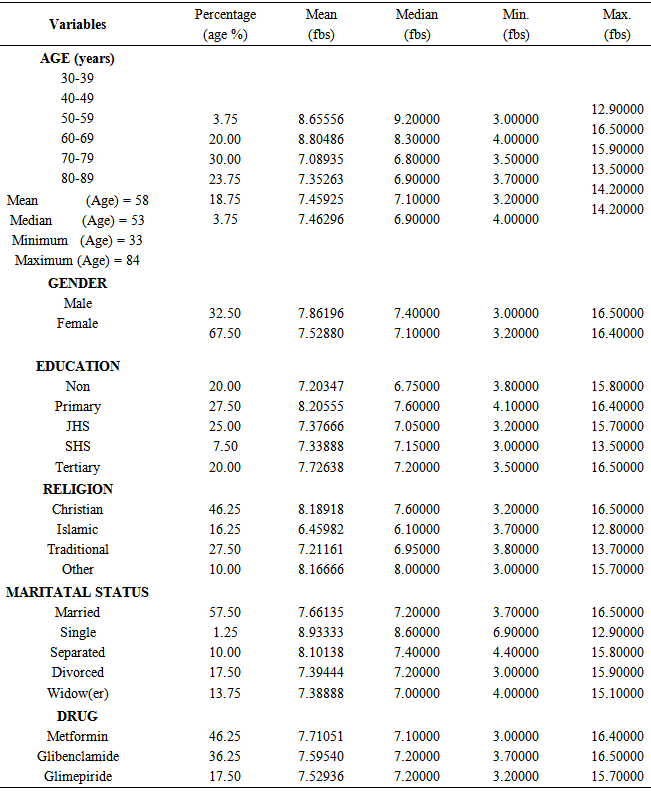
The descriptive statistics of the FBS level of patients on treatment (Table 1) gave the general overview and changes in the FBS level of the patients. This showed the centrality and dispersion of the change in FBS levels with time for the sample of 80 patients stratified into Gender, Education, Marital status, Religious affiliation and the drug regimen.Table 1. Descriptive statistics of FBS level of patients on treatment
 |
| |
|
The plot of change in FBS level of T2D patients with time revealed that the general pattern was cubic (Figure 1) and was further confirmed in the trend modeling.The cubic trend emerged to be the best fit of the change in FBS level over time since the trend model accounted for 91% of the variability in the data (Table 2). This cubic trend model is given by; Where
Where 
Table 2. The trend of changes in FBS level with time
 |
| |
|
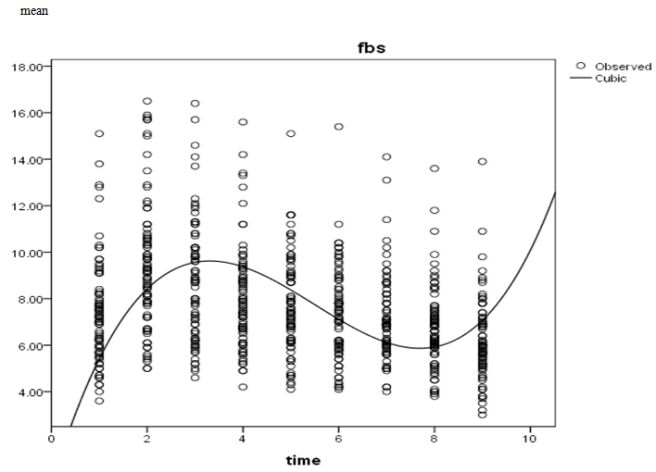 | Figure 1. The pattern of FBS level with time |
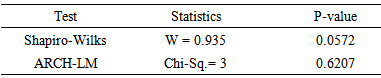
The patternless scatter of the residual plot (Figure 2) gave a visual prove that the cubic regression trend model provides a good fit to the data. This fitness of the cubic trend model was diagnosed using Shapiro-Wilk and ARCH-LM tests (Table 3). The Shapiro-Wilk test and normal Q-Q plot (Figure 3) statistically confirmed that the residuals of the model were normally distributed (p-value = 0.0572). The high W = 0.935 and the ARCH-LM also showed that the residuals were free from conditional heteroscedasticity (p-value = 0.6207). Thiswas an indicationof equal variation in predicted FBS level across the entire range of time of T2D patients on treatment as in the cubic trend predition model.Table 3. Trend model Diagnoses
 |
| |
|
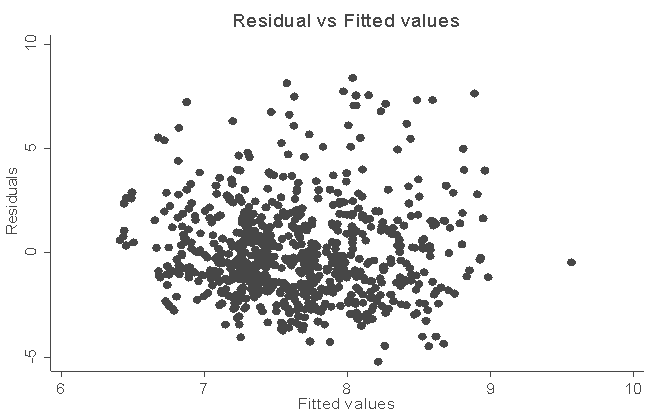 | Figure 2. Residual vs Fitted values of FBS level |
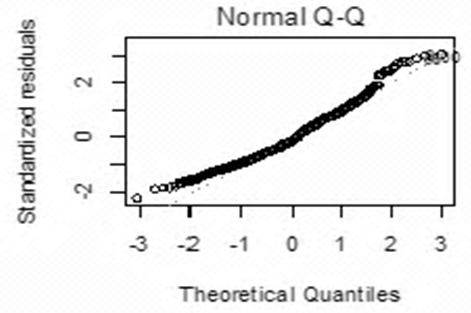 | Figure 3. Normal Q-Q Plot of FBS |
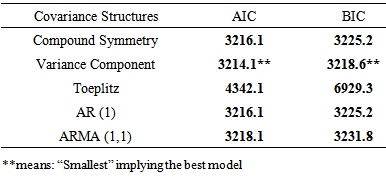
In order to fit the mixed-effects model, comparison of the Akaike’s Information Criterion (AIC) and Bayesian Information Criterion (BIC) for each of the covariance structures (Table 4) showed that the variance component model had the smallest value for AIC (3214.1) and BIC (3218.6), informing the selection of the variance component for the modelling.Table 4. Statistics for Covariance Structure Models
 |
| |
|
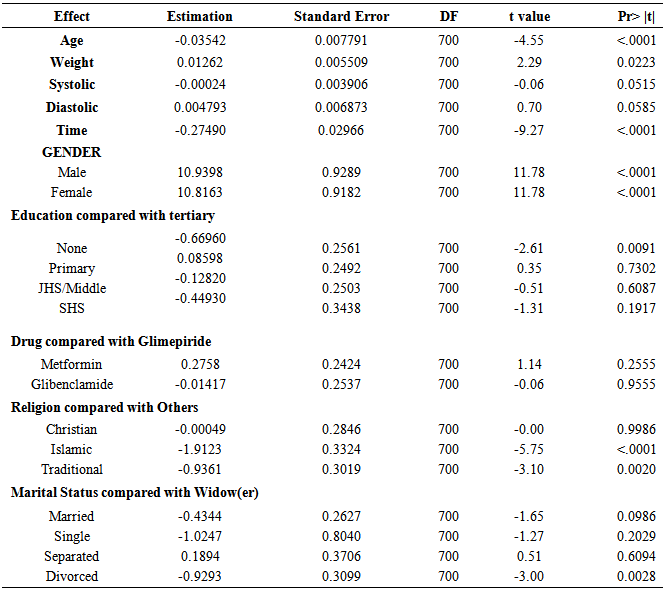
The cubic trend was incorporated into the linear mixed effects model to obtain the parameter estimates and their significance (Table 5). The table shows that the age, weight, gender, no education, Islamic, traditional, married, divorce and time of treatment were significant determinants of change in FBS level of patients (p< 0.05). The rate of change in FBS level is -0.2749mmo/l per unit increase in time. This implied that the rate of change in FBS level decreases with time. A unit increase in the age of a patient on treatment reduces the FBS level by 0.03542mmol/l while a unit increase in weight of a patient on treatment increases the FBS level by 0.01262smmol/l.Table 5. Variance Component covariance Structure output
 |
| |
|
In education category, patients with no education have significantly lower change in FBS level than patients with tertiary education. In the category of religion, patients affiliated to Islamic and traditional religion have significantly lower change in FBS level as compared to patients who are affiliated to “Others”. Also, in the marital status category, divorced patients have significantly lower change in FBS level than patients who are widow(er)s. The change in FBS level did not significantly differ by drug, (Table 5). Hence the full model for the linear mixed-effect model is 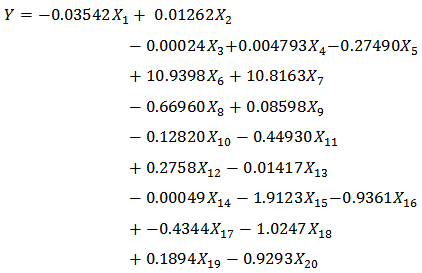


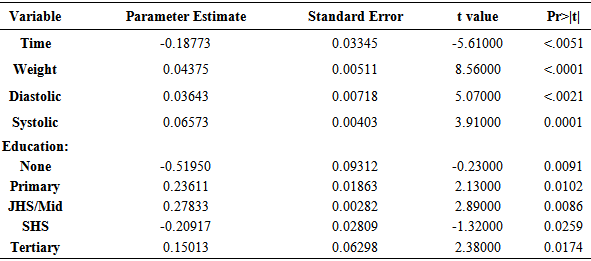
 For future application of the mixed-effects model, stepwise regression model building approach was used to include only variables that added to the prediction in statistically significant way to obtain the reduced model. Thus from table 6, the final reduced mixed-effects model for prediction was
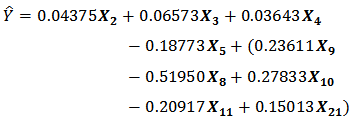
Table 6. Estimates of reduced model
 |
| |
|
It should be noted that one can only belong to one category of education, hence the bracket.
4. Discussion
The descriptive statistics, the normality plots and statistical tests of normality clearly showed that the data used was normally distributed and the sample was a good proportional representation of the population. The ages of the subjects ranges from 30 to 89 years. Eventhough the maximum FBS level was scored by persons in 40–49 years, the mean clearly indicated that the FBS level increases with age where those in 80-89 years were leading with 7.46 mmol/l. This supported the findings of Ikezaki et al., (2002) that the FBS levels tended to correlate negatively with age, but the correlation was not significant.The study deduced that the mean FBS level among male patients were greater as compared to female (7.86196 and 7.52880mmol/l respectively). The percentage of females (67.5%) were almost twice as the males (32.5%) in the study. The high number of females as compared to males could be accounted for by the higher physical activity related energy expenditure in males compared to female subjects, hence lower rate of males living with type 2 diabetes (Aspray et al., 2000). However, females seemed to better adhere to the treatment and management plans than men. The differences in genetic compositions in FBS level progresses faster in males than females; 7.86196mmol/l and 7.52880mmol/l respectively.The educational level category result clearly showed that high educated patients managed the condition better, perhaps they were able to understand the basic disease management and treatment plans better. Christians scored the highest average FBS level and the single marital status. From the average mean of FBS level for the therapeutic treatment, it was clear that all the drugs had almost similar performance in regulating the FBS level with time.The cubic pattern of FBS level of patients on treatment with time implied that the FBS level was fluctuating even-though time significantly affect the FBS level of the patient (estimate of -0.27490 and p-value = <.0001, Tables 2 and 5, Figure 1). The validity of this trend was explained in the high variability of 91%, communicating that the correlation between the actual and predicted FBS levels with time using the cubic trend is very strong. It thereforemeans that healthcare providers can reliably predict the FBS level of patients on treatment with time using a cubic trend model. The Shapiro-Wilks closeness to 1 further strengthen that the model showed a normal distribution and was a good representative of the event in the population (W = 0.935, p > 0.05, Table 3).Besides the duration on treatment, the weight of the patient was also a significant determinant (p = 0.0223 and estimate of 0.01262) of the change in the FBS level ofpatients on treatment (Table 4). The positive parameter estimate indicated that the weight of a patient positively related to the FBS level of the patient. It therefore implies that if weight is reduced, the FBS level will also reduce, buttressing the findings of Kelley et al., (1993) that as weight loss progresses and is maintained, an improvement of glycaemia is evidenced by a reduction in glycosylated haemoglobin.The change in FBS level for males and females were not the same (p<.0001) for both and is comfirmed by the linear mixed effects model (Table 4). The observed educational differentials indicated that higher educated individuals better manage the condintion because patients with no education have a significantly lower change in FBS level (p = 0.0091 and estimate of -0.66960) when compared to patients with tertiary education (Table 4). Patients who were proffesing Islamic and traditional religions have significantly lower FBS level (p= <.0001 and 0.0020 respectively) when compared with patients who belong to “Others or no religion”. The estimated change in FBS level for Islamic and traditional religion patients were respectively-1.9123 and -0.9361 lower than that of “Others” and patients who professed christianity did not significantly differ from “Others”, (Table 4). The influence on FBS level by Islamic and traditional religion affiliates could be as a result of some of their religious practices. For instance, moslems do not take alcoholic beverages and some of the traditionalist in the study area do not wear footwear as they go around their daily duties, some do not board car when celebrating their festivals and so walk bearfooted to wherever they are going and other traditional practices like dancing are energy demanding.Combining the continuous (random) and fixed variables, the variance component covariance structure produced the full mixed-effect model which could be employed by concerned healthcare providers for estimating the FBS level of T2D persons on treatment.In practice, it is not all covariates that will significantly contribute to the change of the FBS level of the patients. The stepwise model selection criterion was done to select only the variables that statistically contribute significantly in the prediction of the FBS level. Thereduced model included the duration on treatment (time), weight, blood pressure (sytolic and diastolic)and education. On the otherhand, the variables age, drug, religion, marital status and gender were not key health determinants for estimating and monitoring the FBS level of T2D patients on treatment (Table 5).
5. Conclusions
In this study, a longitudinal study was employed to model the FBS level of type 2 diabetes patients on treatment. This was done by retrospectively following the medical records of patients from January 2012 to December 2013 in the diabetes clinic of Ketu South Municipal Hospital. With respect to time, the pattern of change in FBS level of patients revealed a cubic distribution. This explained 91% of variability in FBS level accounted for by the duration of treatment. Among the indicators of FBS level, weight and blood pressure (systolic and diastolic) correlated positively to the FBS level of the patients. The mixed effects model developed was confirmed to be adequate for the prediction of FBS level based on the available health determinants. The reduced mixed-effects model showed that time (duration of treatment), weight, bood pressure (sytolic and diastolic) and educational level infuened the FBS level.We therefore recommend the use of models within the local settings to assist health practioners in managing diabetes.The diabetes patients on treatment should be encouraged to work on reducing weight and blood pressure. This is to prevent and manage diabetes, since these covariates related positively to the FBS level significantly. The Health Ministry, Ghana Health Service and stakeholders as well as the diabetes units should frequently organize T2D medical screening or test in order to detect cases early for treatment and/or management of the condition.
ACKNOWLEDGEMENTS
We wish to express our heartfelt gratitude to Adampah, Nawumbeni, Nyadanu, and Polishuk families. To all members of ECHO Ghana, we are very grateful to you for the supports accorded us as members of the organization.A very big thank to the staff of Ketu-South Municipal Hospital, especially the diabetic unit for making their facility available to us for data collection in support of this research. God bless you all.
Competing Interests
Authors have no conflict of interest whatsoever to declare as far as this manuscript is concerned.
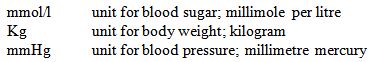
Definition of Units
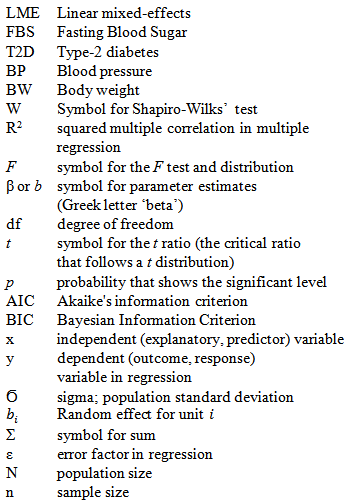
Definition of Symbols
References
| [1] | Aspray T J, Mugusi F and Rashid S, Whiting D, Alberti RG, and Unwin NC:Rural and urban differences in diabetes prevalence in Tanzania: the role of obesity, physical inativity and urban living. Transactions of the Royal Society ofTropical Medicine and Hygiene 2000,94:637-644. |
| [2] | Dawson B., and Trapp R. G., Basic & Clinical Biostatistics, third edition, 2001. Lange Medical Books, McGraw-Hill. Medical Publishing Division, United States of America. . pg 241- 242. |
| [3] | Cooper R, Rotimi C, Ataman S, McGee D, Ositimehin B, Kadiri S, Muna W,(1997).The prevalence of hypertension in seven population of West African Origin. American Journal of Public Health 1997,87 (2): 160-168. |
| [4] | Gill G, Mbanya JC, Alberti K G. Diabetes in Africa.Cambridge: FSG Communications 1997. |
| [5] | Ikezaki A, Hosoda H, Ito K, Iwama S, Miura N, Matsuoka H, Chisato Kondo, C, Kojima, M, Kangawa, K and Sugihara, S: Fasting Plasma Ghrelin Levels Are Negatively Correlated With Insulin Resistance and PAI-1, but Not With Leptin, in Obese Children and Adolescents.Diabetes 2002, 51: 3408–3411. |
| [6] | Irving J, Walker B R, Noon J P, Watt, GCM, Webb, D.J., Shore, A.C. (2002). Microvascular correlates of blood pressure, plasma glucose, and insulin resistance in health. Cardiovascular Research 2002,53: 271–276. |
| [7] | Kelley D E, Wing R R, Buonocore C, Sturis J, Polonsky K, and Fitzimmons M: Relative effects of calorie restriction and weight loss in noninsulin-dependent diabetes mellitus. The Journal of Clinical Endocrinology & Metabolism 1993, 77:1 287–1293. |
| [8] | Mbanya JC, Ngogang J, Salah JN, Minkoulou E, and Balkau B: Prevalence of NIDDM and Impaired Glucose Tolerance in a Rural and an Urban Population in Cameroon. Diabetologia 1997, 40:824–829. |
| [9] | Metcalf PA, Wells S, Jackson RT: Assessing 10-year coronaryheart disease risk in people with Type 2 diabetes mellitus: Framingham versus United Kingdom Prospective Diabetes Study. Journal of Diabetes Mellitus 2014, Vol.4, No.1, 12-18 http://dx.doi.org/10.4236/jdm.2014.41003. |
| [10] | Powers B J, Olsen MK , Oddone EZ, and Bosworth HB: Effect of a Hypertension Self-Management Intervention on Diabetes and Cholesterol Control. 2008 DOI: 10.1016/j.amjmed2008.12.022. |
| [11] | Spangler JG and Kirk J: Correlation between diabetes prevalence and subsequent cancer mortality in North Carolina counties. The Journal of Physician Assistant Education 2013, 24(4):9-14. |
| [12] | WHO: Definition, Diagnosis and Classification of Diabetes Mellitus and its Complications 1999, WHO/NCD/NCS/99.2. |
 Abstract
 Reference
 Full-Text PDF
 Full-text HTML