-
Paper Information
- Next Paper
- Paper Submission
-
Journal Information
- About This Journal
- Editorial Board
- Current Issue
- Archive
- Author Guidelines
- Contact Us
International Journal of Statistics and Applications
p-ISSN: 2168-5193 e-ISSN: 2168-5215
2015; 5(1): 5-14
doi:10.5923/j.statistics.20150501.02
Identification of Risk Factors Involved in Road Accidents in Ghana: A Case Study of the Techiman Municipality
 Abstract
 Reference
 Full-Text PDF
 Full-text HTML
Awal Mohammed 1, Abdul-Rahaman Haadi 2, Ahmed Jamal Deen 3
1Buoyem Senior High School, Techiman, Ghana
2Tamale Polytechnic, Department of Statistics, Mathematics & Science, Tamale, Ghana
3Baafi D/A Basic School, Brong Ahafo, Ghana
Correspondence to: Abdul-Rahaman Haadi , Tamale Polytechnic, Department of Statistics, Mathematics & Science, Tamale, Ghana.
| Email: |  |
Copyright © 2015 Scientific & Academic Publishing. All Rights Reserved.
The problem of deaths and injury as a result of road accidents is now acknowledged to be a global phenomenon. As a result authorities in virtually all countries of the world are now concerned about the growth in the number of people killed and seriously injured on their roads including Ghana. The objective of the paper was to identify the risk factors that mainly contribute to accident and their impact on road accident. This paper applied logistic regression to accident-related data collected from MOTOR TRAFFIC and TRANSPORT UNIT (MTTU) of GHANA POLICE SERVICE, TECHIMAN DIVISIONAL COMMAND traffic records in order to examine the contributing factors to accident severity. A total of 494 accident data from 2007-2011 was used. The accident severity (dependent variable) in this paper is a dichotomous variable with two categories, Fatal or Non-fatal. Among the variables obtained from police-accident reports, five independent variables namely; gender, time of accident, location of accident and reasons assigned for accident were found to be statistically significant.
Keywords: Accident Severity, Logistic Regression, Fatal Accident, Non-Fatal Accident
Cite this paper: Awal Mohammed , Abdul-Rahaman Haadi , Ahmed Jamal Deen , Identification of Risk Factors Involved in Road Accidents in Ghana: A Case Study of the Techiman Municipality, International Journal of Statistics and Applications, Vol. 5 No. 1, 2015, pp. 5-14. doi: 10.5923/j.statistics.20150501.02.
Article Outline
1. Introduction
- Motor vehicle registration in Ghana is increasing rapidly as the population grows contributing to a rise in the number of road traffic injuries and fatalities. According to [1], the country had 1.3 million registered vehicles, a figure which grew by 10% annually, presenting road safety concerns. However, the main source of transportation in Ghana is by road. [2] stated that, road transportation caters for 96% of national freight tonnage and 97% of passenger traffic.[3] stated in Data Journalism Application and Road Safety in Ghana that; research showed that in 2001, Ghana was rated as the second highest road traffic accident-prone nation among six West African countries, with 73 deaths per 1000 accidents. However, current statistics on annual death on road accident in Ghana is too alarming as the British Medical Journal once reported that more people die in road traffic accidents than malaria worldwide.According to [4], globally, an average of 3,242 people lose their lives due to road traffic injury (RTI) every day. It is estimated that RTI deaths will rise to the fifth leading cause of death by 2030 resulting in an estimated 2.4 million deaths per year, unless preventive efforts are taken. In a study conducted by [5]; and [6], reveals that the leading causes of death among adolescents and young adults in the world is road traffic accident. [6] in stating the plight of children, listed; (1) accidental death of children accounts for 6.7% of total such death out of which 36.3% are due to road accidents. (2) Road Traffic injuries are a leading cause of death in children. (3) Road accidents accounted for 55% of all accidental death in children and in almost all of these, the unsafe behavior of child was considered to be at fault. (4) Road accident deaths occur in healthy children who might have been expected to have had productive lives and cause immeasurable distress and guilt to the parents and other parties involved. So the prevention of accidents in children is being increasingly recognized as an important public health issues. [7] added that in the developing world children under 15 forms a higher percentage of road accident victims (typically 15 per cent) compared with industrialized countries (usually about 6 per cent). Ghana is a coastal country located along the Gulf of Guinea. Due to the relative political stability she enjoys, her two international harbours are being used by sister land locked nations such as Burkina Faso, Mali, Chad and Niger. Statistics indicates that road transportation caters for 96% of national tonnage and a large percentage of highway accidents are caused by abandoned broken down trucks with no warning signals.[8] stated that global losses due to road traffic injuries are estimated to be US$518billion, and developing countries lose about 1% and 3% of their GNP which is more than development aid they receive annually. [9], stated in absolute numbers, the road-related mortality rate per capita in Africa is the highest in the world at 28.3 deaths per 100,000 at an estimated cost of US$ 3.7 billion. [10] reported that road accidents exert much stress on the national budget. In a stake holders meeting, the NRSC announced that Ghana losses 1.6 percent of GDP in road traffic fatalities; and that 1.6 percent of GDP for 2004 was around 256 million dollars which was more than all government ministries budget of 200 million Ghana cedis for the 2010 financial year. Ghana does not only lose financially as a result of road accident but also her valuable labour force. [11] Reports that six thousand people nationwide have died in road fatalities within the last three years, and forty thousand people have been injured within the period.[12], reports that 70% of the year 2004 nationwide accidents were recorded in the following regions Brong Ahafo, Eastern, Ashanti, Central and the Greater Accra.In an interview with the regional MTTU commander, he stated that, road accident data from the Techiman municipality is nearly 30% of the regional data annually. Therefore this paper will concentrates on the number of injured people per accident in the Techiman municipality and will attempt to address the following questions: 1. What are the variables that mainly determine road accident fatality? 2. What is the impact of the variables on accident fatality?
1.1. Organization of Paper
- This paper is in five sections. Section one gives the introduction of the paper andorganization of paper. Section two reviews scholarly texts on the research area, describes recent trends in fatalities of vehicles and factors influencing motor traffic safety. Then section three discusses the sources and characteristics of accidents as well as methodology. Also discussion and analysis of the result is in section four andsection five contains conclusion of the paper.
2. Literature Review
2.1. Trends in Road Safety Fatalities and Injuries in Ghana
- In a research conducted in Ghana by [44], stated that in developing countries, motorization has been accompanied by rapid growth in road traffic injuries which has become a leading cause death and disability. The second African Road Safety Conference stated that, developing countries account for about 70 per cent of the world’s road fatalities; and that, 28 and 32.2 per cent of deaths in Africa per 100,000 populations, hence the second leading cause of death in 5 to 44 age group of African is through road accidents. The foregoing assertion is truly reflected in the spate of accident in Ghana. The [10] reported that Ghana records about 10,000 fatal road accidents every year out of which an average of 1600 people perish while 150 people sustain serious injuries robbing the nation of some precious lives.The global Road Safety Partnership (G R S P) indicated that from 2002 – 2005, 70 per cent of persons killed in road accidents were males and 20.8 per cent are children under six years old. Pedestrians are the very vulnerable group accounting for more than 40 per cent of annual road accidents fatalities with 21% being children under 16 years of age. According to the Building and Road Research Institute (BRRI, 2001), at the national level, an average of 29% of all accidents were pedestrian accidents and the most vulnerable was the 6 – 10 years aged group accounting for 18% of all casualties. [44] stated as in many other developing countries pedestrian injuries are most common road traffic death, 43% of all deaths in Ghana was due to pedestrian accident. [6] analysis a Thirty-eight separate studies on road accidents, described casualties by the category of road-user.it came out that, Pedestrian fatalities were highest in 75% of the studies accounting for between 41 and 75%, followed by passengers (38-51%) in 62% of the studies. Drivers were third in 55% of the studies, and never ranked first in any country. Pedal and motorcyclists killed ranked first in India. Passengers ranked first amongst the non-fatal casualties reported in 14 studies.According to [15], the introduction of pavements (sidewalks) for pedestrians to walk separately from motorized traffic-especially at high-risk crash sites has the potential to lead to substantial reductions in pedestrian injuries. Roads that do not provide pavements, a common scenario in many low-income countries are associated with a two-fold increased risk of a crash compared with those that do. Also Implementation of road-design measures to facilitate reductions in speed, through various traffic-calming measures, is another key strategy that can be used—with potential reductions in deaths and injuries of 11%. Although these findings from the Cochrane Injuries Review Group was not based on any reports from low-income and middle-income countries, a before-and-after investigation of the introduction of speed bumps in Ghana showed a 55% reduction in all deaths and a 51% annual reduction in crashes in which a pedestrian was hit. The researchers added, while road safety fatalities and injuries are reducing in the developed world, it is increasing at an alarming rate in the developing countries.[16] cited Arthur Kennedy in an article “Perishing on the road” that many of our prominent politicians have been involved in accidents including the Former Presidents of Ghana; Rawlings and Kufour and many other prominent politicians and members of the parliament of Ghana. Amoah again cited Amofa (the deputy director Health Service) stating that, “road accidents kill more Ghanaians annually than typhoid fever, pregnancy – related complications, and malaria in pregnancy, diabetes or rheumatism”. He added that, the death of three Urologists of the Korle-Bu teaching Hospital on the Kumasi-Accra highway leaves a scarlet in the minds of Ghanaians. The MTTU (2011), cautioned road users to be careful as the accidents are rampant getting to the end of years especially in the months of November and December. According to the G R S P, road accidents kill average of four persons daily in Ghana. [10] reported the Vice President of Ghana, Mahama as saying “the current rate of 1800 deaths through road accidents is unacceptable”. The situation is too scary as [10] reported a popular statement made by Akorsah that “the most deadly disease in Ghana at the moment is motor accidents”.
2.2. Techiman in Perspective
- The Techiman municipal highways in the Brong Ahafo region are one of the busiest highways in the country and as such records high fatal road accidents (MTTU, 2010). The municipality does not only link the northern regions of the country to the rest of the regions in Ghana, but also serves as an important Tran-Ecowas route linking some landlocked Ecowas Nations.The strategic location of Techiman as a nodal settlement makes the municipality an important market Centre which attracts people from all over the country and the Ecowas sub-region visiting the municipality purely on business. This renders the road network prone to motor vehicular accidents. The Kumasi – Techiman – Kintampo, the Kumasi – Techiman – Wenchi, the Techiman – Sunyani and Techiman - Nkoranza highways are always busy and as such record high rate of road traffic fatalities. In a single accident along the Techiman – Kintampo highway, the nation was hit with a gory report of the death of twenty-seven (27) persons, including five children aged below 10 years.Data on road accident in Ghana just like other developing countries is under-stated because most accident cases are not reported. [31] stated that many developing countries have insufficient data on accidents. This is particularly the case for the poorest countries, many in sub-Saharan Africa. Due to poor record keeping, [17] described how even “fatalities are under-reported in Africa”.A visit to the Techiman Holy Family Hospital reveals a high incidence of motor traffic cases. The hospital recorded a total of 2383 Out Patient Department (OPD) cases from 2007 to 2011 with 109 RTIs resulted deaths. A sharp contrast of OPD cases is the police reported cases for the same period is 494 reported cases with 234 spot deaths. Indeed, there is under-reporting of accident cases. According to the Motor Transport and Traffic Unit of Police the Techiman Divisional Command, a recent concern of road accident is fatal motorcycle crashes. Motor cycle riding has become a favorite trend in modern years, attracting a new age group of fanatics consisting older and wealthy riders. However, motorcycles in developing countries are more popular for commuting or utilitarian trips as opposed to recreational trips [38]. Obviously, motorcyclists are more at risk of being killed in road traffic accidents than any other type of motor vehicle occupants. As the number of motorcycle increase in Techiman and for that matter Ghana, a new area of concern regarding motor cyclists has emerged.
2.3. Risk Factors Influencing Road Traffic Fatalities and Injuries
- The [8] Categorized risk factors into four groups, these are;1. Factors influencing exposure to risk (thus, social deprivation, age and sex)2. Risk factors influencing crash involvement (thus, young male, fatigue inadequate visibility).3. Factors influencing crash severity (thus, not wearing safety equipment, excessive speed alcohol)4. Severity of injuries after road traffic crash (Thus, delay in detecting crash, and transportation). In the report, developing countries have increased exposure to the risk factors of road traffic injuries due to rapid urbanization and motorization coupled with unsafe public transportation, higher speed, and a diverse vehicle mix on the roads. According to [42] drivers today are faced with many problems when driving in congested and overcrowded cities, specifically by having the senses overloaded by the vast amount of information that needs to be continuously processed – a condition also knows as information overload. The types of information a typical city driver may encounter and need to react upon are numerous and include traffic signs, traffic signals, information about detour, billboard and other advertisements, horns, loud music from passing vehicles, vehicle changing lanes, pedestrians and much more.[35] reported that over 3000 Kenyans are killed on the road every year most of the dead are between the ages of 15 and 44 years (thus the productive age group). Road accident as a global concern, the [35] reports that , almost 16000 people die daily worldwide from all types of injuries representing 12% of the global burden of diseases and among all category of injuries, road accident related is the most. The report admits that estimating annual road deaths vary due to some limitations; it is believed that over 3000 lives are lost daily worldwide. The driver’s characteristics contribute to the high percentage in cases of road traffic accidents. [5] estimated human error in road accident to fall between 64 and 95% percentage of all causes of traffic crashes in developing countries. According to [18] Statistics indicate that over 90 percent of traffic accident situations in Nigeria can be attributed to driver errors.Risky behavour leading to road fatalities are explained in many studies. According to [39] driver behaviours can be roughly divided into two categories; errors and violations. This differentiation provided base for the development of the Manchester Driver Behaviour Questionnaire (DBQ). The DBQ showed that driver errors, violations, and slips and lapses are three empirically distinct classes of behaviour. [39] defined errors as ‘the failure of planned actions to achieve their intended consequences’; violations as ‘deliberate deviations from those practices believed necessary to maintain the safe operation of a potentially hazardous system’; and slips and lapses as attention and memory failures. Unlike errors, violations were seen as deliberate behaviours, although both errors and violations are potentially dangerous and might lead to a crash.[41] stated that, the effect of attitude on intentional behaviours has been explained robustly in many studies, especially as related to the Theory of Planned Behaviour ([22-24]) which supports those previous findings by revealing that the more motorcyclists enjoyed not wearing a helmet and speeding, the more likely they were to engage in those risky behaviors. The researchers concluded that significant proportion of the study subjects were with high risky driving behaviors. It is a common seen of families, for instance including two adults and two children, rides on a motorcycles and bicycles in developing countries. [38] described the situation in developing countries are more popular for commuting or utilitarian trips as opposed to recreational trips. However, a study conducted in the UK focusing on motorcyclist’ behavior and accidents [22]; found that speed behaviour was significantly related to involvement in a 'blame' accident. In addition, errors and not violations were the dominant predictors of motorcyclists' accident-involvement. This situation was a reverse to car accident-involvement. The explanation for this difference might be that riding a motorcycle is more demanding than driving a car, thus motorcyclists may be more prone to making errors when riding than are car drivers when driving. More importantly, given the dynamics of motorcycling, the commission of an error when riding is likely to have more severe consequences than making an error when driving. For example, it is quite possible for a car driver to recover from making an error without losing control of the vehicle. However, the recovery from an error when riding a motorcycle is potentially more difficult due to the relative instability of a two-wheeled vehicle compared with a four-wheeled vehicle. According to [18] a small percentage of crashes are caused by mechanical failure of a vehicle, such as some form of tyre failure, brake failure, or steering failure. They however stated that, the design of a vehicle can be a contributory factor in the severity of crashes. Some of the features and recent improvements that affect the safety of a vehicle include, airbags, Antilock Braking System (ABS), back-up sensing system, crumple zone, electronic stability system, and so on. On the nature of roads as contributory factor of road accident, [18], added that, the quality of pavements, shoulders, traffic control devices and intersections, can be a factor in the crash; and that, frictional forces between the pavement and tyres is another important factor. If the tyres lose contact with the pavement then the vehicle starts fishtailing.[26] undertook a follow-up study proposed by [25] to developed two APMs to statistically determine the impact of the significance of vehicular and driver’s characteristics of passenger cars on the number of accidents occurred during last two years by the drivers. The researchers concluded that, the APM developed for passenger cars can be used in Lahore and other cities of Pakistan; and that, the damaged indicators, minor damages, overall unsatisfactory condition of cars, availability of musical instruments in cars, low qualification level, accidents committed by drivers in their entire driving exposure and rare mechanical check-up of cars are the main causes of their accidents. The proportion of car accidents indicates that more than 90% accidents occurred due to human errors. The Motor Vehicle Examination Authority and Law Enforcing Agencies should periodically check the passenger cars in general and with reference to aforementioned seven variables in particular for ensuring the road safety.
2.4. Modeling of Risk Factors Associated with Traffic Safety
- Several statistical methodologies have become more acceptable and have been used by a number of researchers in the past who studied risk factors associated with traffic safety. [19] studied risk factors to driver fatalities in single-vehicle crashes and compared between motorcycle riders and non-motorcycle drivers using 2000 traffic data from Taiwan’s Road Accident Investigation and Reporting System. Their objective was to investigate the risk factors to driver fatality, provided that a single-vehicle injury crash occurred. Apart from understanding the risk difference amongst these two kinds of drivers, the authors also compared the risk factors contributing to non-motorcycle drivers and motorcycle rider fatalities, and also to possible explanations as to how and why they arise. Four risk factor categories—driver’s characteristics, roadway environment, vehicle type, and single-vehicle crash type—were selected as the explanatory variable categories in that study. The authors employed a logistic regression model to estimate the relative probability of fatalities for drivers and motorcyclists between specific levels of risk factors. The researchers compared the advantages of using the logistic regression method over the least-square regression method. The logistic regression analysis can be used to predict a binary outcome from a set of explanatory variables that may be continuous, categorical, or a mixture of the two unlike the least-squares regression where the dependent variable in the logistic regression analysis can violate the assumptions of continuous or normal distribution, and conditional constant variances.Study conducted by [14] applied logistic regression to investigate the influence of accident factors on fatal and non-fatal accidents for motor vehicle in Saudi Arabia. The study found that accident location and cause of accident significantly associated with fatal accidents. Accident factors used in the study including accident location, accident type, collision type, accident time, accident cause, driver age at fault, vehicle type, nationality and license status.Furthermore, logistic regression has been considered as an appropriate method of analysis in a study conducted by [20] to compare severity of affecting factors between young and older drivers involved in single-vehicle crashes. The study findings informs that almost all the common identified factors influenced both driver groups in the same manner except in the case of alcohol and drug usage in the case of crash severity of older drivers. Speeding and non-usage of a restraint device were the two most important factors affecting towards increased crash severity for both driver groups at all severity levels. Additionally, ejection and existence of curve/grade were determinants of higher young driver crash severity at all levels. For older drivers, having a frontal impact point was a severity determinant at all levels.[30] examined the Factors affecting crash severity on gravel roads. The authors focused on the characteristics of crashes that were reported on gravel roads with the objective of identifying factors affecting severity of injury crashes on gravel roads. Crash data from Kansas over a 10-year period (1996-2005) was used in the analysis. Logistic regression models were developed to estimate the probability of having an injury crash of different levels of severity for a given set of explanatory variables. The regression modeling considered about thirty candidate factors related to driver, road, environment, and collision types from the police reports. It was found that multiple factors were very significant in these models, such as safety equipment usage, driver ejection, alcohol involvement, speed limit, and some driver-related factors. The existence of these factors was very likely to result in high severity injury crashes, compared to the circumstances without them. The magnitude of such contributing effects was also estimated by computing the conditional odds ratios for individual predictors. A study conducted by [27] shows that helmets and safety belts are effective in reducing fatalities and injuries. Safety belt and helmet use in the seven Crash Outcome Data Evaluation System (CODES) states (i.e., Hawaii, Maine, Missouri, New York, Pennsylvania, Utah, and Wisconsin) could save millions of dollars in direct medical costs. Logistic regression was used to estimate the effect of being belted on the odds of sustaining various levels of injury. They compared odds ratios to risk ratios and presented safety-belt analyses of injury, cost of injury, alcohol and drug use, age factors, types of safety belts, and geographic patterns in crash characteristics. [37] analyzed motorcycle helmet use for motorcycle riders 21 years and older who were involved in fatal crashes. Their analysis was based on data from the National Highway Traffic Administration’s Fatality Analysis Reporting System (FARS) over the years 1997-2006. Crashes were separated into two categories: (a) single-vehicle motorcycle crashes and (b) two-vehicle crashes involving one passenger vehicle and one motorcycle. A logistic regression model was used to perform a multivariate analysis that examined the relationship between a motorcycle rider’s helmet use and many other factors. The authors found that the odds of a motorcycle rider in a single-vehicle fatal crash wearing a helmet were seventy-two percent less in states lacking a universal helmet law than states with a universal helmet law.[25] using the logistic regression model analysis a cross-sectional studies of risky driving behaviors of drivers in Mekelle town, North Ethiopia. The study revealed that drivers with secondary or high school educational status had higher risky driving behaviors than drivers with university or college educational status. However, drivers with lower/ primary educational status had no significant statistical difference in risky driving behavior with university or college educational status drivers. This may be related with drivers with lower educational status had more years of driving experiences as they got their driving license with old legislation. The study noted that drivers who had more driving experience were found to exercise more risky behaviors. In contrary, a study in Tanzania showed that drivers who were not having driving experience found to be with high risky driving behaviors. However, study showed that driving experience was not found as a predictor variable for risky driving behavior which needs further investigation for explanation. Conversely a study conducted in Turkey, stated that most drivers perceive traffic accident as a result of fate. This assertion needs further investigation.Case-control study of risk factors for fatal and non-fatal injury in crashes of rotary-wing aircraft was conducted by [34]. The objective of this study was to identify the potentially modifiable risk factors for injury in civil rotary-wing aircraft crashes in New Zealand. The authors performed two separate univariate analyses on all records from 1988 to 1994 that were reported on civil rotary-wing aircraft crashes in New Zealand. The first univariate analysis compared pilots-in command who were fatally injured in a rotary-wing air crash and pilots-in-command who were involved in a crash but not fatally; this analysis was restricted to pilots-in-command to avoid any confusion due to numerous flight crews and seating positions. The second univariate analysis compared pilots-in-command who were injured seriously (fatal or non-fatal) in an air crash to pilots-in-command who were involved in a crash but not hospitalized with an injury. To estimate the unadjusted odds ratios for each of the factors, a set of unconditional univariate logistic regression analyses were conducted. Then multivariate logistic regression analyses were performed to adjust the effects of off-airport location and post-crash fire for each identified significant factor in the analysis. [40] evaluated the factors associated with the crash risk of adult bicyclists. A multiple logistic regression analysis was employed to quantify the risk factors, simultaneously controlling a number of bicyclists’ characteristics and bicycle use patterns. The relationship between a set of explanatory variables and a dichotomous dependent variable was examined by using the logit function in the regression model. The logit specification was used to determine the risk factors after adjusting for the potentially complex relationships between rider characteristics and crash risks. A study by [28] in Spain evaluated driver dependent factors and the risk of causing a collision for motorcycles. A multivariate analysis using an unconditional logistic regression model was used in this study. The condition of infraction was the dependent variable used in the model and the independent variables included the vehicle, driver, and crash related factors. This analysis estimated the odds ratios for each category of all driver related variables, adjusted by the effect of the remaining factors included in the model. A separate stratified analysis was done using speed related infractions as a dependent variable for two groups of cases: drivers who committed only other types of infractions and drivers who committed only speed-related infractions. The study concludes that inappropriate speed is the variable with the greatest influence on the risk of causing a collision followed by driving under the alcohol influence. Other factors that were associated with higher risk of causing collisions were younger and older drivers, alien drivers, and driving with an invalid license. On the other end being female, longer time in possession of a driving license and helmet use were associated with lower risk. A study by [21] reported the risky behavior of drivers of motorized two wheeled vehicles in India. They performed univariate analysis for the determination of outcome variables with other characteristics, and reported chi-square tests for significance. Driving violations were categorized into traffic violations for the analyses (e.g., violation of red light, driving in inappropriate direction, driving while using a mobile phone, entering a no-traffic zone), violating documents (e.g., vehicle registration documents, lack of driver license), vehicle violations (e.g., no horn, no functional head lights, no rear-view mirror) and parking violations.According [32], Risk factors are used to explain accident involvement and accident severity. Risk factors in road accident models play two roles:1. Improve overall model fit and reduce the amount of unexplained variation. Care must be taken that these models and are not over-specified (i.e. do not include unnecessary variables). 2. Provide a means for evaluating the effectiveness of alternative safety measures. Many countries do not see road safety as a national health problem. The 2009 global status report states that, pedestrians, cyclists, and drivers of motorized two-wheelers and their passengers account for almost half of global road traffic deaths, only about 9% of the world countries have a comprehensive law on speed limit regulation, less than half of countries worldwide have drink-driving laws base on blood alcohol concentration limit that is equal to or less than 0.05g/dl, also only 38% of low-income and 54% of middle income countries have seatbelts in cars both at front and rear seats. The World Health Organisation states that majority of the world countries do not have robust data on nonfatal traffic injuries.In general, risk factors related to traffic and road section characteristics were found to be essential in analyzing accident injury severity. Risk factors such as accident dynamics/speed, seat belt use, and occupant age were found to be most important in explaining accident severity.
3. Methodology
3.1. Descriptions of Variables Selected for Analysis
- A structured questionnaire, entirely based on the forms of the motor transport and traffic unit of police (MTTU) Techiman command, included information about the following covariates: 1) type of road traffic accident (fatal vs. non-fatal event – the later referred to as injury, as determined by the MTTU Department at the time of event, regardless of hospital care); 2) year of event in the study period; 3) socio-demographic determinants (age and sex) of the responsible driver; 4) reason of road traffic accident as recorded in the police forms (human error, mechanical fault, obstruction by others, accidental); 5) location of event (highway, within city roads); 6) time of the event (morning hours, afternoon, or overnight); and 7) the type of vehicle involved (commercial, private, motorbike). All statistical analyses were performed with Scientific Product and Service Solution, version 20.0 (SPSS Inc., Chicago, IL, USA).
3.2. Logistic Regression Model
- The logistic regression model is used in this study to predict the relative likelihood of being killed in a road accident. The goal of logistic regression is to identify the best fitting model that describes the relationship between a binary dependent variable and a set of independent or explanatory variables. The dependent variable is the population proportion or probability (p) that, the resulting outcome is equal to 1. Parameters obtained for the independent variables can be used to estimate odds ratios for each of the independent variables in the model. For the binary response variable y, denotes its categories by 1 and 0. It uses the generic term success and failure for the two outcomes.According to [13], logistic regression is the most preferred where the independent variables are categorical or mix of continuous and categorical. In this study, we code
 (non-fatal) and
  (fatal). The specific form of the logistic regression model is:
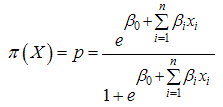 | (1) |
 | (2) |
 The model constant.
 The parameter estimates for the independent variables.
 : The set of independent variables (i =1, 2… n)
 : Probability ranges from 0 to 1
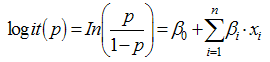
 The natural logarithm ranges from negative infinity to positive infinity.According to [29], there are two important reasons that make logistic regression popular;1. The range of the logistic function is between 0 and 1; that make it suitable for use as probability model, representing individual risk.2. The logistic regression curve has an increasing s-shape with a threshold; that makes it suitable for use as statistical model, representing risk due to exposure.A simple transformation of equation (1) yields;
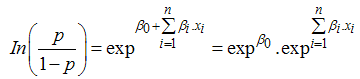 | (3) |
 is given as follows: The fundamental equation for the logistic regression shows that when the value of an independent variable increases by unit one, all others are variables are held constant; the new probability ratio is given as follows:
 | (4) |
4. Data Analysis and Results
- A Road safety concern in Techiman is bothered by many of the same problems faced throughout the Country. The results of this paper unveiled risk factors which might be possible causes of fatalities in motor vehicle crashes in Techiman and can be isolated when attempting to prevent fatal injuries. Out of a total of 494 accident cases reported 203 cases were fatal killing 234 people and injuring a total of 629 persons within the Techiman municipality from the year 2007 to 2011. Accident related factors were employed as the predictor variables in this paper.
4.1. Variable Selection
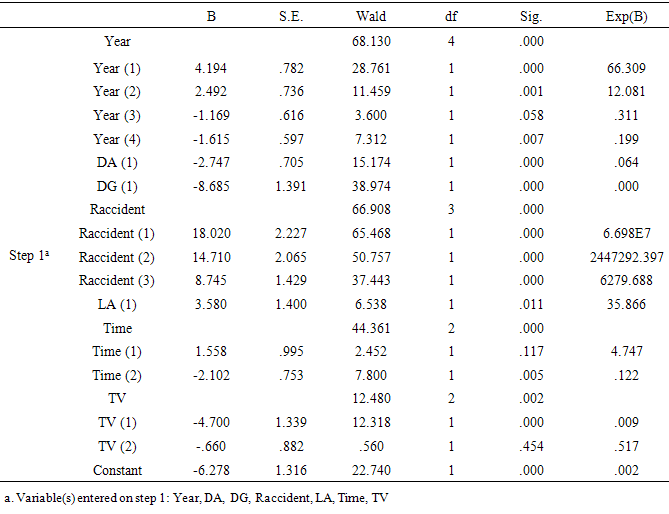
- The analysis began by testing the significance of the association each explanatory variable could have with the dependent variable. For this purpose the entering selection process of logistic regression was followed in this study. Out of the seven explanatory variables, five were statistically significant. From the table below, clearly, explanatory variables such as gender, type of vehicle at fault, location of accident and reasons assigned as responsible for the accident were significant effect on the dependent variable.
|
|
4.2. Logistic Regression Analysis
- Logistic Regression is the selected method for analyzing the accident data. Only the explanatory variables found significantly associated with the dependent variable as per the Wald’s test result are considered in the Logistic regression analysis. These variables are gender, reason for accident, location and the type of vehicle (at fault) will be included in the logistic regression model.
4.2.1. The Logit Model
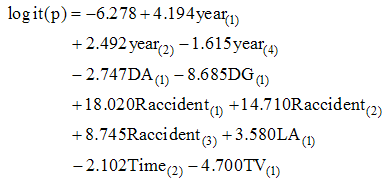
- It was however observed that, Time (1) [thus afternoon hours] and Type of Vehicle (2) [private] are not statistically significant to the study. Therefore another model was fitted by excluding these variables. The new model is given by:
4.3. Model Interpretation
- The interpretation of any fitted model requires the ability to draw practical inferences from the estimated coefficients. Comparing the difference in impact or risk among the levels of each variable by looking at the regression coefficients. The interpretation of the estimated parameter coefficients is that, for a one unit change in the predictor variable, the difference in log-odds for a positive outcome is expected to change by the respective coefficient, given the other variables in the model are held constant. Accordingly, those predictors with positive coefficients cause an increasing tendency to result into fatalities. Similarly, negative coefficients indicate decreasing tendency for those significant predictors. Consider reasons assigned for accident, other variables being controlled.Reason for accident 1vs2 = exp(-6.278+18.020)/ exp(-6.278+14.710) = 27.3851Reason for accident 1vs2 = exp (-6.278+18.020)/exp (-6.278+8.745) = 10667.95Reason for accident 1vs2 = exp (-6.278+14.710)/exp (-6.278+8.745) = 389.7156These figures show that the impact of fatality due to human error is 27.4 times more than fatality due to mechanical fault and; 10668 times higher than fatality due to obstruction-by-others. The impact of fatality due to mechanical fault is 389.7 times higher than fatality due to obstruction-by-others. Odds Ratio is defined as the ratio of the odds for the independent variable being present to the odds of not being present. The following subsections give illustrations for interpretation for the model developed in this study. The odds of driver’s age below 25 years being a factor for fatal accident is shown as
 . Thus, fatality due to driver’s age below 25 years is 10 per cent higher than driver’s age above 25 years.The odds ratio of fatality on the highway is
  . thus; the odds ratio of having a fatal accident on the highways is 35.9 times higher than within city.Also the odds ratio of fatal accident occurring during afternoon hours is
  , representing 12 per cent as compared with overnight.
5. Conclusions
- It can be concluded that there is an urgent need to address the epidemic of carnage on the roads. Many cases of fatality are caused by human errors which are preventable.Using the concept of Deviance together with Wald Statistic, the study variables were subjected to statistical testing. Five variables were statistically significant and the observed level of significance for regression coefficients for the variables were less than 5% suggesting that those variables were indeed good explanatory variables. The result also indicates a high goodness of fit. The significance of gender in this study is consistent with past studies findings that road user attributes such as gender and age should be considered in accident risk assessment ([14], [20]).
References
| [1] | N R S C (2011): Road accidents cost more than budget. Retrieved from http://www. ghananews agency. Org accessed in 3rd December 2011. |
| [2] | Sarpong, S (2003); Road accidents on the increase. Retrieved from http://www.newsfromafrica.org/newsfromafrica/articles/art_594.html on 17thdecember, 2011. |
| [3] | Abissath M. (2010) Data Journalism Application and Road Safety in Ghana. http//www.ghna.gov.gh/index.php/features/17343-data-journalism-application-and-road-safety-in-ghana. Accessed on Friday, 02 November, 2012. |
| [4] | World Health Organization (2010), United Nation Decade of Action for Road Safety (2010-2011). |
| [5] | Odero W, Garner P., Zwi A. (1997): Road traffic injuries in the developing countries. Comprehensive review of epidemiological studies. Journal of Tropical Medicine and International Health 2(5), 445 – 460. |
| [6] | Atubi A. O. (2012), Determinants of Road Traffic Accident Occurrences in Lagos State: Some Lessons for Nigeria. International Journal of Humanities and Social Science Vol. 2 No. 6.Accessed on 15th November 2012. |
| [7] | Ghee, C., Astrop, A., Silcock, D., and Jacobs, G., (1997), Socio-economic aspects of road accidents in developing countries. Transport Research Laboratory (TRL) Report 247 |
| [8] | Who (2009), global status report on road safety; time for action. |
| [9] | Global Road Safety Facility (2012), Africa: Scaling-up Efforts to Address the Road Safety Challenge. Retrieved from; http://web.worldbank.org/WBSITE/EXTERNAL/TOPICS/EXTTRANSPORT/EXTTOPGLOROASAF/ on the 10th December, 2012. |
| [10] | Ghana news agency. (2010). Road accidents cost Ghana millions of dollars. Retrieved November 11, 2011, from Ghanaweb web site: http://ghanaweb.com/GhanaHomePage/News Archive/artikel.php?ID=182523. |
| [11] | Daily Graphic (2011), The Ghana Police, road carnage and vehicular criminality. Retrieved http://www.ghanaweb.com. Accessed on 7th February, 2011. |
| [12] | Global Road safety partnership “Road safety situation in Ghana (2010). http://www.grsproadsafety. Org/page – Ghana-21. (Accessed on September 2, 2011). |
| [13] | Agresti, A. (2007). “An Introduction to categorical data analysis.” 2nd Edition, John Wiley and Sons, Inc., New York. |
| [14] | Al-Ghamdi, A.S. (2002) Using Logistic Regression to Estimate the Influence of Accident Factorson Accident Severity, Accident Analysis and Prevention, Vol.34, 729-741. |
| [15] | Ameratunga S, Hijar M, Norton R (2006); Road-traffic injuries: confronting disparities to address a global-health problem. Lancet 2006; 367:1533–40. |
| [16] | Amoah, A. K. (2011): When road accidents sweep away Ghana’s resources. Retrieved http://thechronicle.com.gh/when-road-accidents-sweep-away-ghana%E2%80%99s-resources/ Accessed on June 21, 2011. |
| [17] | Asogwa SE (1992) .Road traffic accidents in Nigeria: a review and appraisal. Accid. Anal. Prev. 24:149–155. |
| [18] | Aworemi et al (2009): Analytical study of the causal factors of road traffic crashes in southwestern Nigeria Educational Research Vol. 1(4) pp. 118-124 May 2010Available online http://www.interesjournals.org/ERCopyright ©2010International Research Journals |
| [19] | Chang, H. and T. Yeh (2006). ―Risk factors to driver fatalities in single-vehicle crashes: comparisons between non-motorcycle drivers and motorcyclists.‖ Journal of Transportation Engineering, 132, 227-236. |
| [20] | Dissanayake, S. (2004) Comparison of Severity Affecting Factors Between Young and Older Drivers Involved in Single Vehicle Crashes, IATSS Research Vol.28 No.2, 48-54.Elliott, M.A., C.J. Baughan, and B.F. Sexton (2007). “Errors and violations in relation to motorcyclists’ crash risk”. Accident Analysis and Prevention, 39, 491-499. |
| [21] | Dandona, R., K.G. Anil, and D. Lalit (2006). ―Risky behavior of drivers of motorized two wheeled vehicles in India.‖ Journal of Safety Research, 37, 149–158. |
| [22] | Elliot, M.A., 2010. Predicting motorcyclists’ intentions to speed: Effect of selected ognitions from the theory of planned behaviour, self-identity and social identity. Accident Analysis and Prevention. 42(2): 718-725. |
| [23] | Elliot, M.A., C.J. Armitage and C.J. Baughan, 2003. Drivers’ compliance with speed limits: an application of the theory of planned behaviour, Journal of Applied Psychology, 88(5): 964-972. |
| [24] | Forward, S.E., 2009. The theory of planned behaviour: The role of descriptive norms and past behaviour in the prediction of drivers’ intention to violate, Transportation Research Part F. 12(3): 198-207.122012. |
| [25] | Hassenet at (2011): Risky driving behaviors for road traffic accident among drivers in Mekele city, Northern Ethiopia. BMC Res Notes. 2011; 4: 535. Published online Dec 13, 2011. doi: 10.1186/1756-0500-4-535. |
| [26] | Hashmi, Q. N., Qayyum, T.I. and Rehman, Z. (2012). Accident Prediction Model for Passenger Cars. Academic Research International .Accessed on www.Savap.Org.Pk. |
| [27] | Johnson, S.W. and J. Walker (1996). ―The Crash Outcome Data Evaluation System (CODES).‖ Technical Report. National Highway Traffic Safety Administration, United States Department of Transportation, Washington, D.C. |
| [28] | Lardelli-Claret et al. (2004): Driver dependent factors and the risk of causing a collision for two wheeled motor vehicles. InjPrev 2005;11:225-231 doi:10.1136/ip.2004.006957. |
| [29] | Dai, F. C. and Lee, C. F.: A spatiotemporal probabilistic modelling of storm-induced shallow land sliding using aerial photographs and logistic regression, Earth Surf. Proc. Land., 28, 527–545, doi:10.1002/esp.456, 2003. |
| [30] | Liu, L. and S. Dissanayake (2009). ―Examination of factors affecting crash severity on gravel roads.‖ Paper #09-0512, Transportation Research Board 88th Annual Meeting 2009, Washington, D.C. |
| [31] | Mohan D, Tiwari G. Road safety in low-income countries: issues and concerns regarding technology transfer from high-income countries. In: Reflections on the transfer of traffic safety knowledge to motorizing nations. Melbourne, Global Traffic Safety Trust, 1998:27–56. |
| [32] | Nassar, S. A., Saccomanno, F.F., & Shortreed, J.H. (1997). Integrated risk model (ARM) of Ontario. The 76th Annual Meeting, Transportation Research Board, Washington, D.C. |
| [33] | Obeng M R. (2008): Another look into road accidents in Ghana. Retrieved on 3rd September, 2011 from http://www. modernghana. Com/columnist/the Chronicle. |
| [34] | O'Hare, D., D. Chalmers, and P. Scuffham (2006). ―Case-control study of risk factors for fatal and non-fatal injury in crashes of rotary-wing aircraft.‖ Journal of Safety Research, 37, 293–298. |
| [35] | Peden M, Scurfield R, Sleet D, (2004), world Report on road Traffic injury prevention World Health organization. Retrieved on the 4th December 2011 from http://www.cdc.Gov/ncipc/rohd 2004.Geneva, Switzerland. |
| [36] | Pierce, Q. and Maunder, P. (1998) Road and Traffic Authority Statistical report “Road Traffic Accidents in NSW-1997” (Motor Accidents Authorities of NSW 1998). |
| [37] | Pickrell, M.T. and Starnes, M. (2008). ―An analysis of motorcycle helmet use in fatal crashes. National Highway Traffic Safety Administration, United States Department of Transportation, Washington, D.C. |
| [38] | Quddus, M.A., Noland, R.B., Chin, H.C.(2002) An Analysis of Motorcycle Injury and Vehicle Damage Severity Using Ordered Probit Models, Journal of Safety Research Vol.33, 445-462. Retrieved on the 10th October, 2012. |
| [39] | Reason et al. (1990): Errors and violations on the roads: a real distinction? Ergonomics 33 (10/11), 1315-1332. |
| [40] | Rodgers, G.B. (1997). ―Factors associated with the crash risk of adult bicyclists.‖ Journal of Safety Research, 28, 233-241. |
| [41] | Sabahaih and Fujii (2011): Motorcyclists I – Helmet Usage and Speeding Behavior from A Psychological Perspective. Australian Journal of Basic and Applied Sciences, 5(8): 1115-1120, 2011 ISSN 1991-8178. |
| [42] | Van K, Donald J (2001). Vehicular Accident investigation and Reconstruction. CRC Press LLC, Boca Roton, FL. |
| [43] | WHO, (2009), Pedestrians, cyclists among main road traffic crash victims. Half of 1.27 million people who die in road traffic crashes every year are pedestrians, motorcyclists and cyclists, finds new WHO study. News release accessed on http://www.who.int/mediacentre/news/releases/2009/road_safety_report_20090615/en/index.html. Retrieved on 14th November, 2011. |
| [44] | Yankson, I.K., Browne, E.N.L., Tagbor, H., Donkor, P., Quansah, R., Asare, G.E., Mock, C.N., Ebel, B.E., (2010); Reporting on road traffic injury: content analysis of injuries and prevention opportunities in Ghanaian newspapers. Downloaded from http//www. injury prevention.bmj.com on December 14, 2012 - Published by group.bmj.com |