Salifu Katara, Alhassan Faisal, Gideon M. Engmann
Department of Statistics, Faculty of Mathematical Sciences, University for Development Studies, Navrongo, Ghana
Correspondence to: Salifu Katara, Department of Statistics, Faculty of Mathematical Sciences, University for Development Studies, Navrongo, Ghana.
| Email: |  |
Copyright © 2014 Scientific & Academic Publishing. All Rights Reserved.
Abstract
We use an ARIMA model to forecast electricity demand in Tamale, Ghana. Tamale is one of the fastest growing cities in Africa, so public planning requires good forecasts of future demand. The study employed secondary data from the Northern Electricity Department Tamale, spanning from 1990 to 2013 and broken out as domestic, commercial and industrial electricity usage. In our analyses, ARIMA (1, 1, 3), ARIMA (1, 2, 1) and ARIMA (5, 1, 5) were selected to forecast domestic, commercial and industrial electricity demand, respectively. The proposed ARIMA models are used to provide a seven year forecast of the electricity demands in the city. Also, we observed that domestic and commercial demand were increasing more rapidly than demand in the industrial sector.
Keywords:
Electricity, Time series, ARIMA, Forecasting
Cite this paper: Salifu Katara, Alhassan Faisal, Gideon M. Engmann, A Time Series Analysis of Electricity Demand in Tamale, Ghana, International Journal of Statistics and Applications, Vol. 4 No. 6, 2014, pp. 269-275. doi: 10.5923/j.statistics.20140406.03.
1. Introduction
Electricity is a necessity in the modern world. Adequate power supply enables better public health and economic growth. Developing nations face special challenges in planning the power grid infrastructure to needed to support rapidly growing urban populations. In this paper, we use 23 years’ worth of data on increasing demand for electricity in Tamale, Ghana, broken out by sector, to forecast energy needs. This forecast should help city planners and the government of Ghana in building future prosperity.In Tamale, the available electricity is very inadequate, and the government and other stakeholders have been reacting to the situation, rather than planning how best to manage it. In large part this reflects the rapid growth of Ghana’s economy over the last several decades, and the increasing population of Tamale. Our analyses can help to provide a better sense of the electrical power Tamale will require in the near and middle term.
2. Time Series Analysis of Demand
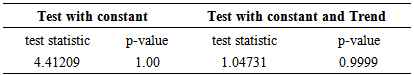
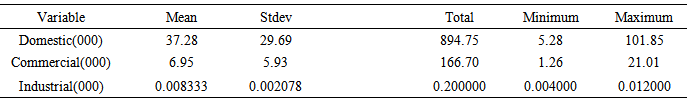
The electricity supply is frequently interrupted in Ghana and series of load shedding incidents have been experienced. Despite government intervention, the problem of meeting electricity demand has remained for over a decade. As Tamale is the fastest growing city in West Africa, the demand for electricity is certain to increase. Also, Ghana exports electrical power to neighboring countries, so good marketing will depend upon accurate forecasts of the supply that will be available for sale, and also the external demand. To address these kinds of questions, we use time series models fit to historical data. Demand forecasts are generally required for the expansion, control and scheduling of power systems. The forecasts help in determining the optimal mix of generating capacities and which devices to operate in a given period, so as to minimize cost and ensure supply even when local failures may occur in the system [11].In this study, we employed a popular method of time series forecasting; Autoregressive Integrated Moving Average (ARIMA). Electricity consumption recorded over a period of time at regular intervals is a typical time series modeling problem. An ARIMA model has provided successful forecasts in many other applications and provides models that are among the basic tools used for short term forecasts [11].For the 23 years of data used in this study, Table 1 shows the mean, standard deviation, total, maximum and minimum of the electricity consumption in Tamale for each of the three sectors. Note that the very low contribution from Industry, which reflects the underdeveloped manufacturing base.Table 1. ADF test for domestic demand
 |
| |
|
The time series plot above indicates that the demand follows an increasing trend and most of the points are not centred around zero. This implies that the demand series is not stationary and hence the need to perform an ADF test for further investigations.Since the p-value both with constant and with constant and trend are greater than 0.05 we fail to reject Ho and conclude that our series is not stationary. The ADF Test above confirms that our series is not stationary relating to the conclusions made respectively. Therefore we difference our series.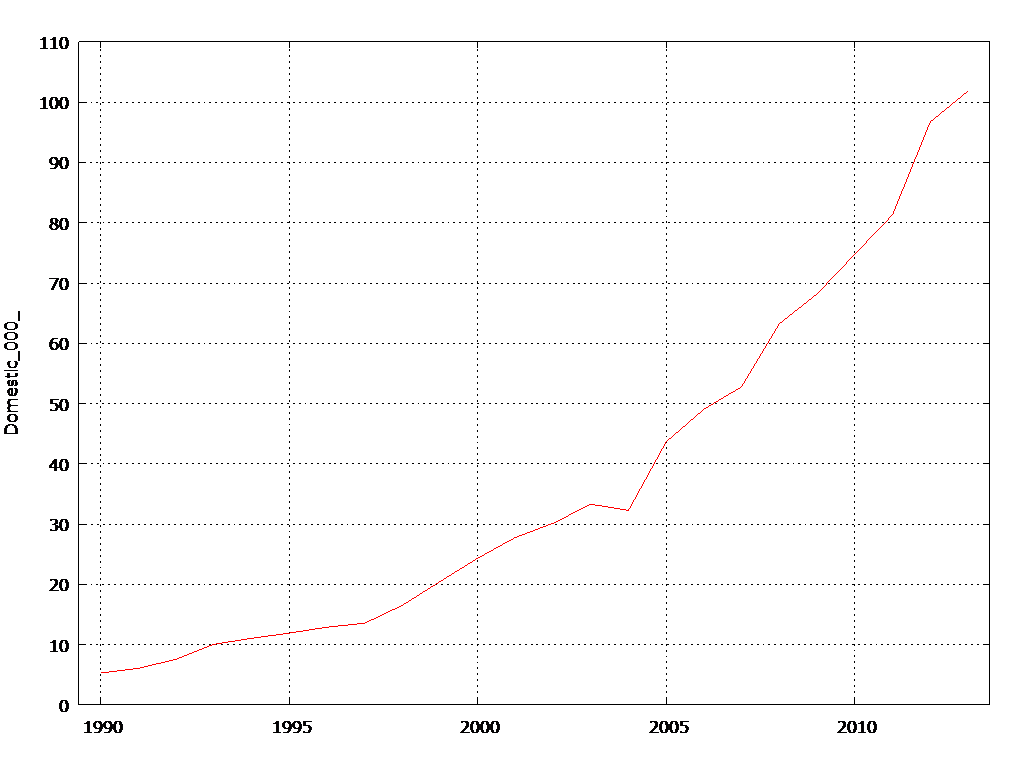 | Figure 1. Time Series Plot of Domestic Demand |
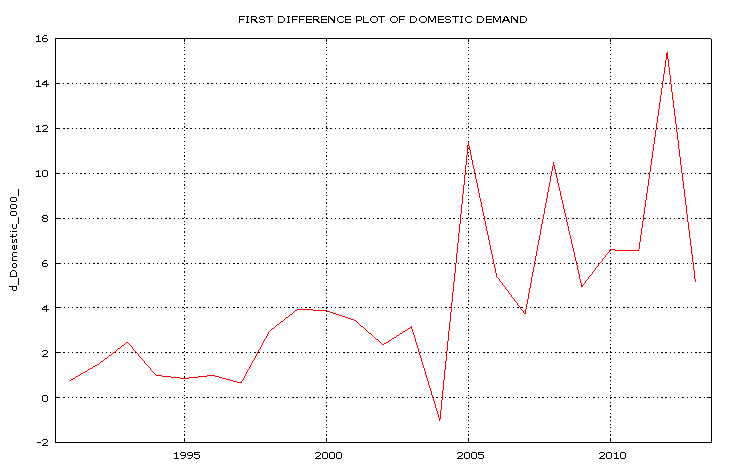 | Figure 2. Time Series Plot of First Difference of Domestic Demand |
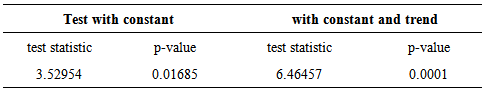
Table 2. ADF Test for First Difference Domestic Demand
 |
| |
|
Table 3. Descriptive statistics of electricity demand in Tamale
 |
| |
|
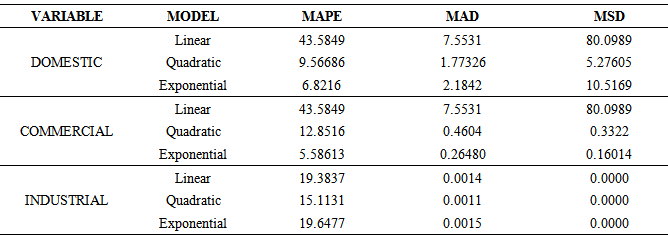
Table 4. Trend Models for Electricity Demand
 |
| |
|
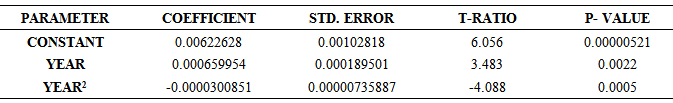
Table 5. Quadratic Trend model of Domestic Electricity Demand
 |
| |
|
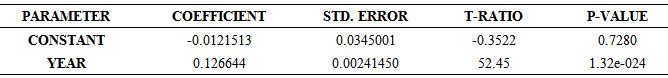
Table 6. Exponential Trend of the Commercial Electricity Demand
 |
| |
|
Table 7. Quadratic model of the Industrial Electricity demand
 |
| |
|
3. ARIMA Procedure
3.1. Domestic Electricity Demand
Figure 3 above provides a spike at lag 1 indicating an Autoregressive component of order one, AR(1) inthe PACF correlogram whiles the ACF correlogram indicates a spike at lag 1,2,3 and 4 representing a moving average process of order 1,2,3, 4 and 5; MA(1), MA(2), MA(3) and MA(4) for domestic electricity demand.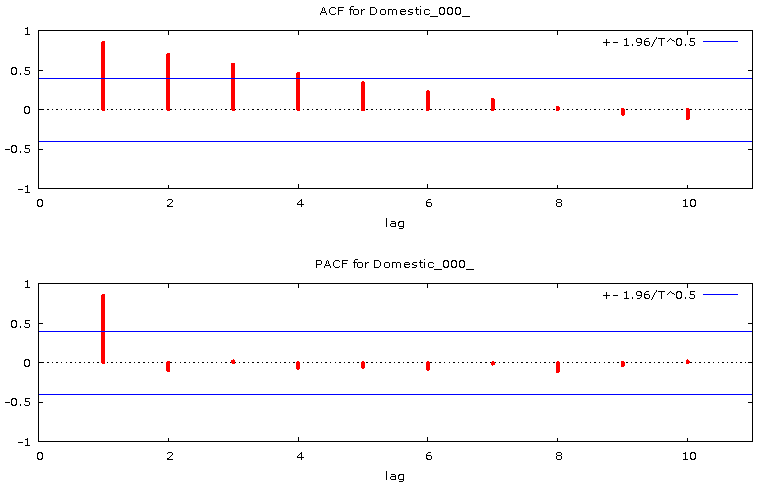 | Figure 3. PACF and ACF plot of Domestic Electricity Demand |
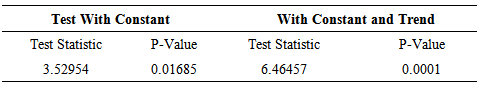
Table 8. ADF Test for First Difference Domestic Demand
 |
| |
|
The p-value obtained for both “with constant” and “with constant and trend” is less than 0.05. Hence it will be convenient to conclude that our series is stationary
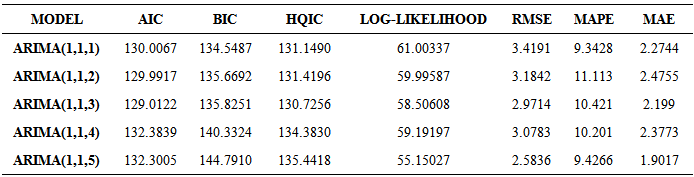
4. Model Selection
ARIMA (1, 1, 3) asindicated above is selected as the best model since it has the maximum log- likelihood, minimum AIC, BIC, HQIC, RMSE, MAPE and MAE. Hence the proposed ARIMA model for forecasting electricity demand in Tamale is given as 
Table 9. Selection of ARIMA model for Domestic electricity demand
 |
| |
|
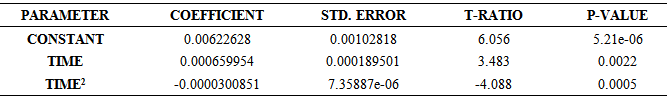
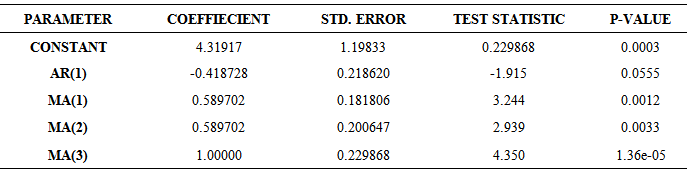
5. Parameter Estimation
5.1. Domestic Electricity Demand
From the parameters estimated, the formulated ARIMA equation becomes; 
Table 10. ARIMA (1, 1, 3) Final Estimates of Parameters
 |
| |
|
6. Model Diagnostic
Diagnostic checks are performed on the residuals to see if they are randomly and normally distributed and also to check whether the model is reasonable to fit the data or not. A residual plot of the ACF and the PACF plot determine how significant or insignificant the distributions of the residuals are by indicating with lags within the confidence intervals.
6.1. Domestic Electricity Demand
From Figure 4&5 below, the residual ACF and PACF plot below shows that the residuals are within the 95% confidence interval indicating that the residuals are insignificant.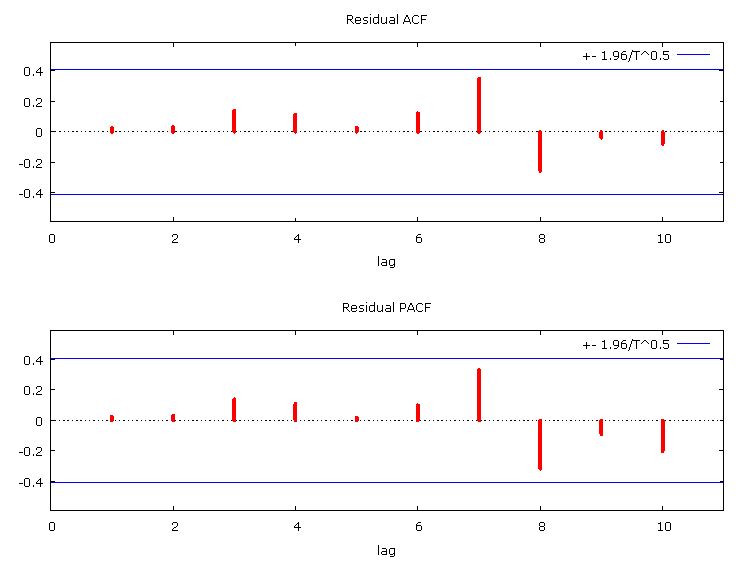 | Figure 4. ACF and PACF plot of Residuals for Domestic electricity demand |
 | Figure 5. Forecast Plot for Commercial Electricity Demand |
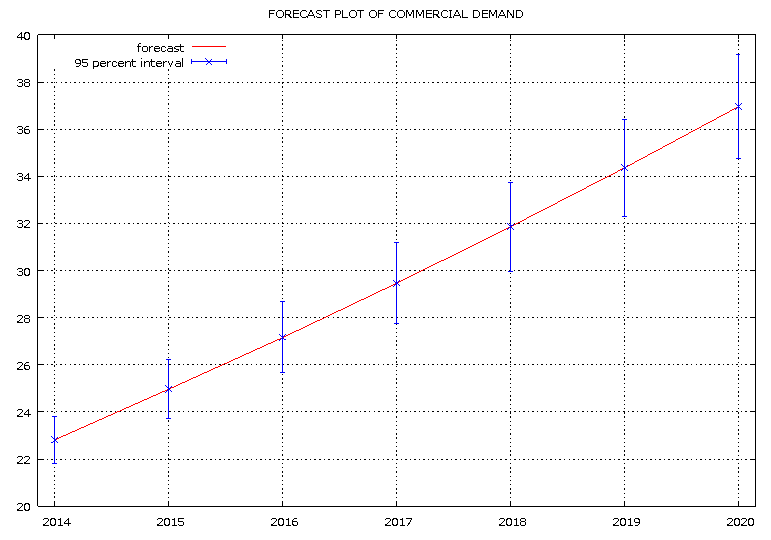
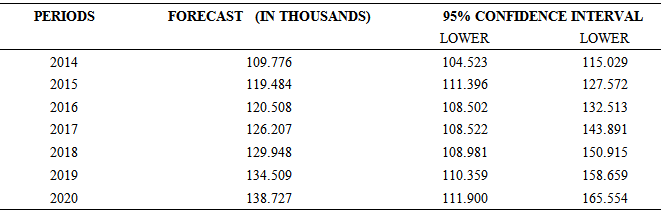
7. Forecasting with ARIMA Model
From the above diagnosis test, the proposed ARIMA models for Domestic, Commercial and Industrial electricity demand can be said to be the best in terms of forecasting for electricity demand in Tamale. ARIMA models are basically developed to forecast the corresponding dependent variable. There are two types of forecasts: sample period forecasts and post sample period forecasts. The post sample forecast is used to develop confidence interval in the model and the post sample forecast is used to generate genuine forecasts for planning and other purposes.Table 11. Domestic Electricity Demand Forecasted for the Periods of 2014 and 2019 at 95% Confidence Interval
 |
| |
|
The table above shows the values of the forecast of domestic electricity demand from 2014 to 2020. The given upper and lower limits indicate the range with which the forecast values can extend or reduce to respectively. The forecast values were generated by the help of the selected ARIMA model; ARIMA (1, 1, 3). By comparing the magnitudes of the forecast values, it can be observed that there is a significant increase from 2014 down to 2020, indicating a relative increase in the demand of electricity with time for the domestic sector.The above diagram is a graphical representation of the trend of forecast demand from 2014 to 2020. From the graph, we can observe that the trend line increase with time. This clearly is an indication of an increase in the demand of electricity from 2014 to 2020
8. Summary, Conclusions and Recommendations
This work uses an ARIMA model to forecast yearly electricity demand in Tamale. Data obtained from NEDCO grouped consumers into domestic, commercial and industrial categories. This made it necessary to generate different models to forecast demand from each category.Using standard methods for selecting the order of a time series, we found that an ARIMA (1, 1, 3) model provided the best fit for consumer demand. Similarly, the commercial demand was best described by an ARIMA (1, 2, 1) model and industrial demand was best described by an ARIMA (5, 1, 5) model. Model diagnostics showed that all of the residuals appeared to be random and normally distributed, as one wants. This confirms that the selected models are appropriate. The proposed model was then used to forecast seven years forecast of the various electricity demand, ranging from 2014 to 2020.A forecast plot of the various electricity demand showed that the domestic and commercial electricity demand increases with time while the industrial demand grows much more slowly. The industrial demand showed a decreasing trend from 2014 to 2016, followed by a steady increase from 2016 to 2019 and then a slight decrease in 2020.Based on the results of the study, we can conclude that ARIMA (1, 1, 3), ARIMA (1, 2, 1) and ARIMA (5, 1, 5) can be appropriate to forecast domestic, commercial and Industrial electricity demand in Tamale. The forecasts suggest that significant growth in domestic and commercial electricity demand can be expected in Tamale for the year 2014 to 2020. The forecast growth in domestic and commercial electricity demand is consistent with the increase in population and the increasing economic activity in the city. The city become the site of many companies in Ghana and this has helped to drive its significant growth. The forecast obtained from the industrial electricity demand is consistent with the fact that there is little heavy industry in Tamale. Based the findings, it is recommend among others that;1. There must be an expansion of electricity supply system to meet the increasing demand in Tamale.2. With increasing numbers of companies in the city, we recommend solar energy as analternative source of electrical power for the commercial sector.3. As increasing population is accompanied by increased electricity demand, we recommend an expansion of the energy supply system to meet the growing metropolitan needs.
References
| [1] | Ariffin, S., Kann, A. and Alwi, A. S (2013). Electricity load forecasting in UTP using Moving Averages and Exponential Smoothing Techniques. |
| [2] | Chikobvu, D. and Sigauke, C. (2010). Daily peak electricity load forecasting in South Africa a multivariate non-parametric approach. Retrieved from http//www.orssa.org. |
| [3] | Ching-Lai,H., Watson, S.V and Majithia, S. (2005). Analysing the impact of whether variables on monthly elelctrcity demand. Pp:20 I.E.E.E transaction on power system. |
| [4] | Ergogdu, E. (2007). Elelctricity demand analysis using co-integration and ARIMA modeling. A case study in Turkey. Munich personal RePECArchvie. |
| [5] | Gam, I. and Ben Rajeb, J. (2012). Electricity demand in Tunisia. pp: 714-720 Energy policy. |
| [6] | Gupta, A., Sharma, A.K. and Shama, U. (2013). To forecast the future demand of electrical energy in India by autoregressive integrated moving average and exponential methods. Pp: 199-205. International jounal of advanced research in engineering andtechnology. (IJARET). |
| [7] | Hassan, S. N., Ahmad, H. M., Suhartono, and Mohamed N. (2012). A comparison of the forecast performance of double seasonal ARIMA and double seasonal ARFIMA models of electricity load demand. Pp:6705-6712. Applied mathematical sciences. |
| [8] | Henao, V.J.D., Mejia, V.M.R. and Cardona, C.J. (2012). Electricity demand forecasting using seasonal autoregressive integrated moving average multiplicative single neuron hybrid model.http://www.redalyc.org |
| [9] | Kocavelioğlu, M. (2013). Short term electricity demand in Turkey. |
| [10] | Kotillova’, A. (2011). Very short term load forecasting using Exponential Smoothing models. Pp: 85. Journal of information, control and management |
| [11] | Mati, A.A, Bajoga, B. G, Jimoh, B., Adegboye, B. A and Dajoh, D. D. (2009). Electricity demand forecasting in Nigeria using time series analysis model. Pp: 479.The pacific journal of Science and Technology. |
| [12] | Obok, A., Andrson, G.O and Yanev, K.M (2008). Electricity demand forecasting towards vision 2016 for Botswana using decomposition (multiplicative) time series model. International journal of power and energy system. |
| [13] | Parkpoom, S. and Harrison, G. P. (2006). Using whether sensitivity to forecast Thailands electricity demand. Phuket, Thailand. International conference on energy for sustainable development issues and prospect for Asia. |
| [14] | Rahman, S.A., Noor, M. A. and Khalid, K. (2005). Comparison of time series methods for electricity forecasting. A case study in Perlis. ICOQSIA. |
| [15] | Ringwood, J. V., Bofelli, D. and Murray, F. T. (2011). Forecasting elelctricity demand on short, medium and long time scales using neural networks. Pp: 129-147. Journal of intelligent and robotic system. |
| [16] | Saravanan, S., Kannan, S. and Thangaraj, C. (2012). Indiaselelctricity demand forecast using Regression Analysis and Artificial Neural networks based on Principal Component Analysis. Pp: 365-366.ICTACT Journal on soft computing. |
| [17] | Suhartono, Ishamail, Z., Ahmed, M. H and Mohamed, N. (2010). Double seasonal ARIMA model for forecasting load demand. Pp:217. Mathematika. |
| [18] | Taylor, J.W. and Buizza R. (2002). Neural network load. Forecasting with weather ensemble predictions. IEEE transaction on power system. Pp: 626-632. |
| [19] | Taylor, J. W., De Menzes, M. L. and Mcsharry, P. E. (2006). A comparison of univariate methods for forecasting electricity demand up to a day ahead. Pp:1-16. International journal for forecasting. |
 Abstract
 Reference
 Full-Text PDF
 Full-text HTML