-
Paper Information
- Next Paper
- Paper Submission
-
Journal Information
- About This Journal
- Editorial Board
- Current Issue
- Archive
- Author Guidelines
- Contact Us
International Journal of Statistics and Applications
p-ISSN: 2168-5193 e-ISSN: 2168-5215
2014; 4(6): 241-248
doi:10.5923/j.statistics.20140406.01
Identification of Outliers in Medical Diagnostic System Using Data Mining Techniques
 Abstract
 Reference
 Full-Text PDF
 Full-text HTML
V. Deneshkumar, K. Senthamaraikannan, M. Manikandan
Department of Statistics, Manonmaniam Sundaranar University, Tirunelveli, India
Correspondence to: V. Deneshkumar, Department of Statistics, Manonmaniam Sundaranar University, Tirunelveli, India.
| Email: |  |
Copyright © 2014 Scientific & Academic Publishing. All Rights Reserved.
The outlier detection problem has important applications in the field of medical research. Clinical databases have accumulated large quantities of information about patients and their medical conditions. In this study, the data mining techniques are used to search for relationships in a large clinical database. Relationships and patterns within this data could provide new medical knowledge. The main objective of this paper is to detect the outliers and identify the influence factor in the diabetes symptoms of the patient using data mining techniques. Results are illustrated numerically and graphically.
Keywords: Data mining, Outlier detection, Diabetes, PCA and refined method
Cite this paper: V. Deneshkumar, K. Senthamaraikannan, M. Manikandan, Identification of Outliers in Medical Diagnostic System Using Data Mining Techniques, International Journal of Statistics and Applications, Vol. 4 No. 6, 2014, pp. 241-248. doi: 10.5923/j.statistics.20140406.01.
1. Introduction
- Outlier detection is a very important concept in the medical data analysis. The complex relationships that appear with regard to diabetic symptoms of the patient, diagnoses and behavior are the most promising areas of data mining. A data base may contain data objects that do not comply with the general behavior of the data. These data objects are outlier and the analysis of outlier data is referred to as outlier mining. Data mining is about finding new information from a large group of data. The problem of outlier detection for data mining is a rich area of research because the sequences are various types and outliers in sequences can be defined in multiple ways and hence there are different problem formulations. Most data mining methods discard outliers as noise or exceptions. The handling of outlier observations in a data set is one of the most important tasks in data pre-processing because of two reasons. First, outlier observations can have a considerable influence on the results of an analysis. Second, outliers are often measurement or recording errors, some of them can represent phenomena of interest, something significant from the viewpoint of the application domain. Some classical examples for inward procedures have given Hawkins [12] and Barnett and Lewis [2].Factor Analysis is useful for understanding the underlying reasons for the correlations among a group of variables. The main application of factor analytic technique is to reduce the number of variables and to detect structure in the relationships among variables that classify variables. A small number of common factors are extracted so that these common factors are sufficient to study the relationship of original variables. The difficulties are having too many independent variables in such exercise that increases computational time to get solution, increased time in data collection, too much expenditure in data collection, presence of redundant independent variables, difficulty in making inferences, these can be avoided using factor analysis. Gnanadesikan and Kettenring [6] discussed outlier detection in multivariate analysis and pointed out some of the problems. Hadi [7, 8] has addressed multivariate outlier detection problem to replace the mean vector by a vector of variable medians and to compute the covariance matrix for the subset of those observations with the smallest Mahalanobis distance. Penny and Jolliffe [18] have discussed a comparative study with six multivariate outlier detection methods. Bellazzi and Zupan [3] have discussed the new computational methods for data analysis and predictive modeling for clinical prediction problems. Hardin and Rocke [10] have developed a new method for identifying outliers in a one-cluster setting using an F distribution. They extended the method to the multiple cluster case which gives a robust clustering method in conjunction with an outlier identification method. They provided results of the F distribution method for multiple clusters which have different sizes and shapes. Lavrac [15] has discussed the selected data mining techniques applied in medicine and in particular some machine learning techniques including the mechanisms that make them well suited for the analysis of medical databases. Wasan et al., [21] have discussed the impact of data mining techniques, including artificial neural networks for medical diagnostics. Ordonez et al., [16] have discussed the association rule used in the medical domain, where data sets are generally high dimensional and small. Experiments focus on discovering association rules on a real data set to predict absence or existence of heart disease. Petoskey [19] has discussed outlier detection algorithms used in data mining systems and also explained their advantages and disadvantages. Parsons and Haque [17] have surveyed various subspace clustering algorithms along with a hierarchal algorithm by their characteristics. The proposed approach takes advantage of the unique characteristics of the data in this domain and provides a solution which is fast, scalable and produces high quality recommendations. Hodge [13] has surveyed the contemporary techniques for outlier detection and identified their respective motivations and distinguished their advantages and disadvantages. Ahmad and Dey [1] have proposed a modified k-mean algorithm for clustering mixed data sets. They also proposed a modified representation for the cluster center. The similarities of categorical attributes are calculated based on the proportion of items appearance. Koufakou and Georgiopoulos [14] have proposed a fast distributed outlier detection strategy intended for datasets containing mixed attributes. Chaira [4] has discussed a novel approach to intuitionistic fuzzy clustering using intuitionistic fuzzy set theory and showed its efficacy. This algorithm was tested on several CT scan brain images and the results were observed to be far better as compared to Type 2 fuzzy and conventional fuzzy C- means algorithm. Hauskrecht et al., [11] have developed and evaluated a data driven approach for detecting unusual patient management decisions using past patient cases stored in electronic health records (EHRs). This approach is capable of identifying clinically valid outliers at reasonably high true positive alert rates across a broad range of clinical conditions and patient management actions. Chrominski et al., [4] have discussed the use of different methods of outlier detection in medical diagnosis. Srimani et al., [17] have discussed outlier detection statistical methods in the application medical data set. The importance of outlier detection is due to the fact that outliers in data predict significant information in a wide variety of medical and other application domains. The information of medical data base has been chosen for this study, the information regarding the diabetic symptoms of the patient’s details are collected. The objective is to detect the outliers and identify the influence factor of the diabetes patient using Factor analysis in which refined approach is used to detect the outliers in large clinical database.
2. Methodology
- Factor analysis attempts to model the variance of an original set of variables by decomposing their variability into common and unique variance. The common variance or communality
 of a given manifest variable is the proportion of its variance that is accounted by the common factors’ of the hypothesized latent structure. The unique variance
  of a given manifest variable is the proportion of variance that is unaccounted by the common factors [9]. The general factor model has the following form.
 | (1) |
 The jth variable (j=1,2,3….p),
 Factor loading of the jth common factor,
 The kth common factor,
 Number of common factors (k=1,2,3…m),
 The unique variance of the jth variablePrincipal Component AnalysisPrincipal component analysis is a multivariate statistical technique to identify or discover the underlying structure characterizing a set of highly correlated variables
  . The principal components are extracted so that the first component accounts for the largest amount of total variation in the data, the second principal component accounts for the second largest amount of total variation and so on. A principal component which is a linear combination of set of variables has the following form
 | (2) |
 Linear composite of jth component (j =1, 2,…p number of variable).
 The principal component loading of jth variable.
 jth Variable.In principal component analysis, the number of principal components extracted is the same as the number of variables describing the dimensionality of the data. If a data set is characterized by ten variables, principal component analysis of the data would generate ten principal components. The most important issue in principal component analysis is the number of principal components to retain for further analysis.Varimax RotationA varimax rotation is a change of coordinates used in principal component analysis and factor analysis that maximizes the sum of the variances of the squared loadings.
  | (3) |
 is the loading of the ith variable on the jth factor after rotation, where
  is the communality for variable i. The Varimax procedure, selects the rotation to find this maximum quantity. The sample variances of the standardized loadings for each factor, summed over the m factors.
 | (4) |
 | (5) |
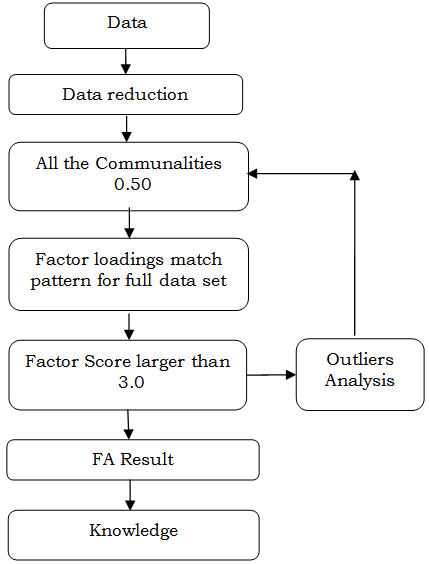 | Figure 1. Flow Chart for the Model |
3. Result and Discussion
- Outlier detection in the medical and public health domains typically work with patient records. The data can have outliers due to several reasons such as abnormal patient condition or instrumentation errors or recording errors. Thus the outlier detection is a very critical problem in this domain and requires high degree of accuracy. in this work we have analyzed the records which may have several different types of features such as patient age, height, weight and blood group.The Kaiser-Meyer-Olkin (KMO) measure of sampling adequacy is an index used to examine the appropriateness of factor analysis. From the table 1 Kaiser-Meyer-Olkin measure of sampling adequacy value 0.632 indicates factor analysis is appropriate.
| |||||||||||||
|
| ||||||||||||||||||||||
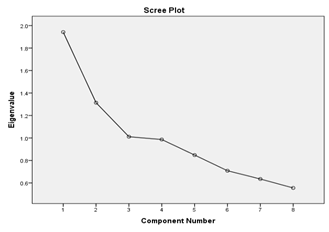 | Figure 2. Scree Plot |
|
 | Figure 3. Model Summary and cluster quality |
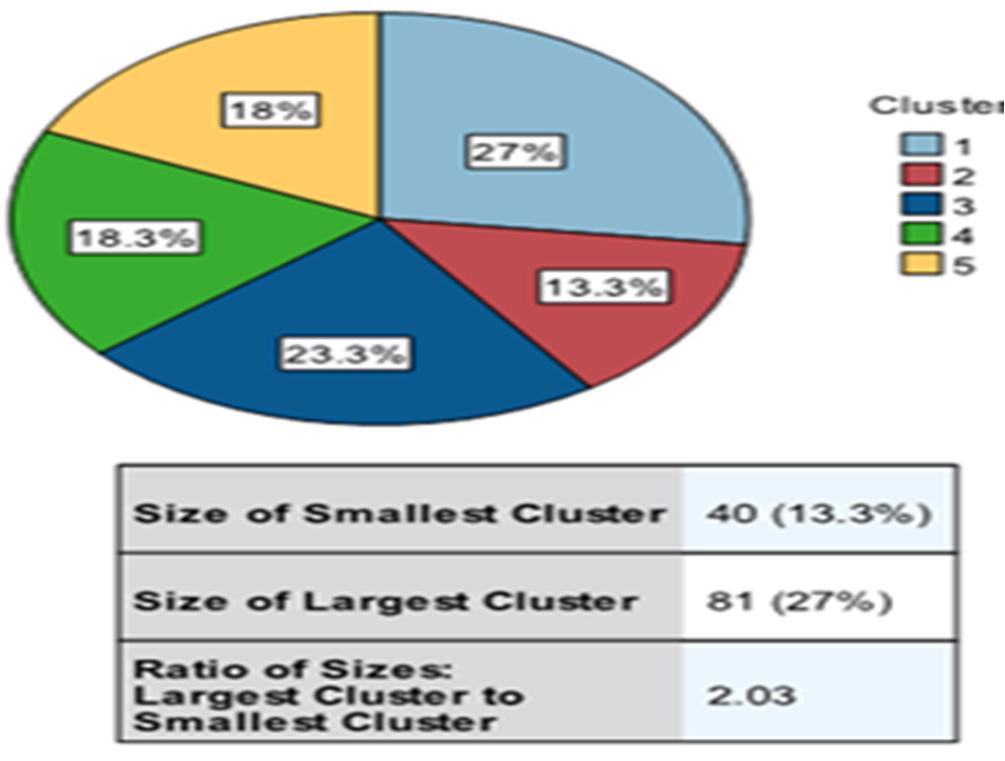 | Figure 4. Model Summary |
 | Figure 5. Cluster Distribution |
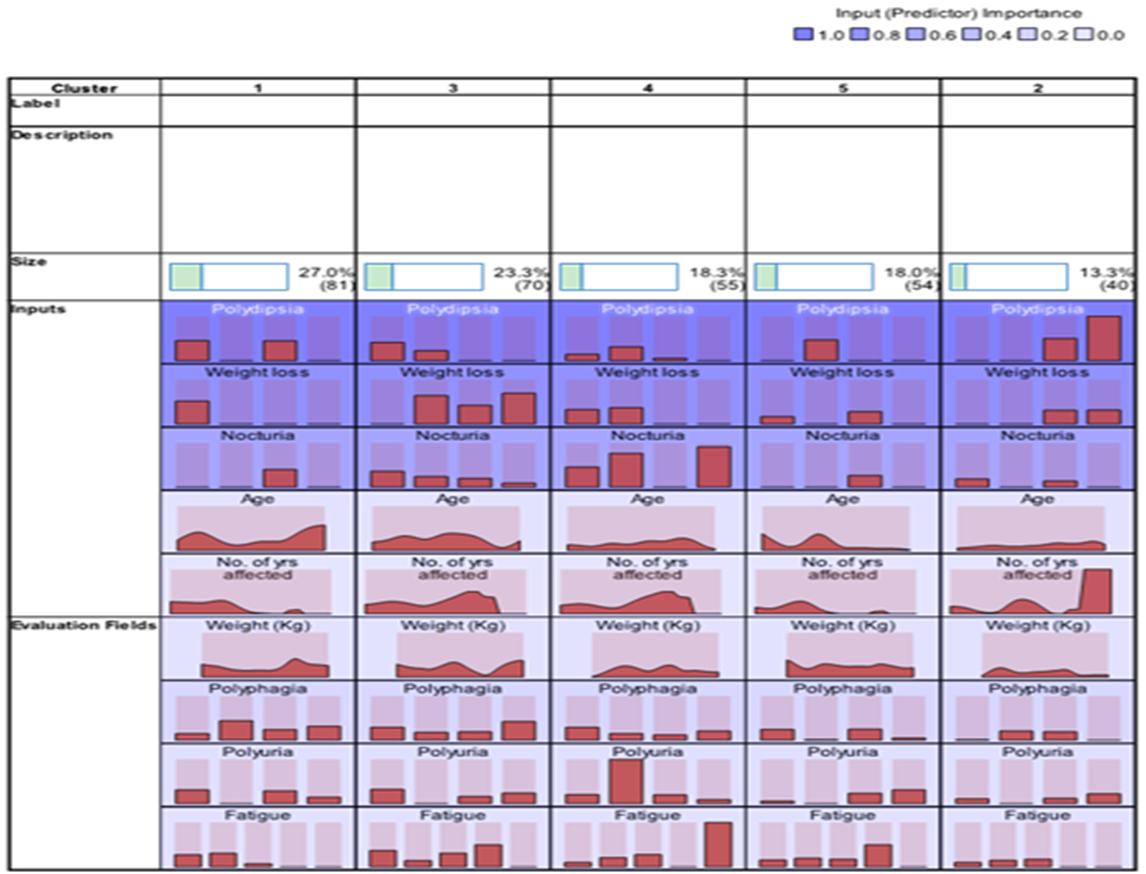 | Figure 6. Cluster Structure |
 | Figure 7. Cluster Preference |
4. Conclusions
- The proposed outlier detection method for determining complex associations that influence medical outcomes by combining data mining with the patient record merits for further study. The complete sets of interdependent relationship are examined and the size of the medical data from ten variables to three components is reduced by using Factor analysis with principal components extraction. Three factors were identified for further exploration and this implies that detection of outliers in medical data applying data mining technique is more powerful and provided accurate extraction results. The process helps to the medical decision makers to provide better, consistent and efficient healthcare services.
ACKNOWLEDGEMENTS
- The first author thanks the University Grants Commission, New Delhi for providing research fellowship under the scheme of BSRF to carry out this work.
References
| [1] | Ahmad, L., and A. Dey (2007): K-Mean Clustering Algorithm for Mixed Numeric and Categorical Data. Data & Knowledge Engineering, Vol. 63, pp. 503-527. |
| [2] | Barnett, V., and T. Lewis (1984): Outliers in Statistical Data, John Wiley & Sons, New York. |
| [3] | Bellazzi, R., and B. Zupan (2008): Predictive data mining in clinical medicine: Current issues and guidelines. International Journal of Medical Informatics, Vol 77, No.2, pp. 81–97. |
| [4] | Chaira, T. (2011): A Novel Intuitionistic Fuzzy C-Means Clustering Algorithm and Its Application to Medical Images. Applied Soft Computing, Vol.11, pp.1711–1717. |
| [5] | Chrominski, K., and M. Tkacz (2010): Comparison of outlier detection methods in biomedical data. Journal of medical Informatics & Technologies, vol.16, ISSN 1642-6037. |
| [6] | Gnanadesikan, R., and J. R. Kettenring (1972): Robust estimates, residuals, and outlier detection with multi-response data. Biometrics, Vol. 28, pp 81-124. |
| [7] | Hadi, A.S., (1992): Identifying multiple outliers in multivariate data, Journal of the Royal statistical Society. Series B, Vol. 54, pp. 761-771. |
| [8] | Hadi, A. S., (1994): A Modification of a Method for the Detection of Outliers in Multivariate Samples. Journal of the Royal Statistical Society. Series B, Vol.56, No.2. |
| [9] | Hair, J. F., Black, J., Babin, W. C., Anderson, B. J., and R. L. Tatham (2006): Multivariate Data Analysis. 6th ed. New Jersey: Prentice Hall. |
| [10] | Hardin.J and D.M. Rocke., 2002, Outlier detection in the multiple cluster setting using the minimum covariance determinant estimator, Computational Statistics & Data Analysis, 44, 625 – 638. |
| [11] | Hauskrecht, M., Batal, I., Valko, M., Visweswaran, S., Cooper, G.F., and G. Clermont (2013): Outlier Detection for Patient Monitoring and Alerting. Journal of Biomedical Informatics, Vol.46, pp.47–55. |
| [12] | Hawkins, D.M., (1980): Identification of Outliers, Chapman and Hall. |
| [13] | Hodge, V.J. (2004) A survey of outlier detection methodologies, Kluver Academic Publishers, Netherlands, January, 43. |
| [14] | Koufakou, A., and M. Georgiopoulos (2010): A Fast outlier Detection Strategy for Distributed high-Dimensional Data sets with Mixed Attributes. Data Mining and Knowledge Discovery, Vol.20. pp. 259–289. |
| [15] | Lavrac, N. (1999): Selected Techniques for Data Mining In Medicine, Artificial Intelligence in Medicine, Vol 16, No. 1, pp. 3–23. |
| [16] | Ordonez, C., Ezquerra, N., and C. A. Santana (2006): Constraining and summarizing association rules in medical data, Knowledge and Information Systems, Vol.9 (3), pp.259–283. |
| [17] | Parsons L., Haque, E. H. Liu, (2004): Subspace Clustering for high Dimensional Data: a Review, SIGKDD Explorations Vol.6(1), pp.90–105. |
| [18] | Penny, K.I., and I.T. Jolliffe (2001): A Comparison of Multivariate Outlier Detection Methods for Clinical Laboratory Safety Data, Journal of the Royal statistical Society. Series D (The Statistician), Vol. 50, No. 3, pp. 295-308. |
| [19] | Petrovskiy, M.I. (2003) Outlier Detection Algorithms in Data Mining Systems, Programming and Computer Software, Vol.29, No.4, pp.228–23. |
| [20] | Srimani.P.K and Sanjay Koti.M., (2011): Application of Data Mining Techniques For outlier mining in Medical Databases, International Journal of Current Research, Vol. 33, No. 6, pp.402-407. |
| [21] | Wasan, K.S., Bhatnagar, V., and H. Kaur (2006): The Impact of Data Mining Techniques on Medical Diagnostics, Data Science Journal, Vol 5, No.19. pp.119-126. |