Dismas Ntirampeba1, Owen P. L. Mtambo1, Birgit Erni2, Francesca Little2
1Department of Mathematics and Statistics, Polytechnic of Namibia, Windhoek, Namibia
2Department of Statistical Sciences, University of Cape Town, Cape Town, South Africa
Correspondence to: Dismas Ntirampeba, Department of Mathematics and Statistics, Polytechnic of Namibia, Windhoek, Namibia.
| Email: |  |
Copyright © 2014 Scientific & Academic Publishing. All Rights Reserved.
Abstract
Most of the studies have concentrated on univariate non-linear mixed effects modelling to analyse a single growth response instead of multivariate non-linear mixed effects modelling to analyse multiple growth responses simultaneously. In this study, in addition to univariate modelling, we simultaneously analysed six body features (mass, bill, tarsus, wing, body, head and foot) of Swift tern chicks using multivariate modelling. Firstly, we fitted univariate inverse exponential, Gompertz, logistic and Richards non-linear mixed effects models to each of the six body features. Secondly, we fitted multivariate inverse exponential, Gompertz, logistic and Richards non-linear mixed effects models to all of the six body features simultaneously. Data used in this study was supplied by the Avian Demography Unit (Department of Statistical Sciences, University of Cape Town). To analyse the data we used nonlinear mixed effects (nlme) package in R. An R package is a free software programming language with international comprehensive archive network support for various statistical computing and graphing methods. It was found that the univariate inverse exponential models were most appropriate to describe the growth of four of the six body features. The multivariate logistic model gave the best model to describe the growth of all body features taken simultaneously. It was shown that the growth of Swift Tern chicks occurs in the following order: (tarsus, foot)-(body mass, bill, head)-wing.
Keywords:
Non-linear mixed effects, Univariate models, Multivariate models, Autoregressive correlation, Compound symmetry
Cite this paper: Dismas Ntirampeba, Owen P. L. Mtambo, Birgit Erni, Francesca Little, Modeling Growth Patterns of Swift Terns Using Non-Linear Mixed Effects Models, International Journal of Statistics and Applications, Vol. 4 No. 5, 2014, pp. 224-232. doi: 10.5923/j.statistics.20140405.02.
1. Introduction
Measurements of size of an individual or an object, or a population are often collected on several occasions in order to determine how fast is the growth or how the growth is influenced by various treatments or other covariate characteristics. The resulting data set is usually referred to as longitudinal data or is sometimes known as growth data [1]. In growth studies, the knowledge of the age of each individual is essential information for growth analysis. However, in studies on birds it may not always be possible to follow all chicks from their hatching days. In this study, the exact age of most chicks was unknown, but a small portion of the sample was followed from nestling up to the end of the study period. This leads to necessity of estimation of age of the chicks whose age was unknown. The analysis of growth data can be done by using models of growth curves, which are equations describing the increase and/or decrease of the size of a specific feature of an individual against time [2]. In recent years, non-linear mixed effects models have become an important tool for growth models and are applied in different fields such as forestry, agriculture, ecology, biomedicine, sociology, economics and other areas. Most of the studies have concentrated on univariate non-linear mixed effects modelling to analyse a single growth response variable, very few studies have looked at fitting simultaneously non-linear mixed effects models to multiple responses [3]. In this study we have followed the univariate non-linear mixed effects models, as described by [4], to describe each of the six body features. To describe the growth of all features simultaneously, we have used a simple approach that allows a straightforward comparison of growth between the different body features. Similar analysis were also done to Grey-headed gulls, though are not presented in this paper.
2. Data and Methods
2.1. Data
The swift tern (Sterna bergii), also known as greater crested tern, is a nomadic seabird species dispersed around the southern African coastlines (Namibia, Angola, South Africa and Mozambique) [5, 6]. The data set used in this study consists of measurements of body mass (grams), wing length (mm), foot length (mm), head length (mm) and culmen length (mm) of Swift Tern chicks taken on several unequally spaced occasions during the period of May to July 2001 at Robben Island. Chicks were not all measured from day of hatching. From a sample of 253 chicks only 34 chicks were followed from nestling stage, others were first captured when they were already runners.
2.2. Methods
Due to nature of the data (age unknown for some chicks), we have first estimated age by fitting the growth curve, obtained from birds with known age, to the mass measurements of the chick with unknown age as described below.
2.2.1. Age Determination Method
The age determination method is based on the following assumptions: 1. Body mass was used because this feature exhibits quite often a strong correlation with time. 2. Asymptotes were assumed to vary between birds since it is naturally unlikely that all birds have the same maximum mass even if their lower asymptotes were the same at hatching, and other growth parameters ( the time at which the mass reaches half of the asymptote and β the time elapsed between mass reaching half and approximately 3/4 of the asymptotic mass). For the 34 nestling birds we assumed that age at first capture
  was two days. We then fitted a logistic model to body mass for these nestling birds:
 | (1) |
We then fixed  ,
,  and
and  at the estimates generated from the equation 1. Then, for each of the runner birds, we found the logistic curve which fitted the observed measurements most closely by minimizing the sum of absolute residuals to the observed values (Figure 1) and by assuming that the growth rate parameters (
 and
and  ) were equal for birds and that individuals should only differ in their asymptotic weights (i.e. allowed the asymptote
  to differ from
  by adding
  . Also, we allowed the age to differ from time 0 (day at first capture).
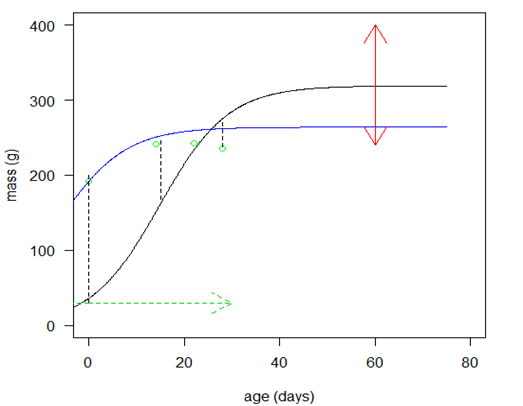 | Figure 1. Predicted curve for nestling bird masses (black line) and the optimized curve for bird number 199 (blue line), arrows indicate the ranges over which  and and  were allowed to vary were allowed to vary  and and  for this bird for this bird |
The growth curve for runners can then be described as in equation 2. | (2) |
where  is the body mass for bird i measured at age t,
  is the difference in asymptotes compared to
  and
and  is the actual age at first capture (days). The purpose was to determine
  , which quantifies the age of the bird at day zero (first capture for the particular bird). We used the “optim” function in R [7] to estimate
  .
.  and
and  were constrained to lie between
  and
and  , respectively. The impact of changing these bounds was assessed and similar estimates were found for all intervals. Age at each occasion was then calculated as
  . Then
  (growth measurements for each growth feature) was modelled against
  .
.
2.2.2. Non-linear Mixed Effects Models: Model Formulation and Assumptions
For univariate non-linear mixed effects models, we followed the formulation in [4]. To model multiple responses, we have used an alternative approach to one presented by [3, 4]. We assumed that all responses follow the same structural model. We formulated our model as follows: Let  denote response k for individual i taken at occasion
  with
with  (
( is the number of individuals measured for response k),
  (
( = number of observations on individual i for response k), and
  (R = number of responses). Let us combine repeated observations for each individual
  , relating to a specific response k, into a
  vector
 and further concatenate all vectors relating to all observations for R response variables for each individual in
  vector
  where
where is the number of measurements for individual i over all responses at all occasions. Similarly we form a vector of occasions
  . We distinguished measurements from different response variables by adding a categorical response covariate to the model. So for R responses, we define a r-level factor variable that indicates the specific response that generated each measurement. This is incorporated into the model using dummy variables that compare measurements from
  responses to measurements from the chosen reference/baseline response. The model formulation becomes:
 | (3) |
where  , is a
  vector of parameters to estimate, and
 ,
,  ,
,  where
where  is an indicator variable equal to 1 if response variable equals r, 0 elsewhere (except for
  where
where  ),
),  are differences in parameter values compared to parameter values of baseline response (response variable 1), and
  is a random effect associated with parameter
 for individual i .
  is the variance-covariance structure for intra-individual variation as described by [4].
3. Results
3.1. Age Determination
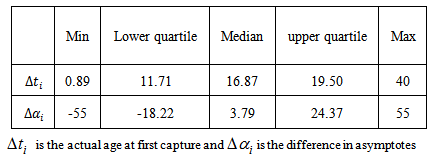
The summary estimates of  and
and  using the optimisation method were as shown in the Table 1. We observed that the actual ages of the 219 (253-34) birds were between 0.89 days and 40 days with 50% younger than 16.87 days.
Table 1. Summary statistics for estimates of
 and and
 for Swift Terns, using bounds of ±55 for asymptote and ±30 for age for Swift Terns, using bounds of ±55 for asymptote and ±30 for age
 |
| |
|
Figure 3 gives clear patterns of individual changes over time compared to Figure 2. It also shows narrower ranges and better defined curves. This implies that our age determination method seems to work well. Table 1 gives some summary statistics of estimates of  and
and . We noted that 75% of Swift Tern chicks were at most 19.5 days old at first capture.
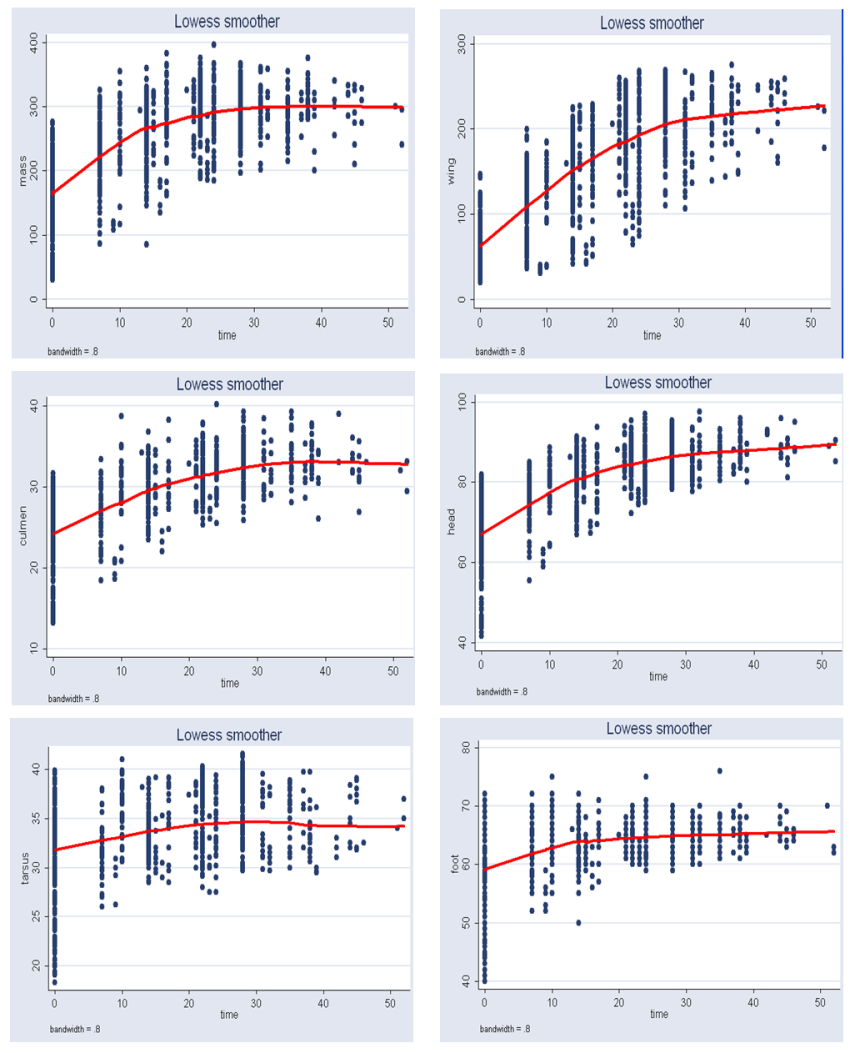 | Figure 2. Loess curves superimposed on growth data for each of the six body features of Swift Terns before age of each chick at first capture was estimated |
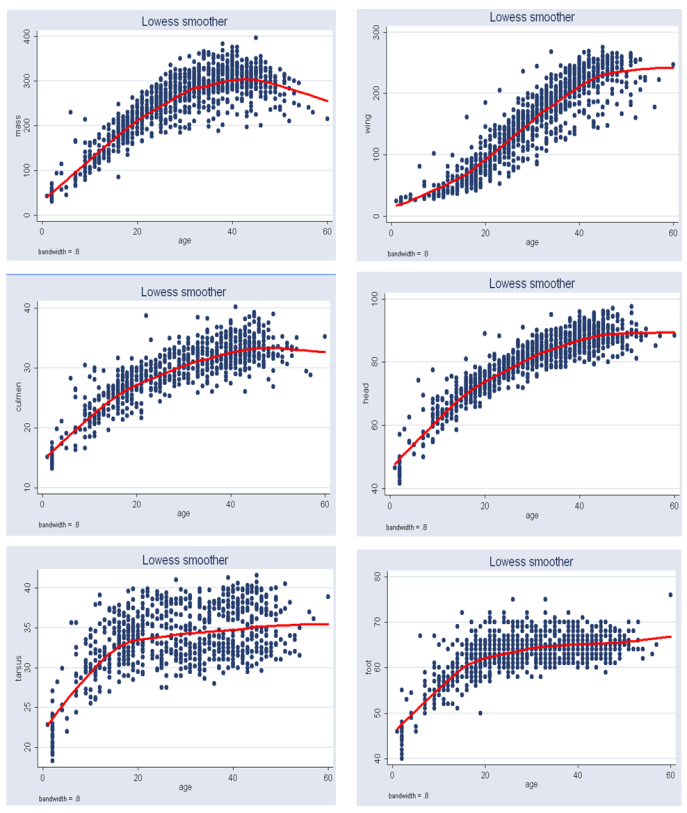 | Figure 3. Loess curves superimposed on growth data for each of the six body features of Swift Terns after age of each chick at first capture was estimated |
3.2. Growth Curves
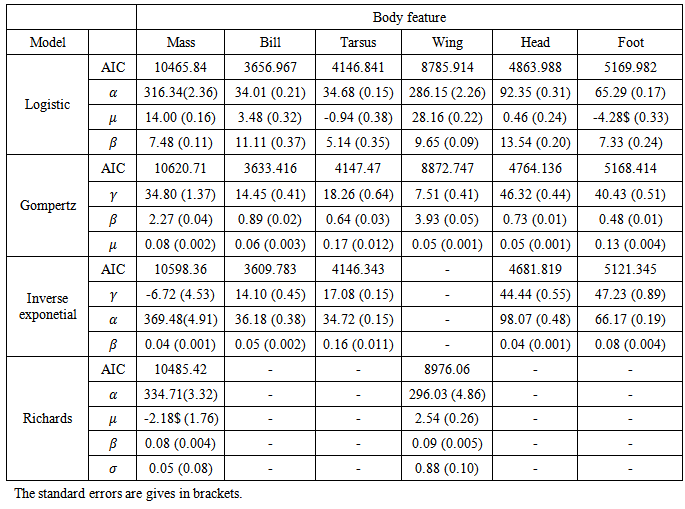
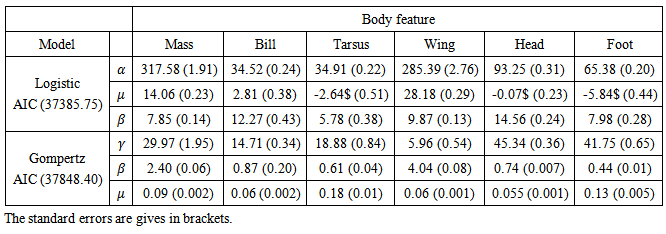
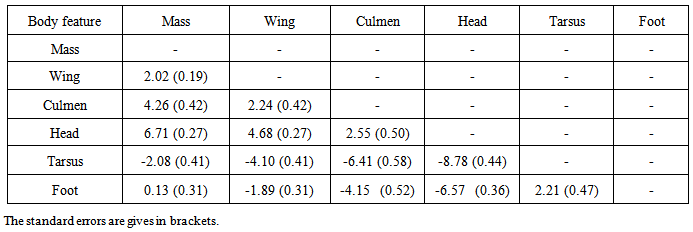
The Logistic, Gompertz, Richards, and inverse exponential models were fitted to each of the body features. Based on the AIC statistic it was found that the inverse exponential model provided the best description of growth for culmen (bill), head, tarsus, and foot; but was a poor model for mass and could not be fitted to wing length (Table 2). The logistic model, with a variance function increasing as a power of fitted values, with a different power for each feature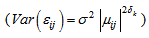 and autoregressive correlation structure for within bird errors with errors from different features within the same subject assumed to be independent
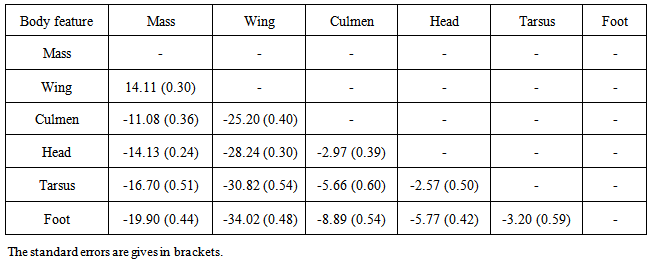
  , gave the best model to describe the growth of all body features taken simultaneously (37385.75 against 37848.40 for Gompertz model, Table 3). Other correlation structures that include second order autoregressive, spherical, unstructured, and compound symmetry correlations were considered. However, the models with all these correlation structures failed to converge for our data. Neither the Richards model nor the inverse exponential model could fit simultaneously all six body features. This was disappointing because the inverse exponential was the best univariate fit for four of the six features. Tables (5, 6) provide differences between estimates of time to reach half of asymptotes among features and between estimates of time to increase from half to three quarters of the asymptotes for different features. A feature in a given row is compared to a feature in any column. For instance, 14.11 (second row and first column of Table 5) indicates that for a wing it took 14.11 days longer to reach half of the maximum wing length than it took mass to reach half of the asymptotic body mass. The value -11.08 (row 1 and column 1 of Table 5) implies that it took the culmen 11.08 days less to reach half of its asymptotic length than it took mass to reach half of the maximum body mass. The interpretation of the values in Table 6 is handled in a similar way as for Table 5.
Table 2. Fixed effects estimates obtained from the univariate growth models for all six body features of Swift Terns
 |
| |
|
Table 3. Fixed effects estimates obtained from the multivariate growth models for the six body features of Swift Terns
 |
| |
|
Table 4. Comparison of parameter estimates obtained from univariate and multivariate models for the six body features of Swift Terns
 |
| |
|
Table 5. Estimates of differences in days between growth parameters μ for the body features of swift terns
 |
| |
|
Table 6. Estimates of differences in days between growth parameters for the body features of Swift Terns
 |
| |
|
Figure 4 reveals that foot and tarsus exhibit similar growth patterns and also that head and bill have same growth patterns. It also shows that the univariate inverse exponential, univariate and multivariate logistic models fitted equally well the bill, head, tarsus and foot growth data.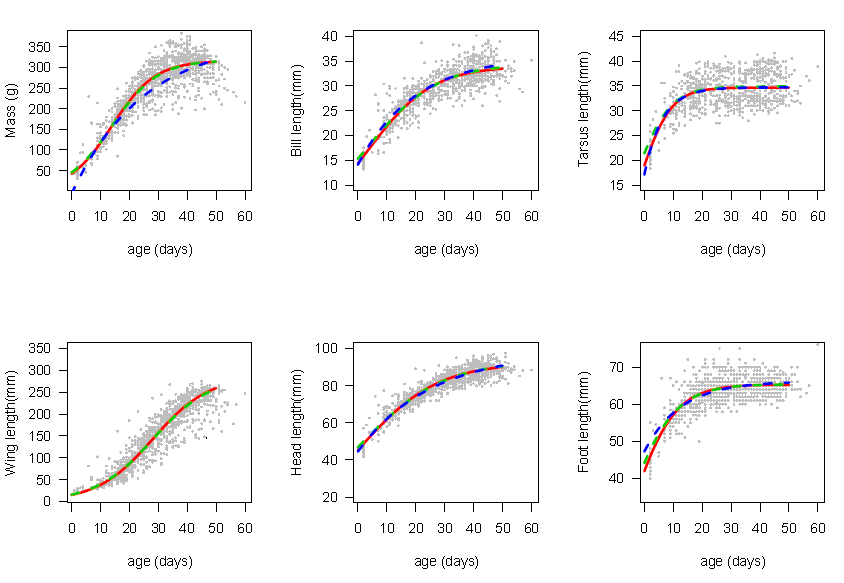 | Figure 4. Predicted curves obtained from univariate inverse exponential (dotted line), univaritae (red line), and multivariate (dotted green line) growth models superimposed on growth data (grey dots) for the six body features of Swift Terns |
For each body feature, the predictions obtained from the logistic multivariate model were scaled by dividing these predictions by the asymptotic value. The scaled values were plotted against time to produce Figure 5, which describes and compares growth of different body features. From this Figure, it may be deduced that the growth of Swift Tern body features follows the following order: (Foot, Tarsus)- (body mass, bill, Head)-Wing.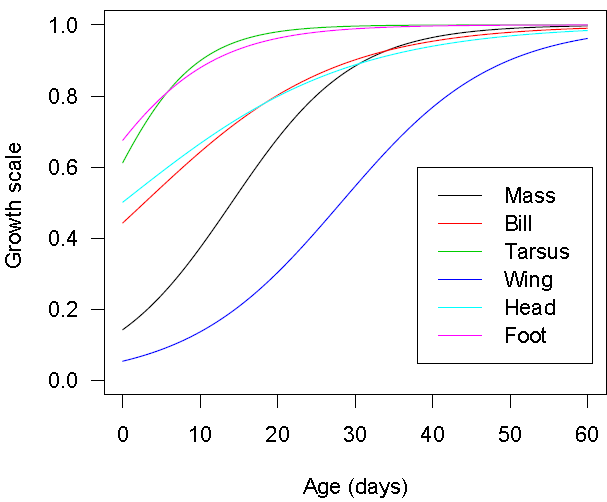 | Figure 5. Scaled predicted growth curves obtained from multivariate logistic growth model for the six body features of Swift Terns |
4. Discussions
The first strength with our approach of modelling simultaneously multiple responses is that it becomes straightforward to carry out a comparison of growth between the different body features. The multivariate logistic model provides an easy and meaningful multiple comparison of growth rates between features as all growth parameters have the same units (days) irrespective of units of the features. With our approach, based on fixed effects parameters, we can carry out comparisons between different responses and easily generate estimates of confidence intervals (CI) for differences in parameter estimates for different responses whereas, with the approach described by [3, 4], these comparisons would be based on comparing predicted outcome.Swift Tern data was analysed by [8] using the non-parametric approach to fitting growth curves. Our non-linear mixed effects method and the non-parametric method [8] gave similar shapes of growth curves for the body features of Swift Terns. On one hand, [9] showed that the Gompertz model is a reasonable approximation to growth patterns of seabirds. On the other hand, [8] showed that Gompertz model did not provide good fit to Swift Tern data. Our findings, however, suggest that the (multivariate) Gompertz model gives a good description of growth of body features of Swift Terns which agrees with [9]. Our estimates of asymptotic growth lengths for the tarsus and foot are similar to the mean adult lengths given in [8]. Asymptotic mass, maximum wing length and asymptotic head length obtained from our results are reasonably close to mean adult measurements given in [8] for these features. However, a large discrepancy between our maximum bill length estimate (34.52 mm) and mean adult bill length [8] (63.6 mm) was observed. One reason for this discrepancy is that measurements have stopped well before the bill has completed its growth, and our asymptote estimate is an extrapolation beyond the range of available data. From our results, it seems that development of the body features of Swift Terns is as follows (foot, tarsus, body, mass)-(bill, head)-(wing) whereas legs-wing-bill was the order given in [8]. This implies that the bill growth was estimated to reach the maximum length before the wing but in reality the bill of a Swift Tern is believed to continue to grow at very low rate for longer period after fledging.The second strength with our approach is that since we can bring in the feature covariate into our variance function (in our case, especially by allowing different power functions for different features) we are able to some extent to overcome the problem of differential scales for responses. However, this method is only of use when the same structural form is applicable for all responses. In our study, we assumed the same structural model for all response variables (body features). Although this approach allowed us to solve a multivariate problem, it presents a major drawback if different features require different structural functions. Attempts to fit different structural models to responses from different features using the approach described by [3, 4] ran into estimation problems when using nlme (non-linear mixed effects) procedure in R. Therefore, further work is needed to suit multiple responses with different structural forms for groups of responses.In this study we fitted different variance functions successfully for the univariate modelling approach. However, for the multivariate modelling approach, we could only impose the same variance functions (albeit with differential power parameters for each feature) and correlation functions (compound symmetry or first order autoregressive correlation structure) for all features with errors from different body features within the same bird were assumed to be independent, for convergence purpose. Thus, we recommend future investigation in variance functions and correlation structures for each feature within the same bird for the multivariate approach. Due to estimation problems, we were restricted to a block diagonal structure for the variance-covariance structure for random effects. Other forms of variance-covariance matrix for random effects, such as an unstructured form, might improve the model provided that convergence is attained. Lastly, we do recommend for further research on computational methods on non-linear mixed effects model estimation.
5. Conclusions
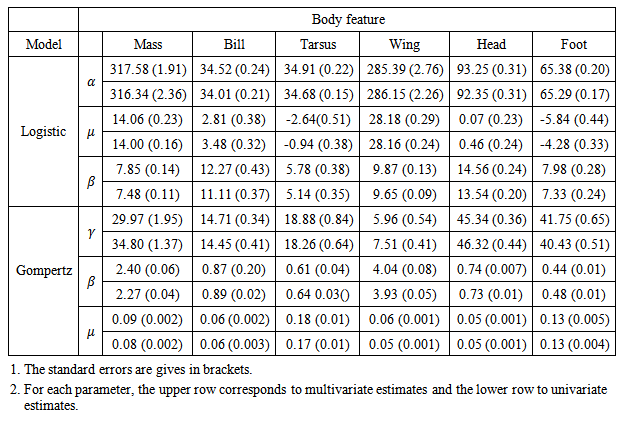
Firstly, we found that Logistic and Gompertz models gave a good description of growth models of body features of Swift Terns compared to other growth models investigated in this study.Secondly, we observed that univariate and multivariate modelling approaches yielded approximately the same parameter estimates. Estimates obtained from univariate models did not differ substantially from those obtained from the multivariate models. With multivariate modelling approach, it was possible to explore correlation between body features to some extent. Thirdly, we observed that the completion of growth for the body features occurs in a specific sequence. The body features do not all grow at the same rate and the growth is not completed at the same time. For foot, tarsus, head, and culmen (bill), more than 40% of the growth occurred during the incubation period whereas body mass and wing length have less than 20% of their growth completed during incubation. The asymptotes are reached at different times. The completion of the growth for different body features of Swift Tern chicks occurs in the following pattern: (tarsus, foot)-(body mass, bill, head)-(wing).
ACKNOWLEDGEMENTS
We would like to thank the Avian Demographic Unit for providing us with the Swift Tern data set used in this study.
References
| [1] | Seber, G. and Wild, C. J. (2005). Nonlinear regression, John Wiley & Sons, New York. |
| [2] | Narushin, V. G. and Takma, C. (2003). Sigmoid Model for the Evaluation of Growth and Production Curves in Laying Hens, Biosystems Engineering 84: 343-348. |
| [3] | Hall, D. B. and Clutter, M. (2004). Multivariate Multilevel Nonlinear Mixed Effects Models for Timber Yield Predictions, Biometrics 60: 16-24. |
| [4] | Davidian, M. and Giltinan, D. M. (1995). Nonlinear Models for Repeated Measurement Data, Chapman & Hall, New York. |
| [5] | Cooper, J., Crawford, R. J. M. and Williams, A. J. (1990). Distribution, population size and conservation of the Swift Tern Sterna bergii in southern Africa, Ostrich 61: 56-65. |
| [6] | Hockey, P. A. R., Dean, W. R. J. and Ryan, P. G. (2005). Roberts - Birds of southern Africa. |
| [7] | R Development Core Team (2006). R: A Language and Environment for Statistical Computing, R Foundation for Statistical Computing, Vienna, Austria |
| [8] | Le Roux, J. (2006). The Swift Tern Sterna bergii in Southern Africa: Growth and Movement, Mastersthesis, University of Cape Town. |
| [9] | Ricklefs, R. E. (1973). Patterns of growth in birds. II. Growth and rate of mode of development, Ibis 115: 177-201. |
 Abstract
 Reference
 Full-Text PDF
 Full-text HTML